OSegNet: Operational Segmentation Network for COVID-19 Detection using Chest X-ray Images
Coronavirus disease 2019 (COVID-19) has been diagnosed automatically using Machine Learning algorithms over chest X-ray (CXR) images. However, most of the earlier studies used Deep Learning models over scarce datasets bearing the risk of overfitting.…
Authors: Aysen Degerli, Serkan Kiranyaz, Muhammad E. H. Chowdhury
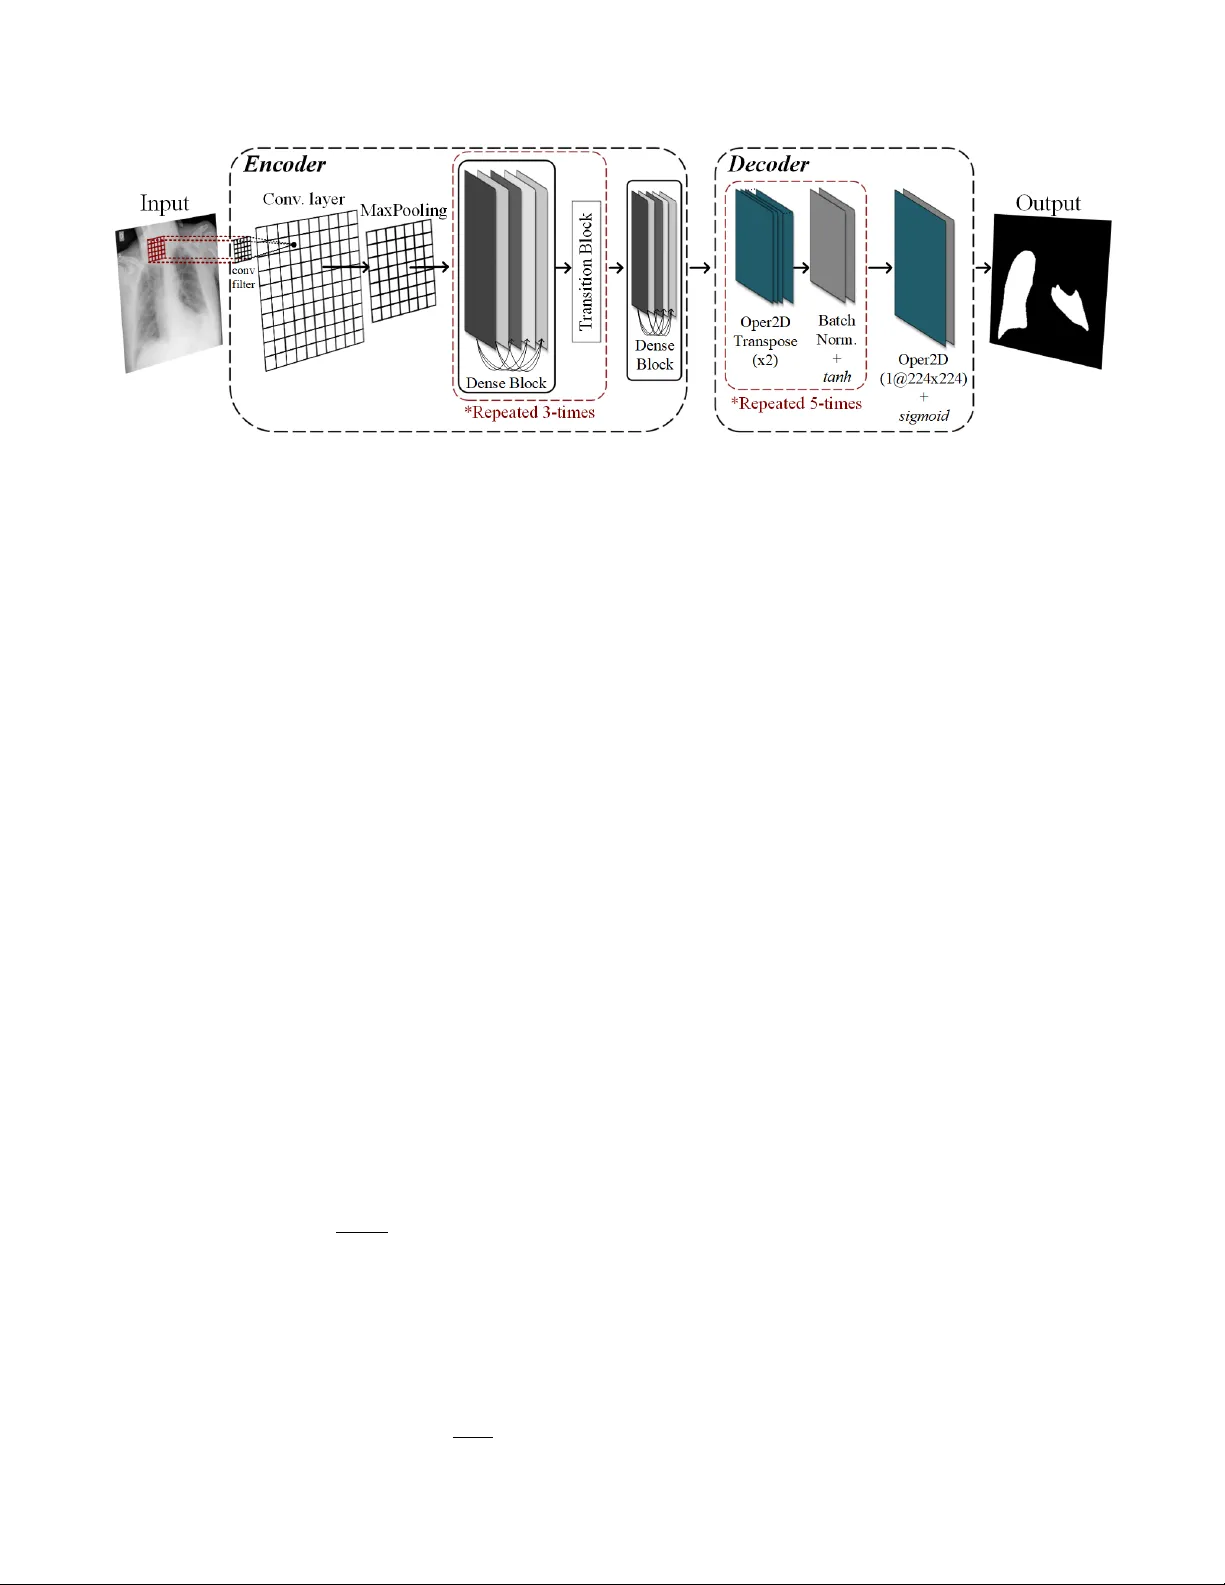
OSEGNET : OPERA TIONAL SEGMENT A TION NETW ORK FOR CO VID-19 DETECTION USING CHEST X-RA Y IMA GES A ysen De gerli † , Serkan Kiranyaz ∗ , Muhammad E. H. Chowdhury ∗ , and Moncef Gabbouj † † Faculty of Information T echnology and Communication Sciences, T ampere Uni versity , T ampere, Finland ∗ Department of Electrical Engineering, Qatar Uni versity , Doha, Qatar ABSTRA CT Coronavirus disease 2019 (CO VID-19) has been diagnosed automat- ically using Machine Learning algorithms ov er chest X-ray (CXR) images. Howe ver , most of the earlier studies used Deep Learning models ov er scarce datasets bearing the risk of overfitting. Addi- tionally , previous studies have rev ealed the fact that deep networks are not reliable for classification since their decisions may originate from irrelev ant areas on the CXRs. Therefore, in this study , we pro- pose Operational Segmentation Network (OSegNet) that performs detection by segmenting CO VID-19 pneumonia for a reliable di- agnosis. T o address the data scarcity encountered in training and especially in evaluation, this study extends the largest CO VID-19 CXR dataset: QaT a-COV19 with 121 , 378 CXRs including 9258 CO VID-19 samples with their corresponding ground-truth segmen- tation masks that are publicly shared with the research community . Consequently , OSegNet has achiev ed a detection performance with the highest accuracy of 99 . 65% among the state-of-the-art deep mod- els with 98 . 09% precision. Index T erms — SARS-CoV -2, CO VID-19, Machine Learning, Deep Learning 1. INTR ODUCTION Coronavirus disease 2019 (CO VID-19), caused by sev ere acute res- piratory syndrome coronavirus-2 (SARS-CoV -2), has infected mil- lions after it was first reported in 2019. The W orld Health Or ga- nization (WHO) has declared COVID-19 as a pandemic since it is highly contagious (especially its mutations), and af fects seriously immunocompromised patients and elderly [1]. Howe ver , perform- ing a reliable diagnosis of CO VID-19 is challenging since it re veals similar symptoms such as cough, breathlessness, and fe ver compared to other viral diseases [2]. Moreover , CO VID-19 may not be always symptomatic, causing asymptomatic individuals to spread the dis- ease to population [3]. Consequently , computer-aided diagnosis is necessary to perform fast and accurate CO VID-19 detection to pre- vent the further spread of the disease. CO VID-19 diagnosis can be performed via nucleic acid detec- tion with real-time polymerase chain reaction (R T -PCR) and imag- ing techniques: computed tomography (CT) and chest X-ray (CXR) imaging. Even though R T -PCR is defined as the reference standard to diagnose CO VID-19, it lacks stability in the laboratory test re- sults with high false-ne gatives rate [4]. Contrary to R T -PCR, CT has higher sensitivity level [5]. Howe ver , its clinical utility is limited especially for asymptomatic individuals [6]. Thus, CXR imaging is This study was supported by the NSF-Business Finland Center for V isual and Decision Informatics (CVDI) Adv anced Machine Learning for Industrial Applications (AMaLIA) project under Grant 4183/31/2021. widely used due to its fast acquisition, easy accessibility , less radi- ation exposure, and lower risk of cross-infection among other diag- nostic tools [7]. Deep Learning (DL) has achiev ed a remarkable performance in the CO VID-19 diagnosis using CXRs. Many studies [8–12] used DL models to perform CO VID-19 classification by transfer learn- ing. Howe ver , they have evaluated the performance of deep networks only over scarce and limited size datasets. The data scarcity has the potential to cause o verfitting since DL models need significantly large amount of data for generalization. Moreover , the control group of the aforementioned studies contains only healthy subjects or lim- ited thoracic diseases, i.e. bacterial or other viral pneumonia against CO VID-19 pneumonia. Thus, their clinical usage is unfeasible for real-case scenarios. Additionally , sev eral studies [13–15] have in- vestigated the decision-making process of deep models in classifica- tion tasks. Accordingly , the unreliability of DL models was re vealed by the acti vation maps, where their attention was on the irrelev ant areas of CXRs, such as background, text, or bones rather than the lungs. Thus, few studies [16, 17] performed CO VID-19 pneumonia segmentation for a reliable CO VID-19 detection with deep networks using CXRs. In this study , to address the aforementioned limitations, we pro- pose O perational Seg mentation Net work (OSegNet) that performs CO VID-19 pneumonia segmentation for the diagnosis using CXR images. Contrary to con volutional layers used in many deep net- works, operational layers with generati ve neurons of Self-Organized Operational Neural Networks (Self-ONNs) [18–22] are used in the decoder block. Self-ONNs are heterogeneous network models with generativ e neurons that can create any non-linear transformation in each kernel element. Such diversity does not only yield a superior learning performance b ut also allows a significant reduction in the network depth and complexity . The proposed OSegNet has an au- toencoder structure except that operational layers are used at the decoder as illustrated in Fig. 1. Thus, this study uses operational layers for the first time for image segmentation. Additionally , in this study , the QaT aCO V -19 dataset that was introduced previously by our study [16] is extended to reach 9258 CO VID-19 samples with their corresponding ground-truth segmentation masks. Thus, together with a control group of 112 , 120 CXRs from healthy sub- jects and 14 dif ferent thoracic diseases, QaT a-CO V19 1 is the largest publicly av ailable dataset for CO VID-19 pneumonia segmentation ov er CXR images. The rest of the paper is or ganized as follows. The proposed OS- egNet model and QaT aCO V -19 dataset are introduced in Section 2. The experimental results and conclusion are gi ven in Section 3 and Section 4, respectiv ely . 1 The benchmark QaT a-COV19 is publicly shared at the repository https://www .kaggle.com/aysendegerli/qatacov19-dataset. Fig. 1 : The proposed OSegNet model for CO VID-19 pneumonia segmentation is illustrated, where the transfer learning is performed at the encoder block, and operational layers (Oper2D) are used at the decoder block. 2. METHODOLOGY AND MA TERIALS In this section, the proposed OSegNet model is first introduced, and then, the details of the benchmark QaT a-CO V19 dataset are pre- sented. 2.1. OSegNet: Operational Segmentation Network Con volutional Neural Networks (CNNs) are widely used for man y computer vision tasks including CO VID-19 diagnosis. Ho wev er, the potential of CNNs is limited due to the homogeneous network struc- ture and linear neuron model. Thus, many studies ha ve proposed deeper structures with skipping connections to diverse the modality of CNNs for boosting their performance. Furthermore, the perfor- mance is increased with transfer learning that helps to faster and stable con vergence of the model. Contrary to conv olutional layers, operational layers [18] hav e a generativ e neuron model that can create any non-linear transforma- tion of each kernel element to achieve a highly heterogeneous net- work. Accordingly , each neuron input, x l at layer , l is calculated as follows: x l = b l + N ∑ j = 1 Φ ( w j l , y j ( l − 1 ) ) , (1) where b is the bias, N is the number of neurons at the previous layer , and a nodal operation, Φ is performed between the weights of the layer , w l and the outputs of the previous layer, y ( l − 1 ) . Nodal oper- ator functions are generated during back-propagation training using T aylor polynomial approximation of any non-linear function. Thus, nodal operator functions can define any arbitrary function, f ( x ) as the infinite sums of the function’ s deriv atives at a point ( x = a ) as follows: f ( x ) = ∞ ∑ n = 0 f ( n ) ( a ) n ! ( x − a ) n , (2) where f ( n ) ( a ) is the n th deriv ative of f at the point a , and n ! is the factorial of n . Accordingly , nodal operator functions can be trun- cated by the Q th order T aylor approximation as follows: Φ ( w , y ) = Q ∑ q = 0 w q ( y − a ) q , (3) where w is the array that contains weights w q = f ( q ) ( a ) q ! . The Maclau- rin series representation of (3) can be formulated for a = 0 using the tangent hyperbolic ( tanh ) activation function that maps the neuron outputs into [ − 1 , 1 ] as follo ws: Φ ( w , y ) = Q ∑ q = 1 w q ( y ) q , (4) where w 0 is dropped due to the compensation from the common bias element, b of each neuron. The structure of OSegNet is sim- ilar to an autoencoder that maps the input image, I to its output mask, M : M ← ϒ ε , δ ( I ) , where the network ϒ consists of encoder ε , and decoder δ parts as depicted in Fig. 1. Accordingly , the OS- egNet encoder is composed of a state-of-the-art model, where its weights are initialized with the ImageNet weights by transfer learn- ing. The proposed model has operational layers as decoding the fea- tures of the state-of-the-art model, where the decoder δ ∈ { b l , w l } L l = 1 consists of L number of operational layers composed of five de- coder blocks. Each decoder block includes an operational transpose layer for upsampling by × 2, batch normalization, and tanh activation function. The output of the last block is attached to an operational layer with sigmoid activ ation function. For each operational layer, kernel size of k = ( 3 × 3 ) is used sequentially with the filter sizes of { 128 , 64 , 32 , 16 , 8 , 1 } . Finally , OSegNet is trained ov er S number of samples { ι i t rain , µ i t rain } S i = 1 , where ι and µ are training data and ground-truth masks, respectiv ely . In this study , the state-of-the-art networks: DenseNet-121 [23] and Inception-v3 [24], where their weights are initialized with the ImageNet weights by transfer learning are used as the encoder of the OSegNet model. Additionally , the decoder structures: UNet++ [25] and DLA [26] that merges encoder and decoder with skipping connections and nested con volutional blocks used as the competing networks against the proposed model. 2.2. QaT a-CO V19 Dataset T ampere Univ ersity and Qatar Univ ersity researchers have com- piled the QaT a-CO V19 dataset that is the largest CXR dataset for CO VID-19 pneumonia segmentation. The control group images of the dataset are obtained from ChestX-ray14 dataset [27] that consists of 112 , 120 CXRs from healthy subjects and 14 different thoracic diseases. Additionally , 9258 CO VID-19 images are col- lected from the publicly av ailable BIMCV -CO VID19+ dataset [28] along with the CXRs from our pre vious study [16]. In this study , T able 1 : CO VID-19 pneumonia se gmentation performance results (%) computed o ver the test (unseen data) set of QaT a-COV19 dataset using state-of-the-art and the proposed OSegNet models. Encoder Model Sensitivity Specificity Precision F1-Score F2-Score Accuracy DenseNet-121 UNet++ 83 . 16 99.91 89 . 56 86 . 24 84 . 37 99 . 76 DLA 84 . 65 99.91 89 . 13 86 . 83 85 . 51 99 . 77 OSegNet ( Q = 1 ) 83 . 56 99.91 89 . 60 86 . 47 84 . 70 99 . 76 OSegNet ( Q = 2 ) 86 . 32 99 . 89 87 . 57 86 . 94 86 . 56 99 . 76 OSegNet ( Q = 3 ) 87.25 99 . 89 87 . 58 87.42 87.32 99 . 77 OSegNet ( Q = 4 ) 84 . 96 99.91 89.85 87 . 33 85 . 89 99.78 OSegNet ( Q = 5 ) 86 . 88 99 . 86 85 . 23 86 . 04 86 . 54 99 . 74 Inception-v3 UNet++ 88 . 95 99 . 86 85 . 33 87 . 10 88 . 20 99 . 76 DLA 86 . 23 99.91 89.63 87.89 86 . 89 99.78 OSegNet ( Q = 1 ) 86 . 47 99 . 78 78 . 18 82 . 12 84 . 67 99 . 66 OSegNet ( Q = 2 ) 88 . 09 99 . 88 87 . 31 87 . 70 87 . 93 99.78 OSegNet ( Q = 3 ) 89.36 99 . 87 86 . 37 87 . 84 88.75 99.78 OSegNet ( Q = 4 ) 87 . 70 99 . 89 87 . 69 87 . 70 87 . 70 99.78 OSegNet ( Q = 5 ) 88 . 33 99 . 88 86 . 78 87 . 55 88 . 02 99 . 77 T able 2 : Details of QaT a-CO V19 dataset. Data T raining Samples Augmented Augmented T raining Samples T est Samples ChestX-ray14 86 , 524 7 86 , 524 25 , 596 CO VID-19 7145 3 20 , 000 2113 T otal 93,669 106,524 27,709 we annotated the CXRs of BIMCV -COVID19+ [28] to create the extended version of QaT a-CO V19. For this purpose, we ha ve first eliminated the acquisitions from the same patient, session, and run in BIMCV -COVID19+ [28] to remo ve an y duplications. The ground-truths of CXRs are generated by the collaborati ve human-machine annotation approach that enables fast and accurate annotation of CO VID-19 pneumonia re gions using deep networks inspired by U-Net [29], UNet++ [25], and DLA [26] architectures as used in our previous study [16]. These networks are trained by previously annotated 2951 CO VID-19 samples and 12 , 544 healthy subjects that are from the group-I data in [16]. The trained segmen- tation networks are used to predict the ground-truth masks of 6307 CXRs from BIMCV -CO VID19+ [28]. Accordingly , the best predic- tions of the segmentation networks are selected as the ground-truth segmentation masks by the collaboration of expert medical doctors. At last, the predicted se gmentation masks of only 31 CXR images are not selected since they are not accurate enough; hence, they are manually drawn by medical doctors. T able 2 sho ws the details of QaT a-COV19 dataset. Since the train and test sets of ChestX-ray14 [27] are predefined, CO VID-19 samples are split with the same train/test ratio as in [27] by taking the patient information into account; thus, they contain dif ferent sub- jects. The CXRs in QaT aCO V -19 dataset are resized to 224 × 224 pixels. W e have applied data augmentation using the Image Data Generator in Keras. Accordingly , CXRs are randomly rotated in a 10 − degree range and 10% shifted vertically and horizontally with the near est mode to fill pixels outside the input boundaries. 3. EXPERIMENT AL EV ALU A TION In this section, the experimental setup is introduced. Then, the ex- perimental results are reported ov er the QaT a-CO V19 dataset. 3.1. Experimental Setup The experimental e valuations are performed over the test (unseen) set of the QaT aCO V -19 dataset. CO VID-19 pneumonia segmenta- tion is ev aluated on a pixel lev el, where foreground (pneumonia) and background are considered as positive-class and negativ e-class, respectiv ely . Accordingly , the standard performance metrics are calculated as follo ws: sensitivity is the ratio of correctly identified CO VID-19 samples in the positi ve class, specificity is the rate of correctly detected control group samples in the negativ e class, pre- cision is the ratio of correctly detected CO VID-19 samples among the samples that are detected as positive class, accuracy is the ratio of correctly identified samples in the dataset. Lastly , the F-score is defined as follows: F ( β ) − Score = ( 1 + β 2 ) ( pr ecision × sensitivity ) β 2 × precision + sensitivity , (5) where F 1 − Score is the harmonic average between sensitivity and pr ecision for β = 1, whereas F 2 − Score tolerates sensitivity metric for β = 2. Accordingly , the objective is to achiev e a high sensitivity lev el and F 1 − Score as minimizing the false alarm (1 − specificity ). The networks are implemented with the T ensorFlow library on NV idia ® GeForce R TX 2080 Ti GPU card. For the optimizer , we hav e used Adam with its default parameter settings. Furthermore, a hybrid loss function is used that combines dice and focal loss by summation. Let the ground-truth mask be K , where the pixel label is κ , and the model prediction is ˆ κ . Accordingly , the probabilities are defined as P ( κ = 1 ) = p and P ( ˆ κ = 1 ) = q . Thus, we define the dice loss as follows: D ( p , q ) = 1 − 2 ∑ p h , ω q h , ω ∑ p h , ω + ∑ q h , ω , (6) where h and ω are the indices of height and width of the CXRs. Furthermore, the focal loss is defined as follows: F ( p , q ) = − α ( 1 − q ) γ p log q − ( 1 − α ) q γ ( 1 − p ) log ( 1 − q ) , (7) where the parameters are set as γ = 2 and α = 0 . 25. Accordingly , models are trained ov er 50 − epochs with a learning rate of 10 − 4 . T able 3 : COVID-19 detection performance results (%) computed over the test (unseen data) set of QaT a-CO V19 dataset using state-of-the-art and the proposed OSegNet models. Encoder Model Sensitivity Specificity Precision F1-Score F2-Score Accuracy DenseNet-121 UNet++ 94 . 32 99.87 98.37 96 . 30 95 . 10 99 . 45 DLA 94 . 60 99 . 76 97 . 04 95 . 81 95 . 08 99 . 37 OSegNet ( Q = 1 ) 98.15 99 . 65 95 . 89 97 . 01 97.69 99 . 54 OSegNet ( Q = 2 ) 97 . 68 99 . 71 96 . 58 97 . 13 97 . 46 99 . 56 OSegNet ( Q = 3 ) 97 . 59 99 . 70 96 . 45 97 . 01 97 . 36 99 . 54 OSegNet ( Q = 4 ) 97 . 44 99 . 83 97 . 95 97.70 97 . 55 99.65 OSegNet ( Q = 5 ) 95 . 55 99 . 78 97 . 30 96 . 42 95 . 90 99 . 46 Inception-v3 UNet++ 98.53 99 . 56 94 . 85 96 . 66 97.77 99 . 48 DLA 96 . 78 99.84 98 . 08 97 . 43 97 . 04 99 . 61 OSegNet ( Q = 1 ) 97 . 87 97 . 93 79 . 57 87 . 78 93 . 57 97 . 92 OSegNet ( Q = 2 ) 97 . 54 99 . 78 97 . 35 97 . 45 97 . 50 99 . 61 OSegNet ( Q = 3 ) 97 . 35 99.84 98.09 97.72 97 . 50 99.65 OSegNet ( Q = 4 ) 97 . 35 99 . 82 97 . 81 97 . 58 97 . 44 99 . 63 OSegNet ( Q = 5 ) 98 . 01 99 . 73 96 . 78 97 . 39 97 . 76 99 . 60 3.2. Experimental Results In this section, we report the performances of CO VID-19 pneumonia segmentation and detection. The COVID-19 pneumonia segmen- tation results are shown in T able 1, where state-of-the-art and the proposed OSegNet models are compared. The variation in the per- formance of OSegNet is inv estigated by changing the Q parameter . Primarily , we have observ ed that each model has achieved a suc- cessful pneumonia segmentation with an F1 − Score of > 86% and specificity of > 99 . 75%. It can be seen from T able 1 that any model with the encoder of Inception-v3 outperforms DenseNet-121 simply due to its complex structure and higher number of trainable param- eters. Accordingly , among state-of-the-art models, the best segmen- tation performance has been achieved by the duo of UNet++ and Inception-v3 with an F2 − Score of 88 . 20%. Nevertheless, the OS- egNet ( Q = 3 ) with Inception-v3 encoder has achieved the highest sensitivity le vel of 89 . 36% and F2 − Score of 88 . 75% among all. The detection performances are presented in T able 3, which are calculated per CXR sample. Accordingly , a CXR sample is clas- sified as COVID-19 if any pixel in the output mask is predicted as CO VID-19 pneumonia. The duo of UNet++ and Inception-v3 holds the best detection performance among state-of-the-art with the high- est sensitivity level of 98 . 53%. Ne vertheless, the highest F1 − Score of 97 . 72% and accuracy of 99 . 65% has been achieved once again T able 4 : Confusion matrices of the best computing UNet++ and the proposed OSegNet ( Q = 3 ) models with Inception-v3 encoders for CO VID-19 detection. (a) Confusion Matrix UNet++ UNet++ Predicted Control Group CO VID-19 Ground T ruth Control Group 25483 113 CO VID-19 31 2082 (b) Confusion Matrix OSegNet ( Q = 3 ) OSegNet Predicted Control Group CO VID-19 Ground T ruth Control Group 25556 40 CO VID-19 56 2057 by the OSegNet ( Q = 3 ) model. Accordingly , the confusion matri- ces of the best computing models: UNet++ and OSegNet ( Q = 3 ) with Inception-v3 encoders are given in T able 4. It is observed that UNet++ only misses 31 COVID-19 cases, whereas OSegNet ( Q = 3 ) has lower false alarms with only 40 samples. Lastly , T able 5 sho ws that OSe gNet ( Q = 3 ) model has 3 . 6M and 1 . 2M less number of pa- rameters with faster inference time compared to the UNet++ model for both DenseNet-121 and Inception-v3 versions, respecti vely . 4. CONCLUSIONS Computer-aided diagnosis plays a vital role in the CO VID-19 detec- tion to prevent the further spread of the disease. As a major con- tribution, this study publicly shares the largest CXR dataset, QaT a- CO V19 which consists of 9258 CO VID-19 samples with their corre- sponding ground-truth segmentation masks along with 112 , 120 con- trol group CXRs. The experimental results ov er the QaT a-CO V19 dataset show that the proposed OSegNet model has achiev ed the highest sensiti vity lev el of 89 . 36% for the CO VID-19 segmentation, and precision of 98 . 09% for the CO VID-19 detection while the net- work complexity and depth has been reduced. T able 5 : The number of trainable and non-trainable parameters of the models with their inference time (ms) per sample. Model T rainable Non-T rainable Time DenseNet-121 UNet++ 14 . 40M 88 . 45K 4 . 9115 DLA 13 . 15M 88 . 45K 4 . 4265 OSegNet ( Q = 1 ) 8 . 23M 84 . 14K 1 . 8652 OSegNet ( Q = 2 ) 9 . 51M 84 . 14K 2 . 0525 OSegNet ( Q = 3 ) 10 . 79M 84 . 14K 2 . 2201 OSegNet ( Q = 4 ) 12 . 07M 84 . 14K 2 . 3932 OSegNet ( Q = 5 ) 13 . 34M 84 . 14K 2 . 5674 Inception-v3 UNet++ 30 . 43M 39 . 23K 5 . 0247 DLA 28 . 96M 39 . 23K 4 . 5111 OSegNet ( Q = 1 ) 24 . 23M 34 . 93K 1 . 7533 OSegNet ( Q = 2 ) 26 . 68M 34 . 93K 2 . 0046 OSegNet ( Q = 3 ) 29 . 14M 34 . 93K 2 . 1807 OSegNet ( Q = 4 ) 31 . 60M 34 . 93K 2 . 3575 OSegNet ( Q = 5 ) 34 . 06M 34 . 93K 2 . 5469 5. REFERENCES [1] A. V ishnevetsk y and M. Levy , “Rethinking high-risk groups in covid-19, ” Mult. Scler . Relat. Disord. , vol. 42, pp. 102139, 2020. [2] T . Singhal, “ A re view of corona virus disease-2019 (co vid-19), ” Indian J. P ediatr . , vol. 87, no. 4, pp. 281–286, 2020. [3] J. R. Larsen, M. R. Martin, J. D. Martin, P . Kuhn, and J. B. Hicks, “Modeling the onset of symptoms of covid-19, ” F r ont. Public Health , vol. 8, 2020. [4] A. T ahamtan and A. Ardebili, “Real-time rt-pcr in covid-19 de- tection: issues affecting the results, ” Expert Rev . Mol. Diagn. , vol. 20, no. 5, 2020. [5] A. Bernheim, X. Mei, M. Huang, Y . Y ang, Z. A. Fayad, N. Zhang, K. Diao, B. Lin, X. Zhu, K. Li, et al., “Chest ct findings in coronavirus disease-19 (covid-19): relationship to duration of infection, ” Radiology , vol. 295, no. 3, pp. 200463, 2020. [6] J. V . W aller, P . Kaur , A. Tuck er , K. K. Lin, M. J. Diaz, T . S. Henry , and M. Hope, “Diagnostic tools for coronavirus disease (covid-19): comparing ct and rt-pcr viral nucleic acid testing, ” Am. J. Roentg enol. , vol. 215, no. 4, pp. 834–838, 2020. [7] D. Cozzi, M. Albanesi, E. Ca vigli, C. Moroni, A. Bindi, S. Lu- var ` a, S. Lucarini, S. Busoni, L. N. Mazzoni, and V . Miele, “Chest x-ray in new coronavirus disease 2019 (covid-19) infec- tion: findings and correlation with clinical outcome, ” Radiol. Med. , vol. 125, no. 8, pp. 730–737, 2020. [8] A. Narin, C. Kaya, and Z. Pamuk, “ Automatic detection of coronavirus disease (covid-19) using x-ray images and deep con volutional neural networks, ” P attern. Anal. Appl. , vol. 24, no. 3, pp. 1207–1220, 2021. [9] I. D. Apostolopoulos and T . A. Mpesiana, “Covid-19: auto- matic detection from x-ray images utilizing transfer learning with conv olutional neural networks, ” Phys. Eng. Sci. Med. , vol. 43, no. 2, pp. 635–640, 2020. [10] L. W ang, Z. Q. Lin, and A. W ong, “Covid-net: A tailored deep con volutional neural network design for detection of covid-19 cases from chest x-ray images, ” Sci. Rep. , vol. 10, no. 19549, 2020. [11] N. K. Chowdhury , M. M. Rahman, and M. A Kabir , “Pdcovid- net: a parallel-dilated conv olutional neural network architec- ture for detecting covid-19 from chest x-ray images, ” Health Inf. Sci. Syst. , v ol. 8, no. 1, pp. 1–14, 2020. [12] T . D. Pham, “Classification of covid-19 chest x-rays with deep learning: new models or fine tuning?, ” Health Inf. Sci. Syst. , vol. 9, no. 1, pp. 1–11, 2021. [13] A. Degerli, M. Ahishali, S. Kiranyaz, M. E. H. Cho wdhury , and M. Gabbouj, “Reliable covid-19 detection using chest x- ray images, ” in IEEE Int. Conf. Image Pr ocess. (ICIP) , 2021, pp. 185–189. [14] D. Keidar , D. Y aron, E. Goldstein, Y . Shachar , A. Blass, L. Charbinsky , I. Aharony , L. Lifshitz, D. Lumelsky , Z. Nee- man, et al., “Covid-19 classification of x-ray images using deep neural netw orks, ” Eur . Radiol. , vol. 31, no. 12, pp. 9654–9663, 2021. [15] A. M. T ahir, Y . Qiblawe y , A. Khandakar , T . Rahman, U. Khur - shid, F . Musharavati, M. Islam, S. Kiranyaz, S. Al-Maadeed, and M. E. H. Chowdhury , “Deep learning for reliable classi- fication of covid-19, mers, and sars from chest x-ray images, ” Cognit. Comput. , pp. 1–21, 2022. [16] A. De gerli, M. Ahishali, M. Y amac, S. Kiranyaz, M. E. H. Chowdhury , K. Hameed, T . Hamid, R. Mazhar , and M. Gab- bouj, “Covid-19 infection map generation and detection from chest x-ray images, ” Health Inf. Sci. Syst. , v ol. 9, no. 1, pp. 1–16, 2021. [17] A. M. T ahir, M. E. H. Chowdhury , A. Khandakar , T . Rahman, Y . Qibla wey , U. Khurshid, S. Kiran yaz, N. Ibtehaz, M. S. Rah- man, S. Al-Maadeed, et al., “Covid-19 infection localization and severity grading from chest x-ray images, ” Comput. Biol. Med. , vol. 139, pp. 105002, 2021. [18] S. Kiranyaz, J. Malik, H. B. Abdallah, T . Ince, A. Iosifidis, and M. Gabbouj, “Self-organized operational neural networks with generative neurons, ” Neural Netw . , v ol. 140, pp. 294–308, 2021. [19] J. Malik, S. Kiranyaz, and M. Gabbouj, “Self-organized opera- tional neural networks for sev ere image restoration problems, ” Neural Netw . , vol. 135, pp. 201–211, 2021. [20] M. A. Yılmaz, O. K eles ¸ , H. G ¨ uven, A. M. T ekalp, J. Malik, and S. Kıranyaz, “Self-organized v ariational autoencoders (self- vae) for learned image compression, ” in IEEE Int. Conf . Ima ge Pr ocess. (ICIP) , 2021, pp. 3732–3736. [21] O. K eles ¸ , A. M. T ekalp, J. Malik, and S. Kıranyaz, “Self- organized residual blocks for image super-resolution, ” in IEEE Int. Conf Image Pr ocess. (ICIP) , 2021, pp. 589–593. [22] O. C. De vecioglu, J. Malik, T . Ince, S. Kiran yaz, E. Atalay , and M. Gabbouj, “Real-time glaucoma detection from digi- tal fundus images using self-onns, ” IEEE Access , vol. 9, pp. 140031–140041, 2021. [23] G. Huang, Z. Liu, L. V an Der Maaten, and K. Q. W einberger , “Densely connected con volutional networks, ” in IEEE Conf. Comput. V ision P attern Recognit. (CVPR) , 2017, pp. 2261– 2269. [24] C. Szegedy, V . V anhoucke, S. Ioffe, J. Shlens, and Z. W ojna, “Rethinking the inception architecture for computer vision, ” in IEEE Conf. Comput. V ision P attern Recognit. (CVPR) , 2016, pp. 2818–2826. [25] Z. Zhou, M. M. R. Siddiquee, N. T ajbakhsh, and J. Liang, “Unet++: A nested u-net architecture for medical image seg- mentation, ” in Deep Learning in Medical Image Analysis and Multimodal Learning for Clinical Decision Support , pp. 3–11. Springer , 2018. [26] F . Y u, D. W ang, E. Shelhamer , and T . Darrell, “Deep layer aggregation, ” in IEEE Conf. Comput. V ision P attern Recognit. (CVPR) , 2018, pp. 2403–2412. [27] X. W ang, Y . Peng, L. Lu, Z. Lu, M. Bagheri, and R. M. Sum- mers, “Chestx-ray8: Hospital-scale chest x-ray database and benchmarks on weakly-supervised classification and localiza- tion of common thorax diseases, ” in IEEE Conf. Comput. V i- sion P attern Recognit. (CVPR) , 2017, pp. 2097–2106. [28] M. I. V ay ´ a, J. M. Saborit, J. A. Montell, A. Pertusa, A. Bustos, M. Cazorla, J. Galant, X. Barber, D. Orozco- Beltr ´ an, F . Garc ´ ıa-Garc ´ ıa, M. Caparr ´ os, G. Gonz ´ alez, and J. M. Salinas, “Bimcv covid-19+: a large an- notated dataset of rx and ct images from covid-19 pa- tients, ” 2020, https://bimcv .cipf.es/bimcv-projects/bimcv- covid19/#1590858128006-9e640421-6711. [Accessed on 13- February-2022]. [29] O. Ronneberger , P . Fischer , and T . Brox, “U-net: Conv olu- tional networks for biomedical image segmentation, ” in Int. Conf. Med. Image Comput. Comput. Assist. Interv . (MICCAI) , 2015, vol. 9351, pp. 234–241.
Original Paper
Loading high-quality paper...
Comments & Academic Discussion
Loading comments...
Leave a Comment