Closing the Loop: Dynamic State Estimation and Feedback Optimization of Power Grids
This paper considers the problem of online feedback optimization to solve the AC Optimal Power Flow in real-time in power grids. This consists in continuously driving the controllable power injections and loads towards the optimal set-points in time-…
Authors: Miguel Picallo, Saverio Bolognani, Florian D"orfler
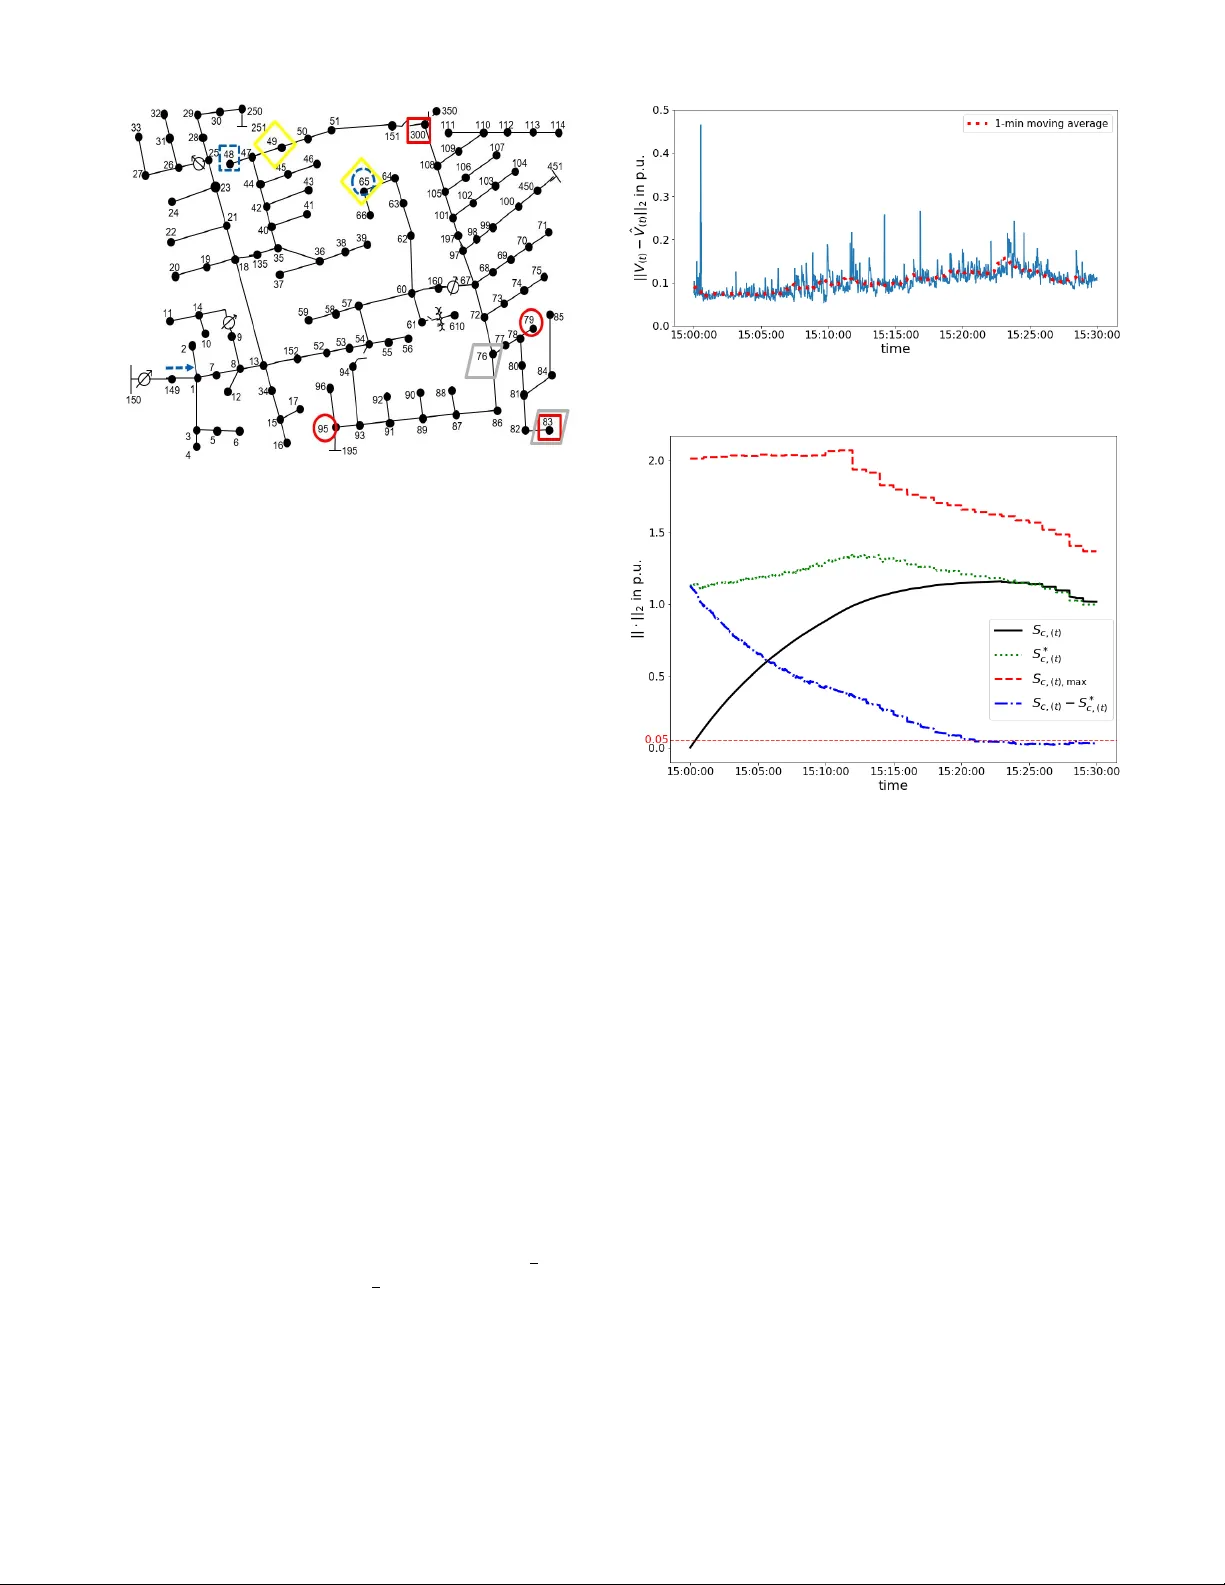
Closing the Loop: Dynamic State Estimation and Feedback Optimization of Po wer Grids Miguel Picallo, Sav erio Bolognani, Florian D ¨ orfler Automatic Control Laboratory , ETH Zurich, 8092 Zurich, Switzerland { miguelp,bsav erio,dorfler } @ethz.ch Abstract —This paper considers the problem of online feedback optimization to solve the A C Optimal Po wer Flow in real-time in power grids. This consists in continuously dri ving the contr ollable power injections and loads towards the optimal set-points in time- varying conditions based on real-time measurements perf ormed on the grid. Howev er , instead of assuming noise-free full state measurement like in recently proposed feedback optimization schemes, we connect a dynamic State Estimation using av ail- able measurements, and study its dynamic interaction with the optimization scheme. W e certify stability of this interconnection and the conver gence in expectation of the state estimate and the control inputs to wards the true state v alues and optimal set-points respecti vely . Additionally , we bound the resulting stochastic err or . Finally , we sho w the effectiveness of the appr oach on a test case using high r esolution consumption data. Index T erms —Distribution grid state estimation, A C optimal power flo w , online feedback optimization, voltage r egulation I . I N T RO D U C T I O N The operation of power grids, and especially distribution grids, is undergoing a paradigm shift due to the increasing share of controllable elements (generation power , curtail- ment, reactiv e power in con verters, flexible loads, etc.), and pervasi ve sensing (smart meters, phasor measurement units, etc.). Moreov er, the introduction of communication networks with high resolution sensor sampling, and the fast response offered by the power -electronics interfacing the controllable energy sources, enable to perform very fast control-loop rates. These new technologies offer the potential advantage of lowering the grid operation cost, promoting more sustainable energy systems, improving reliability and enabling a more efficient use of the existing infrastructure. Nonetheless, the unpredictability and the high v ariability of household loads and renewable energy sources, pose a se vere challenge in satisfying the required grid specifications, like v oltage lev els, thermal limits, etc. Consequently , these specifications need to be enforced through either of fline optimization or real-time feedback control. State-of-the-art optimization methods typically solve a static Optimal Po wer Flo w (OPF) to determine the set-points of these controllable energy sources [1]. Ho we ver , these approaches Funding by the Swiss Federal Office of Ener gy through the projects ”Re- new able Management and Real-Time Control Platform (ReMaP)” (SI/501810- 01) and ”A Unified Control Frame work for Real-T ime Power System Oper- ation (UNICORN)” (SI/501708) and by the ETH Foundation is gratefully acknowledged. may not succeed in ef ficiently controlling the system under f ast time-varying conditions, since they do not take full adv antage of these fast sensor sampling and control-loop rates. Addi- tionally , they rely on accurate grid models and measurements which are seldom av ailable. On the other hand, the recently proposed online feedback optimization [2]–[6] has shown an outstanding performance for real-time power system operation under v ariable conditions and safety requirements. This online feedback optimization consist of collecting real-time grid state measurements at each time step, and then use them as feedback to a controller that incrementally dri ves the controllable power injections to wards the optimal set-points. It has been been shown, that this feedback optimization offers the advantages of quickly adapting to time-varying conditions [3] and an improv ed robustness ag ainst model-mismatch [6]. Howe ver , so far the analysis of all of these feedback optimization approaches ha ve considered a stylized problem setup by assuming av ailability of noise-free measurements of all states that need to be controlled, potentially the entire system state. Y et, state measurements may be scarce or present disturbance noises. Such is the case in distrib ution grids, which typically present heterogeneous measurements and are not ob- servable, and thus require inaccurate a-priori information in the form of load predictions, also known as pseudomeasurements, to achiev e observability [7], [8]. Such a setup calls for a State Estimation (SE) [9], which in fact has been considered for the standard offline OPF problem [10], but not yet for the online feedback optimization. There is one main obstacle on the way: ev en if the SE and the feedback optimization are both separately stable and optimal, this does not guarantee that their interconnection will inherit these properties. Therefore, in this paper , we combine a dynamic SE [11], based on a Kalman filter , and the online feedback optimization. The contribution of this work lies in formally proving that the interconnection of the grid dynamics, the SE, and the feedback optimization is stable and steady-state optimal. More concretely , we certify that in the presence of process and measurement noise, the state estimate and the power set- points delivered by our method con verge in e xpectation to the true state and the optimal set-points, respectively , and both ha ve a bounded error co v ariance. Additionally , we sho w the effecti veness of our approach in the IEEE 123-bus test feeder [12] with highly uncertain pseudo-measurements and high resolution consumption data. The rest of the paper is structured as follows: Section II introduces some preliminaries: the distribution grid model, the problem setup and its linearization, the online feedback optimization, and the measurements. Section III presents the proposed method combining SE and feedback optimization, and proves its stability and conv ergence. Finally , in Section IV the approach is validated on a simulated test feeder . The proof of the main result is in Appendix A. I I . P R E L I M I NA R I E S A. Distribution Grid Model A distribution grid can be modelled as a graph G = ( V , E , W ) with nodes V = { 1 , ..., N bus } representing the buses, edges E = { ( v i , v j ) | v i , v j ∈ V } representing the branches, and edge weights W = { w i,j | ( v i , v j ) ∈ E , w i,j ∈ C } representing the admittance of a branch. In 3-phase networks buses may ha ve up to 3 phases, so that the voltage at bus i , with n φ,i ≤ 3 phases, is U bus ,i ∈ C n φ,i (and the edge weights w i,j ∈ C n φ,i × n φ,j ). The state of the network is then represented by the vector bus voltages U bus = [ U T pcc , U T ] T ∈ C N +3 , where U pcc ∈ C 3 denotes the measured voltage at the point of common coupling (PCC) connected to the main grid, and U ∈ C N are the voltages in the non- source buses, where N depends on the number of buses and phases per bus. The Laplacian matrix Y ∈ C ( N +3) × ( N +3) of the weighted graph G , also called admittance matrix, can be used to express the po wer flow equations that relate the currents I ∈ C N and the activ e and reactive po wer injections P , Q ∈ R N at each node: I pcc I = Y U pcc U = Y 00 Y 01 Y T 01 Y 11 U pcc U P + j Q = diag ( U ) ¯ I = diag ( U )( ¯ Y T 01 ¯ U pcc + ¯ Y 11 ¯ U ) , (1) where j is the imaginary unit, ¯ ( · ) denotes the complex conju- gate, and diag ( · ) represents the diagonal operator , con verting a vector into a diagonal matrix. Moreov er , within the set of nodes V we distinguish the set of nodes with controllable power injections C , and uncontrollable loads L ; and define the v ectors S c , S l with the corresponding power v alues. Thus, we can split P , Q as follows: P Q = I c S c + I l S l , S c = P c Q c ∈ R 2 N c , S l = P l Q l ∈ R 2 N l , where I c , I l are matrices filled with 0 , 1 that link the elements of S c , S l in the sets C , L to the corresponding nodes indices of [ P T , Q T ] T , and N c , N l are the number of elements in C , L . B. Problem Setup The operation of these distribution grids consists in optimiz- ing the use of the controllable resources S c , while satisfying some restrictions on the grid state U , which can be represented using polar coordinates as: V = [ | U | T , ∠ U T ] T ∈ R 2 N . Then this optimization problem can be expressed as a particular case of the A C Optimal Power Flo w (A C-OPF): min S c ∈F ,V f ( S c ) + g ( V ) s.t. (1) , (2) where F : The feasible set F contains the limits of av ailable power , for example F = { S c | P i, min ≤ P c,i ≤ P i, max , Q i, min ≤ Q c,i ≤ Q i, max , ∀ i = 1 , . . . , N c } . These are hard constraints to be satisfied all the time. f ( S c ) : The objectiv e function f ( S c ) = P N c i =1 f i ( S c,i ) deter- mines the cost of the grid operations by adding the costs f i of using each controllable power i . g ( V ) : The objectiv e function g ( V ) encodes the grid restric- tions through the specification of desired states and ob- jectiv es. These can include power losses, voltage con- straints, overload of lines and transformers, etc. Similar to [5], we will use g ( V ) = ρ 2 P N i =1 (max(0 , | U | i − V max )) 2 + (max(0 , V min − | U | i )) 2 to penalize violations of the voltage limits. These are soft constraints that can be violated at a giv en cost, especially during transients. Howe ver , we can enforce fewer and lower violations if using large values for ρ . Alternativ ely , these restrictions could be enforced as hard constraints [3]. For that, we would consider the dual variables in the corresponding Lagrangian, and optimize ov er them alongside the primal variables. C. P ower Flow Linear Appr oximation The non-linearity of the power flow equations (1) is dif ficult to handle when solving the optimization problem (2). For multi-phase unbalanced distrib ution grids, these equations (1) are generally noncon ve x [13]. Hence, linear approximations are used frequently in the literature [3], [14], [15]. Considering the flat voltage (zero injection profile) U 0 = Y − 1 11 Y T 01 U pcc ( V 0 = [ | U 0 | T , ∠ U 0 T ] T ) as operating point, and defining Z V = Y − 1 11 diag ( ¯ U 0 ) − 1 , we hav e the linearisation V = V 0 + B c S c + B l S l B c = B I c , B l = B I l B = " cos( ∠ U 0 ) sin( ∠ U 0 ) − sin( ∠ U 0 ) | U 0 | cos( ∠ U 0 ) | U 0 | # <{ Z V } ={ Z V } ={ Z V } −<{ Z V } , (3) where <{·} , ={·} denote the real and imaginary part of a complex number . Instead of (2), we consider then its linear approximation: min S c ∈F ,V f ( S c ) + g ( V ) s.t. (3) . (4) D. Online F eedback Optimization The static optimization problem (2) is, in essence, a feed- forwar d controller that computes the optimum set-points giv en the estimated conditions and grid model. Howe ver , these set- points become suboptimal or outdated gi ven fast time-v arying conditions, model-mismatches and estimation errors [16]. T o mitigate these effects, the online feedback optimization consist of using the current grid state V as feedback to a controller that driv es the controllable power to wards the optimal set-points in real-time. T ypically , these controllers use a variation of projected gradient descent [5], [6]. The gradient brings the set-points closer to the optimal ones, while the projection forces the solution to remain within the feasible set F . At every time-step from ( t ) to ( t + 1) we update S c, ( t +1) = Π F S c, ( t ) − ∇ S c f ( S c ( t ) ) + B T c ∇ V g ( V ( t ) ) , (5) where is the descent rate of the gradient method, ∇ S c f ( S c ) and ∇ V g ( V ) are the gradients of f and g respectiv ely , and Π F [ · ] denotes the projection on the feasible set F ( Π F [ x ] = arg min z ∈F k z − x k 2 ). This e xpression is derived by computing the gradient of the objective function f ( S c ) + g ( V ) with respect to the decision v ariables S c : ∇ S c ( f ( S c ) + g ( V )) = ∇ S c f ( S c ) + ∂ V ∂ S c T ∇ V g ( V ) , where ∂ V ∂ S c = B c . Remark 1: Note that in (5) we are assuming that the feasible set F from (2) and (4) remains constant and independent of time. In a real-world application, it would be time-varying, since the amount of power av ailable may change over time, for example if deliv ered by renewable sources. Ho we ver , when considering fast time scales, the change of F at subsequent instants tends to 0 and can be ne glected. W e will observe this later in the test case in Section IV. In any case, this work could be extended to a time-v arying feasible set F ( t ) as in [4]. Apart from the control inputs S c , which are measurable, the state-of-the-art online feedback optimization approaches (5) assume a noise-free deterministic knowledge of the full state V to ev aluate ∇ V g ( V ( t ) ) [4], [5]. Other approaches do not require full state measurements, but restrict g to control only the subset of directly measured states [2], [3], [6]. E. Measurements Since (5) requires V , and similarly the optimization prob- lems (2),(4) need S l , neither can be solved without knowing V or S l . Therefore, we need to collect measurements. In distribution grids, there may be a set of heterogeneous noisy measurements, like voltage, current and power magnitudes and/or phasors. Howe ver , due to the scarce number of mea- surements, they may need to be complemented with the so- called pseudo-measurements [7], [8], i.e., low accuracy load forecasts, to make the system numerically observable [17], and thus be able to solve a SE problem. For simplicity , in this paper we will assume that we ha ve a linearised measurement equation that contains the measurements coming from all sources (e.g. con ventional remote terminal units, smart meters, phasor measurement units, pseudomeasurements, etc.): y = H V + ω y , (6) where y is the vector of measurements, H is the matrix map- ping the state to the measurements, and ω y is the measurement noise. W e assume that this noise is Gaussian with known probability distribution ω y ∼ N (0 , Σ y ) , and that using the pseudo-measurements, the matrix H has full-column rank, and thus the system is numerically observable [17]. Since these pseudo-measurements can be simply load pro- files for different kinds of nominal consumption (household, office building, etc.), and thus hav e a low accuracy , we will assign relati vely lar ge values to the corresponding cov ariance terms in Σ y , indicating a large uncertainty [8]. I I I . S TA T E E S T I M AT I O N F O R F E E D B AC K O P T I M I Z A T I O N Instead of the standard online feedback optimization (5), in our approach we consider a more general and realistic scenario, where the whole state V needs to be controlled, but neither the loads S l nor the full state V are directly measured. T o retrieve this information, we use the av ailable measurements y from (6) to build a dynamic SE. Then, we connect this SE as feedback to the controller of the online feedback optimization. A. Dynamic State Estimation Even though we are optimizing the steady-state power flow solution represented in (1) and (3), we consider the stochastic dynamic system induced on the grid state V by a change in the controllable injected power S c and the uncontrollable stochastic loads S l . W e build this system by subtracting the power flo w equations (3) at subsequent times ( t ) : V ( t ) = V ( t − 1) + B c ( S c, ( t ) − S c, ( t − 1) ) + ω l, ( t ) , (7) where ω l, ( t ) = B l ( S l, ( t ) − S l, ( t − 1) ) appears as a result of the time-varying load conditions S l, ( t ) . This dynamic approach (7) allows to circumvent the lack of precise knowledge of S l, ( t ) by considering only its time variations as process noise: ω l, ( t ) ∼ N (0 , Σ l ) . Using (7), we design a Kalman filter based SE [18], that at time ( t ) tak es the measurements y ( t ) as input and outputs the estimate ˆ V ( t ) : ˆ V ( t ) = ( I d − K ( t ) H ) ˆ V ( t − 1) + B c ( S c, ( t ) − S c, ( t − 1) ) + K ( t ) y ( t ) P ( t ) = ( I d − K ( t ) H )( P ( t − 1) + Σ l ) K ( t ) = ( P ( t − 1) + Σ l ) H T H ( P ( t − 1) + Σ l ) H T + Σ y − 1 , (8) where I d is the identity matrix, P ( t ) denotes the cov ariance matrix of the v oltage state estimate ˆ V ( t ) , and K ( t ) is the Kalman gain matrix minimizing the resulting covariance P ( t ) : K ( t ) = arg min K trace ( P ( t ) ) . Remark 2: Note that we are assuming that the noise ω l, ( t ) in (7) has 0 mean. This is not necessary true in practice, since the loads could drift in expectation depending on the hour of the day . Howe ver , similarly as in Remark 1, on the considered fast time scales, this drift tends to 0 and can be neglected. W e will observe this later in the test case in Section IV. Nev ertheless, this work could be extended to a more general case with non-zero mean and time dependent noise parameters: ω l, ( t ) ∼ N ( µ l, ( t ) , Σ l, ( t ) ) . A load prediction could be used to estimate the drift term µ l, ( t ) , and then compensate it in the optimization step. B. Conver gence of the Pr ojected Gradient Descent Instead of using the state V ( t ) as in (5), we use ˆ V ( t ) from (8) as feedback to the projected gradient descent: S c, ( t +1) = Π F S c, ( t ) − ∇ S c f ( S c, ( t ) ) + B T c ∇ V g ( ˆ V ( t ) ) . (9) The interconnection of these subsystems (8) and (9) with the stochastic dynamic system of the grid (7) and the measurement equation (6), results in the closed-loop system represented in Figure 1. Ho wever , ev en if the SE (8) con ver ges in expectation to unbiased estimate with finite variance, and the online feedback optimization (9), con ver ges asymptotically to the solution of the OPF (4); this does not guarantee that their interconnection will inherit these properties. Therefore, we grid system: (7) measurement: (6) V y dynamic SE: (8) ˆ V optimization: (9) S c ω l ω y online feedback optimization physical system Fig. 1: Block diagram of the interconnected systems: distribution grid system (7), measurements (6), state estimation (8) and online feedback optimization (9). need to verify the overall stability , and provide the correspond- ing con vergence rates, to ensure the desired behaviour of our approach. Assumption 1: T o prove this stability and con ver gence, we need the following technical assumptions: 1) Both functions f ( · ) , g ( · ) ha ve Lipschitz continuous gradients with parameters L f , L g respectiv ely (i.e. k∇ S c f ( S c, 1 ) − ∇ S c f ( S c, 2 ) k 2 ≤ L f k S c, 1 − S c, 2 k 2 , k∇ V g ( V 1 ) − ∇ V g ( V 2 ) k 2 ≤ L g k V 1 − V 2 ) k 2 ). 2) The function g ( · ) is con ve x. 3) The function f ( · ) is η -strongly-con vex (i.e. ( ∇ S c f ( S c, 1 ) − ∇ S c f ( S c, 2 )) T ( S c, 1 − S c, 2 ) ≥ η k S c, 1 − S c, 2 k 2 2 ). 4) The measurements matrix H has full-column rank. 5) The noise covariance matrices Σ y , Σ l are bounded. 6) The noise covariance matrix Σ y has full rank. 7) The cov ariance matrices P ( t ) are lo wer bounded (i.e., there exists a parameter ˇ σ > 0 so that P ( t ) ˇ σI d ∀ ( t ) ). These assumptions are standard and relati vely easy to sat- isfy: The Lipschitz continuity assumption is typically true for most functions used in these kind of applications. The con vexity of g ( · ) will usually hold if using penalization functions like the one described after (2). Note that strict con vexity is not required for g ( · ) . If necessary , the strong con vexity of f ( · ) could always be satisfied by adding some quadratic regularization term to the objecti ve function, like in [3]. This is a standard procedure to achie ve well-posed problems. The full-column rank of H is easy to achiev e if including pseudo-measurements, see Section II-E. Since in power grids physical quantities are typically bounded, so will be the noise cov ariance matrices Σ y , Σ l . A full rank cov ariance matrix Σ y is to be expected, since measurement noises originate in different sensors. A sufficient condition to have a lower bounded P ( t ) is a full rank Σ l , and thus a uniformly completely controllable system [19, Lemma 7.2], but this is not necessarily true. Even after using a Kron reduction to eliminate zero-injection nodes, there may be nodes with controllable deterministic power injection, but no stochastic input. Then B l is not full-ro w rank, and thus Σ l is not full rank, since ω l, ( t ) = B l ( S l, ( t ) − S l, ( t − 1) ) . Howe ver , it would be possible to add some stochastic uncertainty in this nodes, like fictitious low loads or power injection noises, so that [ B c , B l ] becomes a full-ro w rank matrix, and Σ l full rank. Giv en the con ve xity of f ( · ) , g ( · ) , we can then define the instantaneous global optimal value of (4) at time ( t ) : S ∗ c, ( t ) , depending on the stochastic realization of S l, ( t ) at time ( t ) ; and S E ∗ c the e xpected global optimal v alue using the expected loads E S l, ( t ) in (4). Since E ω l, ( t ) = 0 , E S l, ( t ) is constant in time ( t ) and so is S E ∗ c . Theor em 1: Under Assumption 1 and choosing for the projected gradient descent (9) a descent rate < 2 η ( L f + k B c k 2 2 L g ) 2 + k B c k 2 2 L 2 g , the system in Figure 1 has the fol- lowing stability and con vergence results: • Exponential conv ergence tow ards the unbiased and optimal solution: there exist constants C V , 1 , C V , 2 , C S, 1 , C V , 2 > 0 such that k E ˆ V ( t ) − V ( t ) k 2 2 ≤ C V , 1 e − C V , 2 t k E ˆ V (0) − V (0) k 2 2 t →∞ → 0 k S c, ( t ) − S E ∗ c k 2 ≤ tC S, 1 e − C S, 2 t k S c, (0) − S E ∗ c, (0) k 2 t →∞ → 0 (10) • Exponential bounded mean square (stochastic stability): there exist constants C V , C V , 3 , C V , 4 , C S , C S, 3 , C V , 4 > 0 such that E k ˆ V ( t ) − V ( t ) k 2 2 ≤ C V + C V , 3 e − C V , 4 t E k ˆ V (0) − V (0) k 2 2 t →∞ → C V < ∞ E k S c, ( t ) − S ∗ c, ( t ) k 2 ≤ C S + tC S, 3 e − C S, 4 t E k S c, (0) − S ∗ c, (0) k 2 t →∞ → C S < ∞ (11) Both error terms ˆ V ( t ) − V ( t ) and S c, ( t ) − S ∗ c, ( t ) are stochastic processes that quantify the estimation and the optimality errors respectiv ely . The first result (10) establishes that the expected values of these errors conv erge tow ards 0 , while the second result (11) bounds their cov ariances. Both are required to conclude that the closed-loop stochastic dynamic system in Figure 1 conv er ges and is stable. Moreover , giv en (3), V ( t ) − V ∗ ( t ) = B c ( S c, ( t ) − S ∗ c, ( t ) ) , so the con ver gence of V ( t ) is a result of the con ver gence of S c, ( t ) . Note that the con vergence of ˆ V ( t ) − V ( t ) is faster than the one of S c, ( t ) − S ∗ c, ( t ) due to the t multiplying the exponential in the later case. These constants C V , C S , C V , ( · ) , C S, ( · ) depend on the pa- rameters η, L f , L g , B c , B l , H , ˇ σ , Σ l , Σ y . Their expressions can be found in the proof in Appendix A. Moreover , C V , C S are monotone increasing with respect to trace (Σ l ) , trace (Σ y ) . So they could be lowered if using faster time scales, since the loads would be expected to change less and thus trace (Σ l ) would be lo wer . I V . T E S T C A S E W e v alidate our proposed method by simulating the be- haviour of a test distribution grid during 30 minutes with 1 - second time intervals (1800 iterations). A. Settings Simulation data settings: Fig. 2: IEEE 123-bus test feeder [12]. Measurements: red cir- cle = voltage phasor , red square = voltage magnitude, blue dashed circle = current phasor , blue dashed square = current magnitude, blue dashed arrow = line current phasor . Distributed generation: yellow diamond = solar , grey parallelogram = wind. • System: 3-phase, unbalanced IEEE 123-bus test feeder [12] (see Fig. 2). • Load Profiles: 1 -second resolution data of the ECO data set [20]. T o adapt the active and reactive loads to this grid, we aggregate households and rescale them to the base loads of the 123-bus feeder . • Measurements for the SE (see Figure 2): V oltage mea- surements are placed at b uses 95 , 79 , 300 and 83 , current measurements at buses 65 and 48 , and branch current phasor measurements at branch 149 - 1 after the regulator . As in [8], we assign a relati vely lo w value (1% standard deviation) to the cov ariance terms in Σ y corresponding to these measurements. • Pseudo-measurements: W e build these profiles by a verag- ing the load profiles in the ECO data set [20]. As in [8], we assign a relati vely high v alue (50% standard de viation) to the corresponding cov ariance terms in Σ y . • Distributed Generation: Similar to [10], solar energy is introduced in the three phases of nodes 49 and 65 , and wind energy in nodes 76 and 83 , see Figure 2. Their profiles are simulated using a 1 -minute solar irradiation profile and a 2 -minute wind speed profiles from [21], [22]. Generation is assumed constant between samples. Optimization settings: • Objective function f ( S c ) : W e consider a quadratic cost on the controllable resources that penalises not using all the av ailable active po wer in the renew able resources, and also using any reactive power: f i (( P , Q ) c,i ) = 1 2 ( P c,i − P i, max ) T ( P c,i − P i, max ) + 1 2 Q T c,i Q c,i . This function is strongly conv ex and has a Lipschitz continuous gradient, with parameters η = L f = 1 . • Objective function g ( V ) : As mentioned after (2), we use a g ( V ) penalizing voltage violations, with parameter ρ = 100 . This function is con vex and its gradient is Lipschitz continuous with parameter L g = 100 . W e use the voltage Fig. 3: Euclidean norm at each time instant ( t ) of the error between the estimated state ˆ V ( t ) and the true state V ( t ) . Fig. 4: Euclidean norm at each time instant ( t ) of the proposed set-points S c, ( t ) , the optimum S ∗ c, ( t ) , the maximum po wer av ailable S c, ( t ) , max according to the power profiles represented in the feasible set F , and the optimality error S c, ( t ) − S ∗ c, ( t ) . A line marks how the error stabilizes around 0 . 05 p.u.. limits V max = 1 . 06 p.u. and V min = 0 . 94 p.u. as in [5]. • Feasible space F : As mentioned after (2), we consider a feasible space limiting both the acti ve and reactiv e po wer according to the profiles of distributed generation. This could easily be extended to more complex feasible space using the projection proposed in [3]. • Descent rate: Experimentally , we hav e found that with a descent rate = 0 . 001 the proposed method is stable. B. Results Giv en the theoretical result presented in Theorem 1, we monitor the optimization error norm k S c, ( t ) − S ∗ c, ( t ) k 2 , and the estimation error norm k ˆ V ( t ) − V ∗ ( t ) k 2 . In Figure 3 and 4 we can observe how both the estimation error and the optimization errors decrease to a low v alue, less than 1% for the estimation case, and then remain stable. These observ ations coincide with the results (11) in Theorem 1, since the expected value of the norm is bounded, but does not necessarily con verge to 0 . Despite that, it con verges to close to 0 . This is a consequence of using fast time scales and thus a lo w co v ariance Σ l , which in turn produces low constant bounds C V , C S . Fig. 5: Magnitude at each time instant ( t ) of the true v oltage value V ( t ) for every node during the simulation time. The estimation error con ver ges very quickly in a few seconds (iterations), while the optimization error needs about 20 min (1200 iterations). This supports the con ver gence rates of Theorem 1: the optimization error is slo wer due to the term t multiplying the exponential part of the bound for the set-points case in (10) and (11). From the curve of k S ∗ c, ( t ) k 2 in Figure 4, it can be in- ferred that the optimum solution S ∗ c, ( t ) is indeed time-v arying. Nonetheless, it is remarkable that we observe an accurate con vergence as predicted by Theorem 1, despite the fact that our theoretical assumption of zero mean process noise ω l, ( t ) in (7) is not necessarily met for the true consumption data [20] used in this simulation. This supports the statement in Remark 2 that for fast time-scales this drift can be neglected. The feasible set F that we have used is not constant due to the time-v arying profiles in solar radiation and wind speed [21], [22], see k S c, ( t ) , max k 2 in Figure 4. Howe ver , this has not affected the conv er gence of our method, because the changes in F are also negligible at these fast time-scales, as mentioned in Remark 1. Moreov er , we obtain this accurate conv ergence despite the potential error due to the linear approximation done in (3) and (6). This is a consequence of using the real-time feedback optimization, since its robustness helps to correct potential model mismatches [16]. Finally , it can be observed in Figure 5 that the voltage magnitudes remain all the time within limits almost for ev ery node. There are lo w violations taking place at different nodes depending on the time step. These violations may be due to the estimation uncertainty represented in the cov ariance matrix P ( t ) in (8), and the fact that we are not enforcing hard state constraints in (4), but only penalising their violations. V . C O N C L U S I O N S In this paper we ha ve proposed how to add a State Estima- tion (SE) to the online feedback optimization of the Optimal Power Flo w (OPF), in order to control unmeasured states. W e hav e formally prov en that the interconnected system of SE and feedback optimization is stochastically stable and con ver ges to the true state and optimal solution, respecti vely . Moreov er , we have observed in a simulated test case ho w our method succeeds in driving the controllable elements towards near- optimal set-points while keeping an accurate state estimate. Future work could include considering a nonlinear power flo w and measurements equation; biased pseudo- measurements and process noise, to have non-zero mean time- varying loads; or using the uncertainty represented in the estimation error cov ariance matrix to increase the voltage restrictions and achiev e fewer and smaller voltage violations. R E F E R E N C E S [1] D. K. Molzahn, F . D ¨ orfler, H. Sandberg, S. H. Low, S. Chakrabarti, R. Baldick, and J. Lav aei, “ A surve y of distributed optimization and control algorithms for electric power systems, ” IEEE T rans. Smart Grid , vol. 8, no. 6, pp. 2941–2962, Nov . 2017. [2] S. Bolognani, R. Carli, G. Cavraro, and S. Zampieri, “Distributed reactiv e po wer feedback control for voltage regulation and loss mini- mization, ” IEEE Tr ans. Autom. Contr ol , vol. 60, no. 4, pp. 966–981, Apr . 2015. [3] E. Dall’Anese and A. Simonetto, “Optimal po wer flow pursuit, ” IEEE T rans. Smart Grid , vol. 9, no. 2, pp. 942–952, Mar . 2018. [4] Y . T ang, K. Dvijotham, and S. Low, “Real-time optimal power flo w , ” IEEE T rans. Smart Grid , vol. 8, no. 6, pp. 2963–2973, Nov . 2017. [5] A. Hauswirth, A. Zanardi, S. Bolognani, F . D ¨ orfler , and G. Hug, “Online optimization in closed loop on the power flow manifold, ” in 2017 IEEE Manchester P owerT ech , Jun. 2017, pp. 1–6. [6] M. Colombino, J. W . Simpson-Porco, and A. Bernstein, “T owards robustness guarantees for feedback-based optimization, ” in 58th IEEE Conf. Decision and Control , Dec. 2019. [7] L. Schenato, G. Barchi, D. Macii, R. Arghandeh, K. Poolla, and A. V . Meier , “Bayesian linear state estimation using smart meters and pmus measurements in distribution grids, ” in IEEE SmartGridComm , Nov . 2014, pp. 572–577. [8] M. Picallo, A. Anta, A. Panosyan, and B. De Schutter, “ A two-step distribution system state estimator with grid constraints and mixed measurements, ” in IEEE P ower Systems Computation Confer ence , Jun. 2018. [9] A. Abur and A. G. Exposito, P ower System State Estimation: Theory and Implementation . CRC Press, 2004. [10] M. Picallo, A. Anta, and B. De Schutter, “Stochastic optimal power flo w in distribution grids under uncertainty from state estimation, ” in IEEE Conf. Decision and Control , Dec. 2018. [11] J. Zhao, A. G ´ omez-Exp ´ osito, M. Netto, L. Mili, A. Abur, V . T erzija, I. Kamwa, B. Pal, A. K. Singh, J. Qi, Z. Huang, and A. P . S. Meliopoulos, “Power system dynamic state estimation: Motiv ations, definitions, methodologies, and future work, ” IEEE T ransactions on P ower Systems , vol. 34, no. 4, pp. 3188–3198, Jul. 2019. [12] W . Kersting, “Radial distribution test feeders, ” IEEE Tr ans. P ower Syst. , vol. 6, no. 3, pp. 975–985, 1991. [13] S. H. Lo w, “Conve x relaxation of optimal po wer flow—part ii: Exact- ness, ” IEEE T rans. Control Netw . Syst. , v ol. 1, no. 2, pp. 177–189, Jun. 2014. [14] S. Bolognani and S. Zampieri, “On the existence and linear approxima- tion of the po wer flow solution in po wer distrib ution netw orks, ” IEEE T rans. P ower Syst. , vol. 31, no. 1, pp. 163–172, 2016. [15] D. K. Molzahn and I. A. Hiskens, “A Surve y of Relaxations and Approximations of the Power Flow Equations, ” F oundations and Tr ends in Electric Energy Systems , v ol. 4, no. 1-2, pp. 1–221, February 2019. [16] F . D ¨ orfler, S. Bolognani, J. W . Simpson-Porco, and S. Grammatico, “Distributed control and optimization for autonomous power grids, ” in 18th Eur opean Contr ol Confer ence (ECC) , Jun. 2019, pp. 2436–2453. [17] T . Baldwin, L. Mili, M. Boisen, and R. Adapa, “Power system ob- servability with minimal phasor measurement placement, ” IEEE T rans. P ower Syst. , vol. 8, no. 2, pp. 707–715, 1993. [18] A. Monticelli, “Electric power system state estimation, ” Proc. IEEE , vol. 88, no. 2, pp. 262–282, 2000. [19] A. H. Jazwinski, “Mathematics in science and engineering, ” Stochastic pr ocesses and filtering theory , vol. 64, 1970. [20] C. Beckel, W . Kleiminger, R. Cicchetti, T . Staak e, and S. Santini, “The ECO data set and the performance of non-intrusiv e load monitoring algorithms, ” in Proc. 1st ACM Conf. on Embedded Systems for Energy- Efficient Buildings , 11 2014. [21] HelioClim-3, “HelioClim-3 Database of Solar Irradiance, ” http://www . soda- pro.com/web- services/radiation/helioclim- 3- archiv es- for- free, [Online]. Accessed: 2017-12-01. [22] MERRA-2, “The Modern-Era Retrospective analysis for Research and Applications, V ersion 2 (MERRA-2) W eb service, ” http://www .soda- pro. com/web- services/meteo- data/merra, [Online]. Accessed: 2017-12-01. [23] M. Fazlyab, A. Ribeiro, M. Morari, and V . Preciado, “ Analysis of optimization algorithms via integral quadratic constraints: Nonstrongly con ve x problems, ” SIAM J. on Optimization , vol. 28, no. 3, pp. 2654– 2689, 2018. [24] A. Simonetto and E. Dall’Anese, “Prediction-correction algorithms for time-varying constrained optimization, ” IEEE T rans. Signal Process. , vol. 65, no. 20, pp. 5481–5494, Oct. 2017. [25] Tzyh-Jong T arn and Y . Rasis, “Observ ers for nonlinear stochastic systems, ” IEEE T rans. Autom. Contr ol , vol. 21, no. 4, pp. 441–448, Aug. 1976. [26] K. J. ˚ Astr ¨ om, Introduction to stochastic control theory . Courier Corporation, 2012. [27] K. Reif, S. Gunther, E. Y az, and R. Unbehauen, “Stochastic stability of the discrete-time e xtended kalman filter , ” IEEE T rans. Autom. Control , vol. 44, no. 4, pp. 714–728, Apr . 1999. A P P E N D I X A P RO O F O F T H E O R E M 1 For the proof, we first write the whole closed-loop system in Figure 1 connecting together all the parts in (6), (7), (8), (9). Denoting the estimation error as e ( t ) = ˆ V ( t ) − V ( t ) , we define the state x ( t ) , output z ( t ) , and disturbance ω ( t ) as x ( t ) = V ( t ) e ( t ) S c, ( t ) , z ( t ) = " ˆ V ( t ) S c, ( t ) # , ω ( t ) = ω l, ( t ) ω y , ( t ) (12) Next we define the control input u ( t +1) = φ ( z ( t ) ) , depend- ing on the output z ( t ) through the nonlinear feedback φ ( · ) . This operator φ ( · ) is the generalized gradient mapping [23] adapted to the projected gradient descent in (9), and it is a mere reformulation of (9): φ ( z ) = 1 S c − Π F S c − ∇ S c f ( S c )+ B T c ∇ V g ( ˆ V ) (13) As a result, we get the nonlinear stochastic closed-loop interconnected system represented in Figure 1 and expressed as x ( t +1) = I d 0 0 0 I d − K ( t +1) H 0 0 0 I d x ( t ) + − B l 0 − I d u ( t +1) + B l 0 − ( I d − K ( t +1) H ) B l K ( t +1) 0 0 ω ( t +1) z ( t ) = I d I d 0 0 0 I d x ( t ) u ( t +1) = φ ( z ( t ) ) . (14) Considering a perfect estimation e ∗ ( t ) = 0 , and using the instantaneous and expected global optimal values defined before Theorem 1, S ∗ c, ( t ) and S E ∗ c respectiv ely , we can define the desired points x ∗ ( t ) = [( V ∗ ( t ) ) T , 0 , ( S ∗ c, ( t ) ) T ] T and x E ∗ = [( V E ∗ ) T , 0 , ( S E ∗ c ) T ] T . Due to optimality , these points are instantaneous fixed points of the projected gradient descent. Then, at these points φ ( z ∗ ( t ) ) = 0 , φ ( z E ∗ ) = 0 , and thus x E ∗ is an equilibrium point, and x ∗ ( t ) are instantaneous equilibrium points at each time ( t ) . Ne xt, we analyse the stability of these points to prov e the con vergence of (8) and (9). A. Proof of (11) W e start formulating some results: Lemma 1: The objecti ve as a function of S c : ˜ f ( S c ) = f ( S c ) + g ( V ( S c )) = f ( S c ) + g ( V 0 + B c S c + B l S l ) is η -strongly con vex and has a Lipschitz continuous gradient with parameter L = L f + k B c k 2 2 L g (see Assumption 1 for L f , L g , η ).. Pr oof: 1) Strongly conv ex: Since g ( V ) is con ve x on V , g ( V 0 + B c S c + B l S l ) is con ve x on S c . Then, since f ( S c ) is η - strongly con vex, so is ˜ f ( S c ) . 2) Lipschitz: W e ha ve ∇ S c ˜ f ( S c ) = ∇ S c f ( S c ) + B T c ∇ V g ( V 0 + B c S c + B l S l ) , then k∇ S c ˜ f ( S c, 1 ) − ∇ S c ˜ f ( S c, 2 ) k 2 ≤ L f k S c, 1 − S c, 2 k 2 + k B c k 2 L g k B c ( S c, 1 − S c, 2 ) k 2 ≤ ( L f + k B c k 2 2 L g ) k S c, 1 − S c, 2 k 2 (15) Lemma 2: There exists a Lipschitz constant L S, opt , such that the operators mapping the subsequent values S l, ( t ) , S l, ( t +1) , to the respectiv e optimal solutions S ∗ c, ( t ) , S ∗ c, ( t +1) of (4) satisfy: k S ∗ c, ( t +1) − S ∗ c, ( t ) k 2 ≤ L S, opt k B l ( S l, ( t +1) − S l, ( t ) ) k 2 = L S, opt L S, opt k ω l, ( t +1) k 2 (16) Pr oof: The proof is in Appendix A-C. This lemma goes in accordance with the statement in [24, (14)], limiting the change of optimal solutions to the size of the time step, or in our case, the change in the load inputs in this time step. Theor em 2: [25, Theorem 2] If there is a stochastic process z ( t ) , a function V ( t ) ( · ) and real numbers ˇ ν , ˆ ν , ζ > 0 and 0 < δ ≤ 1 such that ˇ ν k z ( t ) k 2 2 ≤ V ( t ) ( z ( t ) ) ≤ ˆ ν k z ( t ) k 2 2 (17a) E V ( t +1) ( z ( t +1) ) | z ( t ) ≤ ζ + (1 − δ ) V ( t ) ( z ( t ) ) (17b) then E k z ( t ) k 2 2 ≤ ˆ ν ˇ ν E k z (0) k 2 2 (1 − δ ) t + ζ ˇ ν P t − 1 i =1 (1 − δ ) i ≤ ˆ ν ˇ ν E k z (0) k 2 2 (1 − δ ) t + ζ ˇ ν δ , According to Assumption 1, H has full-column rank, and Σ y , Σ l full rank. Then the system is uniformly completely observable [19, Chapter 7]. Thus, the cov ariance matrix P ( t ) is also upper for all ( t ) [19, Lemma 7.1]. So apart from the lower bound ˇ σ in Assumption 1, there exist an upper bound ˆ σ > 0 on P ( t ) , depending on Σ l , Σ y , H , B c , B l , so that: ˇ σ I d P ( t ) ˆ σI d , ∀ t . As a result, K ( t ) is also bounded. Despite the non-linear feedback, since we have a lin- ear open-loop system (7) and estimator (8), the separation principle [26] holds and we can analyse the stability and con vergence of the estimator and controller separately . This separation can be directly observed in (14), since there is a 0 multiplying the input u ( t + 1) for the index corresponding to the estimation error e ( t ) . Then, using the L yapunov function V ( t ) ( e ( t ) ) = e T ( t ) P − 1 ( t ) e ( t ) , we can prov e the results of Theorem 1 for the estimation error e ( t ) : The first condition (17a) is satisfied using the bounds of P ( t ) , and (17b) can be proven using a similar reasoning as in [27]: e T ( t +1) P − 1 ( t +1) e ( t +1) a ) = e T ( t ) ( I d − K ( t +1) H ) T P − 1 ( t +1) ( I d − K ( t +1) H ) e ( t ) + ω T y , ( t +1) K T ( t +1) P − 1 ( t +1) K ( t +1) ω y , ( t +1) + ω T l, ( t +1) ( I d − K ( t +1) H ) T P − 1 ( t +1) ( I d − K ( t +1) H ) ω l, ( t +1) +( crossed terms on e ( t ) , ω y , ( t ) , ω l, ( t ) ) b ) = e T ( t ) ( P ( t ) + Σ l ) − 1 ( I d − K ( t +1) H ) e ( t ) + ω T y , ( t +1) K T ( t +1) P − 1 ( t +1) K ( t +1) ω y , ( t +1) + ω T l, ( t +1) ( I d − K ( t +1) H ) T P − 1 ( t +1) ( I d − K ( t +1) H ) ω l, ( t +1) +( crossed terms on e ( t ) , ω y , ( t ) , ω l, ( t ) ) c ) ≤ e T ( t ) P − 1 ( t ) e ( t ) − e T ( t ) H T ( H ( P ( t ) + Σ l ) H T + Σ y ) − 1 H e ( t ) + ω T y , ( t +1) K T ( t +1) P − 1 ( t +1) K ( t +1) ω y , ( t +1) + ω T l, ( t +1) ( I d − K ( t +1) H ) T P − 1 ( t +1) ( I d − K ( t +1) H ) ω l, ( t +1) +( crossed terms on e ( t ) , ω y , ( t ) , ω l, ( t ) ) d ) < e T ( t ) P − 1 ( t ) e ( t ) − ψ k e ( t ) k 2 2 + 1 ˇ σ ( k K ( t +1) ω y , ( t ) k 2 2 + k ( I d − K ( t +1) H ) ω l, ( t ) k 2 2 ) +( crossed terms on e ( t ) , ω y , ( t ) , ω l, ( t ) ) e ) = (1 − ψ ˇ σ ) e T ( t ) P − 1 ( t ) e ( t ) + 1 ˇ σ ( k K ( t +1) ω y , ( t ) k 2 2 + k ( I d − K ( t +1) H ) ω l, ( t ) k 2 2 ) +( crossed terms on e ( t ) , ω y , ( t ) , ω l, ( t ) ) (18) where in a ) we have expanded e ( t +1) using (14); in b ) we hav e used the expression of P ( t +1) in (8); in c ) we use the expression of K ( t +1) in (8), and that Σ l 0 , and thus P − 1 ( t ) ( P ( t ) + Σ l ) − 1 ; in d ) we use the upper bound of P − 1 ( t +1) , and that since H ( P ( t ) + Σ l ) H T 0 , Σ y 0 and H is full-column rank, then H T ( H ( P ( t ) + Σ l ) H T + Σ y ) − 1 H 0 , so there exists ψ > 0 such that d ) is true with: ψ < λ min H T ( H ( P ( t ) + Σ l ) H T + Σ y ) − 1 H (19) where λ min ( · ) denote the minimum eigen v alue; and in e ) we use the lower bound ˇ σ of P ( t ) . Note that (19) provides and upper bound on ψ , so we can choose ψ such that ψ ˇ σ < 1 . T aking the expectation E [ · ] , since E ω y , ( t ) = E ω l, ( t ) = 0 , the crossed terms vanish and we get: E e T ( t +1) P − 1 ( t +1) e ( t +1) | e ( t ) ≤ (1 − ψ ˇ σ ) e T ( t ) P − 1 ( t ) e ( t ) + τ ( trace (Σ y ) + trace (Σ l )) (20) where we hav e used E k ω ( · ) , ( t ) k 2 2 = trace (Σ ( · ) ) , and τ = 1 ˇ σ max( k K ( t +1) k 2 2 , k I d − K ( t +1) H k 2 2 ) < ∞ . Then, we can conclude that e ( t ) is exponentially bounded in mean square and provide the corresponding bound (11) using Theorem 2: E k e ( t ) k 2 2 ≤ ˆ σ ˇ σ 1 − ψ ˇ σ t E k e (0) k 2 2 + τ ψ ( trace (Σ y ) + trace (Σ l )) t →∞ → τ ψ ( trace (Σ y ) + trace (Σ l )) (21) Next we study at the con ver gence and stability of S c, ( t ) . Due to Lemma 2, we hav e k S c, ( t +1) − S ∗ c, ( t +1) k 2 ≤ k S c, ( t +1) − S ∗ c, ( t ) k 2 + k S ∗ c, ( t +1) − S ∗ c, ( t ) k 2 ≤ k S c, ( t +1) − S ∗ c, ( t ) k 2 + L S, opt k ω l, ( t +1) k 2 (22) Then we hav e k S c, ( t +1) − S ∗ c, ( t ) k 2 a ) = k Π F S c, ( t ) − ( ∇ S c f ( S c, ( t ) ) + B T c ∇ V g ( ˆ V ( t ) )) − Π F S ∗ c, ( t ) − ( ∇ S c f ( S ∗ c, ( t ) ) + B T c ∇ V g ( V ∗ ( t ) )) k 2 b ) ≤ k S c, ( t ) − ( ∇ S c f ( S c, ( t ) ) + B T c ∇ V g ( ˆ V ( t ) )) − S ∗ c, ( t ) + ( ∇ S c f ( S ∗ c, ( t ) ) + B T c ∇ V g ( V ∗ ( t ) )) k 2 c ) ≤ k S c, ( t ) − S ∗ c, ( t ) − ∇ S c f ( S c, ( t ) ) − ∇ S c f ( S ∗ c, ( t ) ) + B T c ∇ V g ( V ( t ) ) − B T c ∇ V g ( V ∗ ( t ) ) k 2 + k B T c ( ∇ V g ( ˆ V ( t ) ) − ∇ V g ( V ( t ) )) k 2 d ) ≤ p 1 − 2 η + 2 L 2 k S c, ( t ) − S ∗ c, ( t ) k 2 + k B c k 2 L g k e ( t ) k 2 (23) where in a ) we use that S ∗ c, ( t ) is a fixed point of the projected gradient descent (9) due to its optimality; in b ) we remove the projection; in c ) we add and subtract B T c ∇ V g ( V ( t ) ) , and then use the triangle inequality; in d ) , for the first norm we use the strong con ve xity and the Lipschitz continuity given by Lemma 1; and for the second norm the Lipschitz continuity of ∇ V g ( V ) . Defining r ( ) = p 1 − 2 η + 2 L 2 , we combine (22) and (23), and take expectations to get: E k S c, ( t +1) − S ∗ c, ( t +1) k 2 ≤ r ( ) E k S c, ( t ) − S ∗ c, ( t ) k 2 + k B c k 2 L g E k e ( t ) k 2 + L S, opt E k ω l, ( t ) k 2 a ) ≤ r ( ) t E k S c, (0) − S ∗ c, (0) k 2 + P t k =0 r ( ) ( t − k ) L S, opt p trace (Σ l ) + k B c k 2 L g q E k e ( k ) k 2 2 b ) ≤ r ( ) t E k S c, (0) − S ∗ c, (0) k 2 + P t k =0 r ( ) ( t − k ) L S, opt p trace (Σ l ) + k B c k 2 L g q ˆ σ ˇ σ 1 − ψ ˇ σ k E k e (0) k 2 2 + k B c k 2 L g q τ ψ ( trace (Σ y ) + trace (Σ l )) c ) ≤ r ( ) t E k S c, (0) − S ∗ c, (0) k 2 + k B c k 2 L g q ˆ σ ˇ σ E k e (0) k 2 2 t max r ( ) , √ 1 − ψ ˇ σ t + 1 1 − r ( ) L S, opt p trace (Σ l ) + k B c k 2 L g q τ ψ ( trace (Σ y ) + trace (Σ l )) t →∞ → 1 1 − r ( ) L S, opt p trace (Σ l ) + k B c k 2 L g q τ ψ ( trace (Σ y ) + trace (Σ l )) (24) where in a ) we apply the inequality in (23) ( t ) -times, and use the Jensen inequality for the concave function p ( · ) on E k ω l, ( t ) k 2 and E k e ( k ) k 2 : E k ( · ) k 2 ≤ q E k ( · ) k 2 2 ; in b ) we substitute E k e ( k ) k 2 2 using (21) and use that p ( · ) is subadditiv e: √ x + y ≤ √ x + √ y , ∀ x, y > 0 ; and in c ) and the limit, we sum over k and use the follo wing: r ( ) < 1 if choosing a step size < 2 η ( L f + k B c k 2 2 L g ) 2 + k B c k 2 2 L 2 g according to Theorem 1; as explained after (19), ψ can be chosen so that 1 − ψ ˇ σ < 1 ; r ( ) > 1 − η 2 L 2 > 0 , 1 − ψ ˇ σ > 0 ; then 0 < r ( ) t − k √ 1 − ψ ˇ σ k ≤ max r ( ) , √ 1 − ψ ˇ σ t , since t ≥ k ≥ 0 , with max r ( ) , √ 1 − ψ ˇ σ < 1 . B. Proof of (10) T aking expectations on the interconnected system (14), we can eliminate the disturbance noise ω ( t ) . Without it and using the same procedure as before for the estimation part, we get E e ( t +1) | e ( t ) T P − 1 ( t +1) E e ( t +1) | e ( t ) ≤ (1 − ψ ˇ σ ) e T ( t ) P − 1 ( t ) e ( t ) (25) so that instead of (20) we hav e k E e ( t ) k 2 2 ≤ ˆ σ ˇ σ 1 − ψ ˇ σ t k E e (0) k 2 2 t →∞ → 0 , (26) and for the optimality part we hav e k S c, ( t +1) − S E ∗ c k 2 a ) ≤ r ( ) k S c, ( t ) − S E ∗ c k 2 + k B c k 2 L g k E e ( t ) k 2 b ) ≤ r ( ) k S c, ( t ) − S E ∗ c k 2 + k B c k 2 L g q ˆ σ ˇ σ k E e (0) k 2 2 √ 1 − ψ ˇ σ t c ) ≤ r ( ) t k S c, (0) − S E ∗ c k 2 + k B c k 2 L g q ˆ σ ˇ σ k E e (0) k 2 2 t max r ( ) , √ 1 − ψ ˇ σ t t →∞ → 0 (27) where in a ) we use same arguments as in (23), b ut adding and subtracting B T c ∇ V g ( E V ( t ) ) ; in b ) we substitute k E e ( t ) k 2 2 using (26); in c ) we apply the previous inequality ( t ) -times and sum the terms as in (24) C. Proof of Lemma 2 k S ∗ c, ( t +1) − S ∗ c, ( t ) k 2 a ) = k Π F S ∗ c, ( t +1) − ∇ S c f ( S ∗ c, ( t +1) ) + B T c ∇ V g ( V ∗ ( t +1) ) − Π F S ∗ c, ( t ) − ∇ S c f ( S ∗ c, ( t ) ) + B T c ∇ V g ( V ∗ ( t ) ) k 2 b ) ≤ k S ∗ c, ( t +1) − ∇ S c f ( S ∗ c, ( t +1) ) + B T c ∇ V g ( V ∗ ( t +1) ) − S ∗ c, ( t ) + ∇ S c f ( S ∗ c, ( t ) ) + B T c ∇ V g ( V ∗ ( t ) ) k 2 c ) ≤ k S ∗ c, ( t +1) − S ∗ c, ( t ) − ∇ S c f ( S ∗ c, ( t +1) ) − ∇ S c f ( S ∗ c, ( t ) ) + B T c ∇ V g ( B c S ∗ c, ( t +1) + B l S l, ( t ) ) − B T c ∇ V g ( B c S ∗ c, ( t ) + B l S l, ( t ) ) k 2 + k B T c ( ∇ V g ( B c S ∗ c, ( t +1) + B l S l, ( t +1) ) −∇ V g ( B c S ∗ c, ( t +1) + B l S l, ( t ) )) k 2 d ) ≤ r ( ) k S ∗ c, ( t +1) − S ∗ c, ( t ) k 2 + k B c k 2 L g k B l ( S l, ( t +1) − S l, ( t ) ) k 2 e ) ≤ r ( ) k k S ∗ c, ( t +1) − S ∗ c, ( t ) k 2 + 1 − r ( ) k 1 − r ( ) k B c k 2 L g k B l ( S l, ( t +1) − S l, ( t ) ) k 2 k →∞ → 1 − r ( ) k B c k 2 L g k B l ( S l, ( t +1) − S l, ( t ) ) k 2 (28) where in a ) we use that both solutions are fix ed points of the projected gradient descent (9) due to their optimality; in b ) we remove the projection; in c ) we use (3): V ∗ ( t ) = B c S ∗ c, ( t ) + B l S l, ( t ) , we add and subtract B T c ∇ V g ( B c S ∗ c, ( t +1) + B l S l, ( t ) and use the triangle inequality; in d ) we use the strong con vexity and the gradient Lipschitz continuity as in (23) defining r ( ) = p 1 − 2 η + 2 L 2 ; in e ) we apply the previous inequality k times; and in the limit we use that r ( ) < 1 as explained after (24). Since (28) is true for all such that r ( ) < 1 , we can choose L S, opt = min { | r ( ) < 1 } 1 − r ( ) . Howe ver , note that since lim → 0 1 − r ( ) = 1 2 η , so the Lipschitz constant L S, opt is not arbitrarily small.
Original Paper
Loading high-quality paper...
Comments & Academic Discussion
Loading comments...
Leave a Comment