GPRInvNet: Deep Learning-Based Ground Penetrating Radar Data Inversion for Tunnel Lining
A DNN architecture referred to as GPRInvNet was proposed to tackle the challenges of mapping the ground-penetrating radar (GPR) B-Scan data to complex permittivity maps of subsurface structures. The GPRInvNet consisted of a trace-to-trace encoder and…
Authors: Bin Liu, Yuxiao Ren, Hanchi Liu
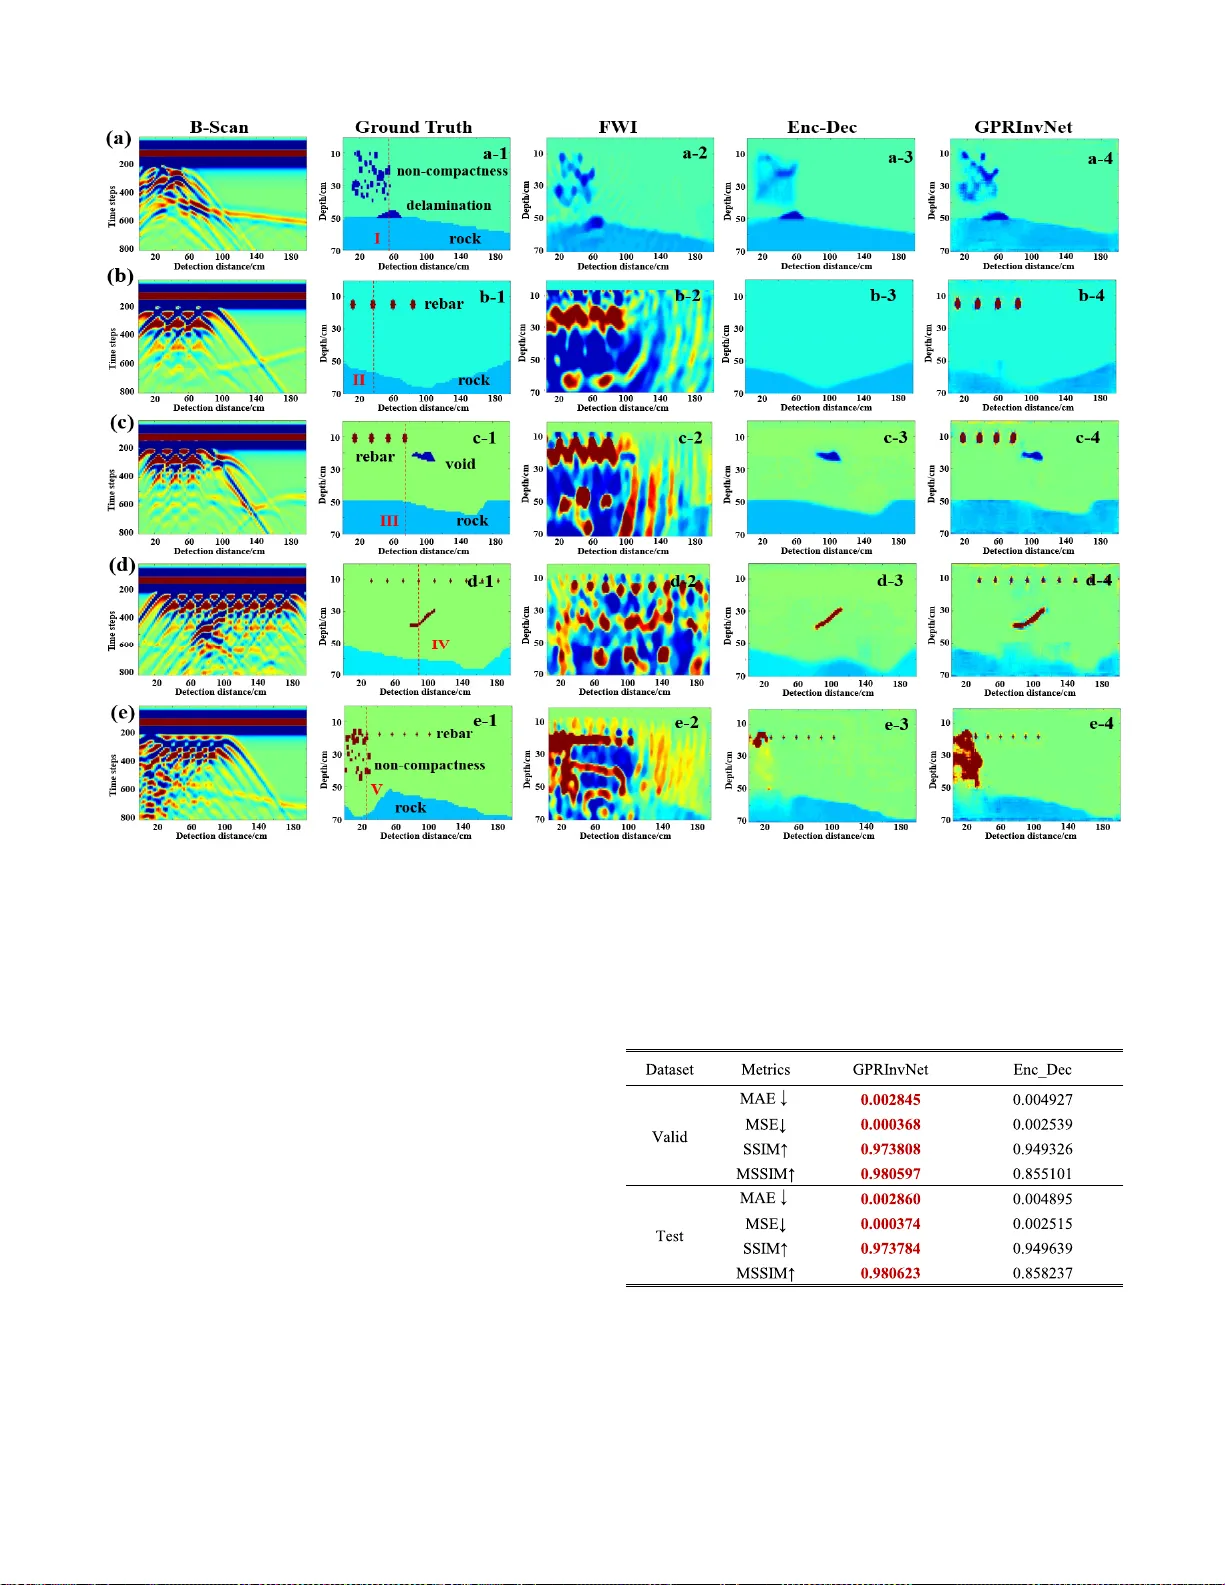
IEEE TRANSACTIONS ON GEOSCIENCE AND REMO TE SENSING, V OL. 59, NO. 10, OCTOBER 2021 8305 GPRIn vNet: Deep Learning-Based Ground- Penetrating Radar Data In version for T unnel Linings Bin Liu , Y uxi ao Ren , Hanchi Li u, Hui Xu, Zhengfang W ang , Anthony G. Cohn , and Peng Jiang , Member , I EEE Abstract — A DNN architecture referr ed to as GPRInv Net was proposed to tackle the challe nges of mapping the gr ound-penetra ting radar (GPR) B-Scan data to complex permit- tivity maps of subsurfac e structure s. The GPRIn vNet consisted of a trace-to-trace encoder an d a decoder . It was specially design ed to take into account the characteristics of GP R in version when faced with com plex GPR B-Scan data, as well as addre ssing the spatial alignment issu es between time-series B-Scan data and spatial permitti vity ma ps. It display ed the ability to fuse features fr om sev eral adjacent traces on the B-Scan data to enhance ea ch tr ace, and then further condense the featur es of each trace separately . As a r esult, the sensitiv e zones on the permittivity maps spatially aligned to the enhanced trac e could be reconstructed accurately . The GPRIn vNet has been utilized to reconstruc t the permitti vity map of tunnel linings. A dive rse range of dielectri c models of tunnel lining s conta ining complex d efects has been reconstructed using GPRInvNet. The results ha ve demonstrat ed that the GP RInvNet is capable of effecti ve ly reco nstructing co mplex tunnel lining defect s with clea r boundarie s. Compa rati ve results with existing base line methods also demonstr ated the superiority of the GPRIn vNet. Fo r the purpo se of gener alizing the GPRIn vNet to real GPR data, some background noise patches recorded from practical model testing Manuscript receiv ed Decem ber 25, 2019; re vised March 2, 2020, April 30, 2020, August 10, 2020, and October 30, 2020; accepted December 12, 2020. Date of publication January 13, 2021; date of current version September 27, 2021. This work was s upported in part by the J oint Research Fund of National Natural Science Foundation of China under G rant U1806226; in part by the Ke y Project of Na tional Natural Science F oundation of China under Grant 51739007; in part by the National Science Fund for Outstanding Y oung Scholars under Grant 51922067; and in part b y the National Natural Science Founda tion of China under Grant 61702301, and Grant 41877230. (Corresponding authors: Zhengfang W ang; P eng Jiang.) Bin L iu is with the School of Qilu Tran sportation, Shandong Uni versity , Jinan 250061, China, als o with the Geot echnical and Structural Engineering T echniques Research Center , Shandong Uni versity , J inan 250061, China, and also with the Data S cience Institute, Shandong University , Jinan 250061, China (e-mail: liubin0635@163.com) . Y uxiao Ren is with the School of Qilu Transportation, Shandong Uni v ers ity , Jinan 250061, China, and als o with the Geo technical and Structural Engineer- ing T echniques Research Center , S handong Uni versity , Jinan 250061, China (e-mail: ryxchina@gm ail.com). Hanchi Liu and Zhengfang W ang are with the School of Control Sci- ence and E ngineering, Shandong Univ ersity , Jinan 250061, China ( e-mail: 201934495@mail.sdu. edu.cn; wangzhengfangsdu@hotmail.com). Hui Xu is with the Geotechnical and S tructural E ngineering T ech- niques Research Center, Shandong University , Jinan 250061, China (e-mail: 1162259518@qq.com). Anthony G. Cohn is with the School of Computing, University of Leeds, Leeds LS2 9JT , U.K. (e-m ail: a.g.cohn@leeds. ac.uk). Peng Jiang is with the School of Qilu Transportation, Shandong Uni v ers ity , Jinan 250061, China (e-mail: sdujump@gmail. com). Digital Object Identifier 10.1109/TGRS. 2020.3046454 were integrated into the synth etic GPR d ata to retrain the GPRIn vNet. The model testing has been conducted fo r validatio n, and exp erimental results rev ealed that the GPRInvNet had also achieved satisfactory results with regard t o th e real d ata. Index T erms — Deep neural networks, ground-pene trating radar (GPR) data inv ersio n, GPR, tunnel lining detectio n. I. I NTRODUCTION G R OUND-PENETRA TING radar (GPR) has been exten- si vely used in many applications, including in the fields of glaciology , archeology , and ci vil and geotechnical engineer- ing. For example, it has been utilized in geological surveys, buri ed object detecti ons, and the detections of subsurface structures [1]–[3]. Among the aforementioned applicat ions, the nondestructi ve inspecti ons of tunnel lining structures have been popular [4], [5]. The GPR transmits an electromagnetic wa ve into the tunnel lining str ucture and receives echoes to form B-scan images, from which the structural conditions of the tunnel linings can be deduced [6], [7]. The inspecti on of the structural condition of the tunnel lining is of major importance to the safe operation of tunnels [8]. Ho weve r , due to v arious geological and en vironmental f act ors, aging, increased loading, man-made impacts, and irregular construction, tunnel linings progressi vely deteriorate, l eading to many d efects, including lining v oids, cracks, delaminati on, lining leakage, and non- compactness of concrete. These covert defects, whi ch are generally located inside the tunnel li ning, may reduce the bearing cap acity of the lining, as well as affecting the normal operations of tunnels , shorteni ng tunnel durability , o r ev en inducing safety incidents [9] , [10] . Sev eral i ncidents hav e occurred due to the deterioration of the tunnel lining structures, such as the Big Dig ceiling collapse in Boston (2006) and the Sasago T unnel collapse in T okyo (2012) [11]. The translatio n of th e electro magnetic info rmation, which is stor ed in the B-Scan in to inner defect- r elated in formatio n (such as locations, shapes, and die lectric properties), is of major importance in tunnel lining defect inspection. There are a number of existing methods for GPR in version which focus on map ping the dielectr ic distributions of the struc- tures to be detected based on the recorded GPR data [12]. These methods mainly include common-midpoint velocity analysis [13], ray-based methods [14], rev erse-time migration 1558-0644 © 2021 I EEE. Personal u se is perm itted, but republication/redistr i bution requires IE EE permiss ion. See https://www.ieee.org/publications/rights /index.htm l for more information. Authorized licensed use limited to: SHANDONG UNIVERSITY. Downloaded on September 26,2021 at 07:58:20 UTC from IEEE Xplore. Restrictions apply. 8306 IEEE TRANSACTIONS ON GEOSCIENCE AND REMOTE SE NSING, V OL. 59, NO. 10, OCTOBER 2021 (R TM) [15], tomography approaches [16], and full-wa veform in version (FWI) methods [17] , [18]. Among these methods, the FWI is consider ed to be a state-of- the-art solu tion to q ual- itati vely and quantitatively reconstruct images of subsur face structures. It directly employs the entire received w av eforms to match with the forward m odeled data. Then, it reco nstructs the dielectric distributions of th e structur es by min imizing the misfit between the two sets of data [19] , [20]. The FWI is originated in the field o f seismic exploratio n [21] and has since been rapidly employed for process ing radar data [22]. In tunnel lining-related applications , some dev elopments of FWI hav e been presented to f urther improve performance. These include a truncated Ne wton method based on GPR FWI with str uctural constrain ts [23], a multiscale in version strategy and bi-parametric FW I method [24], and a combination of improve d FW I and R TM [25]. Howe ver , due to the fact that the tunnel lining defects always have irregular geometric characteristics and complex distr ibution p atterns, the received subsurface GPR d ata are generally interlaced and accompanied by dis continuous and distorted echoes. Furthermore, some of the strong echoes induced by the st eel rebars in tunnel linings may mask the signatures of the defects. In such cases, it has b een observed that the B-scan images commonly show “pseudo-hyperbolic ” morphologies or clutte r [24] . Therefore, it has b een found to be challenging for traditional FWI to pre- cisely reconstruct the dielectric distribut ions of the targets . The locations of the lining defects may be erroneously computed, notwiths tanding the consi derable computational costs of the FWI methods. In recent years, deep neural networks (DNNs) have demon- strated extraor dinary abilities in applications related to image classi fications [26], [27], object detections [28], semantic segment ations (pixel -le vel predictions) [29] , [30], and image syntheses [31 ]. DNNs automatically learn the high -lev el f ea- tures via the training data and then ar e able to estimate nonlinear mapping between the i nput image data and the vari ous data domains, such as labels, text, or other images. Accordingly , some end-to-end deep learning-bas ed in version methods have been introduced to in vert the velocity or impedance from the seis mic data. For example, Das et al. [32] utilized a 1-D conv olutio nal neural network (CNN) to p r e- dict high-res olution i mpedance. Araya-Polo et al. [33] pro- posed GeoDNN for sei smic tomography . Alfarraj et al. [34] proposed a semisupervis ed frame work for impedance inv er- sion based on con volutional and recurrent neural networks. In r egard to velocity in versio n , Zhang et al. [35] de veloped an end-to-end framew ork referred to as V elocityGAN in order to reconstruct subs urface veloci ty directly from raw seismic wa veform d ata. W u et al. [36] designed In version- Net, which fo llows an auto -encoder ar chitecture to map seismi c d ata to a corresponding veloci ty model. In our pre vious study , we proposed the DNN-based Seis In vNet model to address weak s patial corres pondence, the uncer- tain reflection–reception relati onships between seismic data and velocity model, and the tim e-varying problems o f seis- mic data [37]. It was found that the Seis In v Net could recover the details of interfaces and accurately reconstruct velocity mode ls. Since both GPR and seis mology are wa ve-based geophys- ical techniques, these state-of-the-art methods for seismi c in versions introduce new perspectiv es for addressing GPR in version problems. Ho we ver , it may not be an optimal choice to directly utilize the existing DNNs desig ned for seismic in version in the processing of GPR data. Firs t, due to the fact that the lining defects usually have irregular geometries and inhomogeneous distrib ution patterns, the rebar or complex dielectric distrib utions in tunnel linings may mask the effecti ve GPR signals reflected by the d efects. In such cases, the GPR data of the tunnel linings are usually more comple x than the seismic data. Therefor e, the DNNs for the GPR data inv ersion should have strong ab ilities to extract effecti ve features from complex data. Second, GPR data is known to have unique spatial alig nment characteristics: unlike tho se of seismic cases, the relationship between th e reflection and reception [37] of GPR is relativ ely certain since ther e are only one transmitter and one receiver . In ad dition, sin ce the electro magnetic wav es of the GPR show a faster d ecay than those of the seismic wa ves, the majority of the useful signals induced by one defect will be captured in several adjacent GPR traces, rather than the traces far from the defect. Therefore, to accurately reconstruct the local details of the p ermittivity map using DNNs, it is more effecti ve to make full use of the information extracted from adjacent GPR traces, rather than the global context. In this way , learning from inef fecti ve information can be a voided. So far, little pr o gress has b een m ade in the field o f DNN-based GPR d ata inv ersion. Th e major ity of the existing studies have adopted DNNs to process GP R B-Scan data for the detection of buried objects [38] and rebars [39] , identificati on of subgrade d efects [40], or the reconst ruction of concealed crack profiles in pavements [41]. These methods ha ve been focused on t he tasks of classification or object detection in GPR B-Scan images, where the outputs are class labels or locations of the d efects in the B-scan images, rather than the subsurface images of the structures. In term s of mapping GPR B-Scan images to subs urface images, to the best of our knowl edge, the only study published so far w as that presented by Alvarez et al . [42], who had adopted some deep learning networks for GPR image-to-image translati on. Three wid esp read DNNs [Enc-Dec, U-Net, and generati ve adversarial network (GAN)] were employed to reconstruct subsurface images of concrete sewer pipes from GPR B-Scan images. Then the methods were vali dated using syntheti c data, and the results indicated th e feasib ility of utilizing DNNs in mapping GPR images to subsurface images of a structure. This study successfully reconstructed subsurface images containing defects with regular geometries (t riangles, circles, and rectan- gles). Howe ver , the d ielectric p roperties of the structure were not reconstructed. In order to accurately inv ert the dielectric properties of tunnel linings and reconstruct complex defects with irregular geometries, an end-to-end DNN frame work was p roposed in this s tudy . The proposed framew ork was referred to as GPRIn v Net, which consisted of a specially designed “trace-to- trace” encoding process and a decoding process. The encoder enhanced the features of each GPR t race using the information extracted from its adjacent traces. Then, the features of each Authorized licensed use limited to: SHANDONG UNIVERSITY. Downloaded on September 26,2021 at 07:58:20 UTC from IEEE Xplore. Restrictions apply. LIU et al. : GPRIn vNet: DEEP LEARNING-BAS ED GROUND PENETRA TING RADAR DA T A INVERSION 8307 trace were condensed one-by-one to generate a group of features that spatially corresponded to its o wn sensit i ve zone on the per mittivity map. By doing so , the effectiv e featur es could be e xtracted from comple x B-Scan data and the spatial alignment between the input and output was retained. The GPRIn v Net was first validated on a synthetic GPR data set. A div erse range of dielectric models containing complex defects was reconstructed using GPRIn vNet, and a comprehen- si ve comparati ve analysis was then performed. Furthermore, in order to apply the proposed model to real GPR data, some real background noise patches were inte grated into the synthetic GPR data to train the GPRIn vNet. The experimental results demonstrat ed that our method provided good results for real GPR data. The main contrib utions of this study are as follow s. 1) The GPRIn vNet framew ork was proposed to accu- rately in vert dielectric images d irectly from GPR d a ta. T o the best of our knowledge, this was the first deep learning-based network specifically designed for GPR data inversion. 2) The designed GPRIn vNet was then successfully applied to reconstruct permittivity maps of tunnel linings con- taining complex defects. This study’ s comparati ve vali- dation results demonstrated the superior performance of the proposed compared with other baseline models. 3) A method for g eneralizing GPRIn vNet to real data was also presented in this study . The experimental results of the model testing showe d that the proposed method had achiev ed satisfactory results on real data. II. R ELA TED W ORKS A. Seismic Inver sion DNNs ha ve been extensiv ely exploited in the field of seis- mology . Since GPR and seismology are both wav e-based g eo- physical techniques, they share similar p roperties from a data processing perspecti ve. Therefore, in this section, we introduce related work s in th e area of seismic in version. Different approaches based on deep learning hav e been recently pro- posed for seismic in version. Se ismic in versions ha ve been attempted using CNNs [32], recurrent neural networks [34], and GANs[35 ] . Furthermore, various DNN improvements ha ve also been presented, such as GeoDNN [33], V elocityGAN[35], and Inv ersionNet[36]. In our pre vious study , w e proposed SeisIn vNet [37] to accurately in vert the subsurf ace velocity distrib u tions from observ ational data collected from the ground surface. T o tackle the challenges encountered when mapping the time-series seismic wave sign als to spatial im ages, the SeisI n vNet uti- lized conv olutional layers to encode the observ ational setup, neighborhood information, and global context of a single-shot seismic profile into one single seismic trace, which formed an embedding vector . Then, each embedding vector , which contained a variety o f seis mic i nformation, was fused via fully connected layers to form a spatially align ed feature map o f d ifferent seismic traces. The velocity model was reconstructed from all feature maps by a C NN called t he velocity model decoder . These DNN-based methods provided new perspectives for GPR inv ersion problems. B. DNNs for the GPR Image to Subsurface Image T ransform ations So far, studies, which have employed DNNs to map GPR B-Scan images to subsurf ace images, ha ve been rare. T o the best of our kno wledge, the only published study to date has been the one conducted by Alv arez et al. [42]. In their ar ticle, three different state-of-the-art deep learning architectures were employed to reconstruct subsurface images of concrete sewer pipes from B-Scan images. The types of architecture of the three DNNs, inclu d ing encod er-decoder (Enc-Dec), U-Net, and generation agg ressiv e ne twork (GAN), were identical to the implemented architectures pre viously described in [43]. The usage of different loss metrics was also ev aluated and compared. The v alidations were conducted using synthetic data. Th e sy nthetic GPR B-Scan data and su bsurface perm ittiv- ity map were reformatted into image pairs. Specifically , each GPR B-Scan was refo rmatted to an imag e with the size of 125 × 125 pixels, which corresponded to a concrete segment with the dimens ions of 250 × 250 mm. The results of the comparati ve studies demonstrated that Enc-Dec networks using a dif ferential stru c tural sim ilar- ity (DSSIM) loss fun ction were ab le to slightly outperf orm U-Net and GAN for these types of GPR image-to-image trans- formation. The Enc-Dec netw ork implement ed in the studies consist ed of an encoder and a corresponding decoder . Each con volutional layer employs a 4 × 4 conv olution al filter , with a stride of 2 for downs ampling the input image. Subsurface images containing defects wit h regular geometries (triangles, circles, and rectangles) were found to hav e been ef fecti vely reconstructed . The results had demonstrated th e feasib ility of utilizing DNNs to map a GPR im age to a su b surface imag e. Although the permittivity maps of the subsurf ace structures had not been reconstructed in the aforementi oned studies , a b asis for further explori ng the applicati ons of deep learning in GPR in versions was still provided. III. M ETHODOLOGY A. Characteristics of D NN-Based GPR I n version T a sks The DNN-based in version method is a data-driv en nonlinear mapping problem [35] H : P → D . (1) The aim is to find the transfo rmation that reco nstructs a permitti vity map of the tunnel lining structure P i from the corresponding GPR B-Scan D i ,w h e r e i ∈[ 1 , N ] ( N is the number of B-Scan im ages). Each per m itti vity model P i has size [ H ; W ], where H represents the depth and W represents the width of the p ermittivity mod el. Each GPR B-Scan D i has dimension [ T ; R ], where T and R denote the time step and the number of traces, respecti vely . The B-Scan D i consist s of R single GPR traces (A-Scans). In this article, D i r denotes the r th single trace on the B-Scan D i ,w h e r e r ∈[ 1 , R ]. Generally , the single GPR trace D i r provides elapsed i nformation a long the depth of t he tunnel lining. The data recorded at each time step in the single trace D i r are related to the dielectr ic properties at dif ferent d epths. The different single traces D i r , r ∈ [ 1 , R ] correspond to the Authorized licensed use limited to: SHANDONG UNIVERSITY. Downloaded on September 26,2021 at 07:58:20 UTC from IEEE Xplore. Restrictions apply. 8308 IEEE TRANSACTIONS ON GEOSCIENCE AND REMOTE SE NSING, V OL. 59, NO. 10, OCTOBER 2021 Fig. 1. Schematic of GPR in version. (a) Permittivity m ap and ( b) corre- sponding GPR B-Scan. D i r and D i r are the r th trace and the s th trace on the GPR B-Scan, respectively; P i r ∗ is the r ∗ th column of permittivity v alues spatially aligned to D i r ;a n d P i s ∗ is the s ∗ th column of per mittivity values spatially aligned to D i r . dielectric properties P i r ∗ , r ∗ ∈[ 1 , W ] at different detection distances along the width direction of the permittivity map. The schematic is detailed in Fig. 1 . The challenges of DNN-based GPR in version are twofold as fo llows. 1) Due to the fact that tunnel linings may contain rebars, the dielectric distrib utions are usually inhomogeneous. Consequentl y , the GPR B-Scan data of the tunnel linings are very complex. In particular , the rebars located inside the tunnel linings may mask the effecti ve GPR echoes from any defects, which m anifests in the B-Scan as clutter , as illustrated in Fig . 2. Moreover , tunnel lining defects are known to consist ently have irregular geo- metric characteristics, and d efects with different shapes may contrib ute t o simila r B-Scan profi les under the impacts o f multip le waves and scattering . In su ch cases, it has been found to be challenging to accurately recon- struct the details of tunnel lining defects with irregular shapes, especially those located under rebars. Therefore, a network with strong feature extracting capacity was required to make full use of the input data and to learn the ef fecti ve features from t he complex B-Scan images. 2) There is no specific spa tial alignment b etween the input (GP R B-Scan) and the output (relativ e permit- tivity model) images. T his is particular ly significant in Fig. 2. T wo B-Scan and tunnel lining m odel pairs. The tunnel lining m odels A and B contain two different defects under rebars; the B-Scan images are complex; and the B-Scan images of the two m odels are quite similar . DNN-based inversion pr ocesses as the majority of the exis ting DNN methods are designed for spatia lly aligned data pairs. Generally , the position at which a hyperbolic echo exi sts on a GPR profile may not correspond to any abnormalities in the dielectric model. As can be seen in Fig. 2, the echo es induced by the multiple reflections of rebars do not align to any abnormality on the dielectric model. Howe ver, the signals indu ced b y a defect in the dielectric model can always be observed, not only in their corresponding traces but also in several adjacent GPR traces. F or example, the dielectric model at one locati on is not only related to the corresponding GPR trace b ut also to sev eral adjacent GPR traces. V ari ous end-to-end DNN framew orks designed for image synthesis can be employed to map GPR B-Scan data to permittivity images, such as Enc-Dec, U-Net, and GAN. Howe ver, the existing networks wer e all originally d esigned for image pairs that are spatiall y aligned, such as photos and medical images. These netw orks employ fixed conv olutional kernels and encode the input data into a feature vect or , from which the decoder reconstructs the output [37]. How ev er, with the increases in the dimensions of feature maps, the spatial features may be gradually lost, which may cause the details or boundaries to not be accurately reconstructed [44], [45]. For GPR data without specific spatial alignments, the exis ting DNNs may not be the optimal choice, and deep learning networks that explicitly consider the c h aracteristics of GPR data may be preferable. B. Arc hitecture of GPRIn vNet In this study , a novel DNN architecture for GPR in version referred to as GPRIn vNet was p roposed, which displayed the ability to make full use of the informatio n in the B-Scan and retain the spatial alignment between the input and output. The concept of the GPRIn vNet frame work was ins pired by the previously introduced SeisIn vNet model [37]. Howe ver , improve ments were made to the network in order to select specific accounts of the characteristi cs o f the GPR data. W ith Authorized licensed use limited to: SHANDONG UNIVERSITY. Downloaded on September 26,2021 at 07:58:20 UTC from IEEE Xplore. Restrictions apply. LIU et al. : GPRIn vNet: DEEP LEARNING-BAS ED GROUND PENETRA TING RADAR DA T A INVERSION 8309 Fig. 3. Architecture of GPRIn vNet. D i with a dimension of T × R × 1 is the input B-Scan data; F i with the dimens ion of T × R × E indicates the featur e maps after conv olutional layers; a g roup of features F i r spatially aligned to D i r contains inform ation extracted fro m the adjacent traces of D i r ; G i with the dimension of C × R × E is formed by separately condensing each column of F i using fully connected layers and G i r corresponding to the compress ed f eatures of F i r ; P i r is a part of perm ittivity map s patially aligned to G i r ; and the output of the network P i with the dim ension of H × W × 1 is the reconstructed permittivity m ap from D i . consideration given to the co mplexity o f GPR B-Scans of tu n- nel linings, the feature extraction components of the network were increased in order to extract features from the complex B-Scan data, as well as to enhance the information of each trace using the in fo rmation o f its ad jacent traces. In addition, due to the special spatial alignment characteristics b etween the GPR data and th e permittivity map, this study sep arately condensed the features of each trace, which were spatially aligned to columns of the permittivity map. Then, each column of the permitti vity map was accurately recon structed from the features of each trace. Then, the entire permittivity map could be obtained by splicing all of the slices of the p ermittivity map. Fig. 3 shows the architecture of the GPRIn vNet framew ork. The GPRIn vNet consisted of a speciall y desi gned encoder and a corresponding decoder . The decoder was topologi- cally identical to the decoder component in the SeisIn vNet model [37] . The key component of the GPRIn vNet was its encoder , which was described as a “trace-to-trace” encoder . During the encoding pro cess, multiple co n volutional layers were first employed to enrich the information of each GPR trace without compressing its spati al dimension. Then, as the number of con voluti onal layers increased as per the GPR data, the capacity of feature extrac tion had been enhanced. This allo wed the netw ork to make full use of the information from the adjacent traces and automa tically learn features from the complex B-Scan data. Moreover , since the GPR signals based on electromagnetic wa ves showed a trend of faster decay in amplitude when compared with th e se ismic waves, the u seful signals observed in adjacent traces may not be detected in more remote traces. Therefore, only the effecti ve information from the neighboring traces was fused, rather than extracting the global conte xt from the entir e B-Scan. This had effecti vely pre vented the network from learning inef fectiv e features. In this article, after the f eatur es had b een enhanced, se veral fully co nnected layer s were u tilized in the encodin g process for the purpose of separately condensing the features of each trace. Then, the enhanced features of each trace were artificially aligned to a column of th e per mittivity map. In th is stu dy , the ter m “sensiti ve zon e” ref ers to the column of the p ermit- tivity map which spatially align s to the enhan ced f eatures of each trace. This operation allowed the network to accurately reconstruct the details of its sensiti ve zone. During the deco ding process, the high -quality sensitive zones of each trace were reconstructed. Then, all the in verted sensitiv e zones were spliced together to form a permittivity map. The GPRIn vNet was able to make the best use of the GPR data and had accurately reconstructed the shapes and details of the defects. The high-q u ality dielectric maps were directly generated from the raw GPR data. Moreover , as we encoded the features trace by trace, the permittivity maps could b e r econstructed colum n by column . Fig. 4 illustrates the schematic for two GPR t races in the GPRIn vNet. The architecture of the GPRIn vNet, as well as its imple- mentation, is descri bed in the follo wing section. Since the trace-to-trace encoder is specially designed for GPR data in version, the encoding process was introduced in detail. How- e ver , the adopted decoder was con ventional and topological ly identical to the decoder component in the SeisIn vNet model. Therefore, the decoder and the loss function of the network ha ve only been briefl y presented in this study . Authorized licensed use limited to: SHANDONG UNIVERSITY. Downloaded on September 26,2021 at 07:58:20 UTC from IEEE Xplore. Restrictions apply. 8310 IEEE TRANSACTIONS ON GEOSCIENCE AND REMOTE SE NSING, V OL. 59, NO. 10, OCTOBER 2021 Fig. 4. Schematic for proces sing two GPR tr aces in the GPRInvNet. D i r − 1 and D i r are the two adjacent GPR tr aces of the B-S can D i ; F i is the features extracted f rom D i by using five convolutional layers w ith 5 × 5k e r n e l s ; F i r − 1 and F i r are the r − 1th and the r th column s of features of F i . F i r − 1 which is spatially aligned to D i r − 1 is denoted as the “enhanced trace” of D i r − 1 ,a n d F i r which is spatially aligned to D i r is denoted as the “enhanced trace” of D i r . G i is the features compress ed fr om F i by us ing five fully connected layers. G i r − 1 and G i r are the two adjacent features of G i . G i r − 1 is obtained by compressing the tim e dimension (tim e steps) of F i r − 1 from T to C ,a n d G i r is obtained by com pressing the tim e dim ension (time steps) of F i r from T to C ; P i r ∗ − 1 and P i r ∗ are the adjacent columns in the permittivity map P i . P i r ∗ − 1 which is spatially aligned to G i r − 1 is denoted as the “sensitive zone” of D i r − 1 ,a n d P i r ∗ which is spatially aligned to G i r is denoted as the “sensitive zone” of D i r . C. T race-to-trace Encoder In this study , the encoder of the GPRIn vNet framework has been described as a trace-to-tr ace encoder . This is due to the fact that it was able to enrich t he information of each trace and separately condense the features of each trace. The encoder consist ed of five con volut ional layers and five fully connected layers. The conv olutional layers were employed to generate the feature map F , which not only h ad the same dimensions as the input B-Scan images but also contained knowledge extracted from several adjacent GPR traces . This design was inspired by the fact that the echoes of one abnormality were often mainly observed in several adjacent traces of the GPR B-Scan. The numbers of con volut ional layers of the network determined the numbers of adjacent traces from which we extracted the information related to the a bnormality . How ev er , the more con volutional layers we emplo yed in the network, the more redundant parameters to be determined. Therefore, the GPRIn- vNet wit h dif ferent numbers of con volut ional layers were compared. The encoder cons isted of three, five, and se ven con volutional layers was utilized to enrich the information of each GPR trace by extracting information from different numbers of adjacent GPR traces. The detailed frame work of the encoder with different con volutional layers can be found in Fig. 5. Once the trace separation of the B-Scan was confirmed, the numbers of co rresponding neighboring traces for three, five, and se ven con volutional layers using 5 × 5 con volutional kernels were 13, 21, and 29, respecti vely . For the encoder with sev en con volut ional layers, we output the feature map with a dimension of 800 × 99 × 64 so as to reduce the parameters in the network and sav e computational cost. T o illust rate what the “enriched GPR trace” looks like, we visualized the ov erall perspective for the feature map F i T × R × E by computing the sum of feature val ues per pixel over all the E channels ( E represents the numbers of fea- ture channels of the feature map F i T × R × E ) .F i g .5d e p i c t s the comparativ e res ults of vi sualized features for different numbers of conv olutional layers. As can be seen from Fig. 5, the feature map extracted from the B-Scan using the encoder with three conv olutional layers retained most of the properties of the B-Scan. Compared with the groundtruth, “hyperbolic” morphologies can be observe d around the zones where the abnormalities existed. While for the feature m aps obtained by the encoder wit h five and se ven con volut ional layers, the hyperbolic morphologies were mitigated notably . The zones where the abnor malities existed hav e been highlighted, which means the “enhanced GPR traces” (extracted features spatially corresponding to the GPR traces) can provide more information to reconstruct t he permittivity of the abnormal- ities. The feature maps extracted using seven con volutional layers were quite similar to those e xtracted usi ng five con- volutional lay ers, wh ich mean th ere were no great differences between the information enriched using five con volut ional lay- ers and seven conv olutional layers. Therefore, for the GPR data in this study , the information ext racted from 21 neighboring traces was sufficient to enhance the information of each GPR trace. In order to sav e computational cost, encoder with five con volutional layers was employed. The 5 × 5 conv olution al kern els with a stride of 1 were employed in each layer in order to extract adjacent information from the GPR B-Scan D i T × R × 1 . Also, this study experimented with 3 × 3 con volutional kernels . Howe ver , the results were found to underperform those obtained by employing 5 × 5 con volutional kernels. The receptive field for the 5 × 5c o n v o - lutional kern els with five conv olutiona l layers was 21 , while that for the 3 × 3 conv olutional kernels wa s 11. After five con volutional layers, a feature map F i T × R × E with the same spatial dimensions as the input GPR B-Scans D i T × R × 1 was generated. In the current study , F i T × R × E signifi es the Authorized licensed use limited to: SHANDONG UNIVERSITY. Downloaded on September 26,2021 at 07:58:20 UTC from IEEE Xplore. Restrictions apply. LIU et al. : GPRIn vNet: DEEP LEARNING-BAS ED GROUND PENETRA TING RADAR DA T A INVERSION 8311 (a) (b) (c) Fig. 5. Architecture of encoder with different conv olutional lay ers and the corresponding visualized feature maps. The B-Scan D i with a dimension of T × R × 1 is the input; the output feature maps F i for encoder with three conv olutional layers is with a dimension of 800 × 99 × 16; F i for encoder with five conv o lutional layers is with a dimension of 800 × 99 × 64; and F i for encoder with seve n conv olutional layers is with a dim ension of 800 × 99 × 64. (a) V isualized features for anhydrous defects. (b) V isualized features for water-b earing defects . (c) V isualized f eatures for defects under rebar . feature maps encoded from the i th GPR B-Scan, and E denotes the number of feature channels. The obtained feature map F had the same dimensions as the input. Ho we ver , the feature at each position also contained the neighborhood information. In regard to the GPR data of each trace D i r with the d imension s [ T ; 1], the conv olutional layers had converted the data into a feature vector F i r with the dimen sions [ T ; E ]. Then, each F i r was spa tially alig ned to a column of the permittivity m ap in order to complete the inversion pro cess. The feature map F i T × R × E was treated as the R columns of the feature vectors of the r th GPR trace F i r . It was observe d that, unlike the SeisIn vNet model which encoded the embedded features into a feature map, the GPRIn vNet encoded the features of each trace separately and then spliced the features of all the traces to form a group of feature maps. This process was implemented using the fully connected layers to separately condense the feature vector of each trace F i r . The desi gn of the fully connected layers in GPRIn vNet orig in ated from the need to maintain the spatial alignments between the input B-Scan images and output p e rmittivity maps. In this study , for each enco d ed GPR trace F i r with the d imensions [ T ; E ], five fully connected layers were adopted to fuse the time dimensional features of each trace and combine them in to features maps with the dimensions [ C ; E ]. In addition, each fully connected layer included activ ation and batch normalization operations. The fully connected layers were implemented for all of the R feature vectors of the feature map F i T × R × E .I nt h i sw a y ,n e w feature maps G i C × R × E , which had the same dimension rati o as the per mittivity map P i , were generated. The r th colu mn vectors of the ne w feature maps were denoted as G i r ,w h e r e G i r indicates a size of C × E . T his stud y then artificially enforced each G i r to b e spatially aligned to a column of the permittivity map to be inverted. The trace-to-trace encoder adopted in this study had dis- played the fo llowing two benefits fo r the GPR inv ersion in comparison to the existing networks: 1) the encoder had made the best use of the raw GPR data by using the conv o lutional layers to enhance the effecti ve information of each trace from its adjacent traces and 2) it had re tained the spatial alignments between the B-Scan images and permittivity map by separately encoding the features of each trace. D. Decoder and Loss Function In the encoder , the feature maps G i C × R × E with the same dimension al ratios as th e permittivity maps to be in verted P i H × W were generated. More importantly , the features of each GPR trace G i r were spatially align ed to the sensitive zones in the permittivity m ap P i r ∗ ,w h e r e r ∗ ∈[ 1 , W ]. Then, using those features, the high-quality dielectric images cou ld be easily and accurately reconstructed. The deco der , which was employed in this stud y , was sim ilar to that of the Sei sIn vNet model [37]. Ho wever , adjustment s made the parameters of the decoder networks based on the permittivity m aps to be reconstructed. The decod er c onsisted of a 4 × 4 up-con volution, six 3 × 3 con voluti ons, and one up-sampling operation. A 4 × 4 up -conv o lution with a stride of 2 was first deployed in order to enlarge the dimensions of the f eature maps. This was followed by a 3 × 3 con volution with a stride of 1 , w h ich was u sed to stabilize the inf ormation . Then, an up-sam p ling operation was u tilized to form featu r e Authorized licensed use limited to: SHANDONG UNIVERSITY. Downloaded on September 26,2021 at 07:58:20 UTC from IEEE Xplore. Restrictions apply. 8312 IEEE TRANSACTIONS ON GEOSCIENCE AND REMOTE SE NSING, V OL. 59, NO. 10, OCTOBER 2021 maps with the same dimensions as the p ermittivity maps. Finall y , four 3 × 3 conv olution al kernels with a stride of 1 were added for the purpose of condensi ng the dimensi ons of the feature channels . A dropout method w as empl oyed to randomly abandon some of the feature maps in order to av o id over-fitting an d im prove the r obustness of the networks. In principle, each feature map G i r with th e size C × E wa s utilized to accurately in vert a small piece of the permittivity model P i r ∗ , which had the size H × 1. The entire perm itti vity map P i was accurately reconstructed in this study by splicing all of the P i r ∗ together . In regard to the loss function, this study employed a combinatio n of the L2 nor m an d multi-scale stru ctural sim- ilarity (MSSIM) to mi nimize the misfits between the input and output images. The loss function was calculated as follo ws [37], [46] : L i ( P i , ¯ P i ) = H h = 1 W w = 1 P i ( h ,w ) − ¯ P i ( h ,w ) 2 − r ∈ R H h = 1 W w = 1 λ r · SSIM P i x (( h ,w), r ) − ¯ P i y (( h ,w), r ) (2) where P i and ¯ P i represent the in version results and ground truth for i th data pair s, respectively; x (( h ,w ), r ) and y (( h ,w ), r ) are the tw o corresponding windo ws centered on ( h ,w ) with size r , in which h ∈[ 1 , H ], w ∈[ 1 , W ]; R is the total number of scales; and λ r is the weight of scale r . Then, by simultaneousl y minimizing the norm metrics and maximizing the MSSI M, the mod el was o p timized in both structura l similar ity and per pixel error rates in the output images. IV . N UMERICAL S IMULA TION A. Bu ild ing the Data Set T o provide suffi cient data for the training of the GPRIn vNet, numerical simulations were conducted to generate synthetic data for the common types of tunnel lining defects. These included lining voids, cracks, lining-rock delamination, leak- ages, and non-compactness of the concrete. The data set basically cove red the most common types of tunnel lining defects characterized by irregul ar shapes. More specifically , the d ata set consis ted of four categories with different con- figurations of defects as follo ws: 1) tunnel linings (concrete and rock) containing only rebars or one type of defect (lining voi ds, cracks, lining-rock delamination, or non-compactness); 2) tunnel linings with both rebar layers and one type of defect; 3) tunnel linings cont aining multiple defects; and 4) tunnel linings with rebar layers and multiple defects. For each category , both air and water were considered as the media of the defects, and the permittivity tendencies for the ground and concrete were chosen from a certain range. In total, a data set containing 432,000 pairs of data was built. Each data pair included a GPR B-Scan as the input and a permitti vity model as the ground truth. There were five different types of media in volved: air , surrounding rock, concrete, water , and rebars. The parameters utilized in the simulation s are listed in T able I, which had been selected and modified from [47]. TA B L E I R ELA TI VE D IELECTRIC C ONST ANT AND C ONDUCTIVITY P RO P E RT I E S The GPR modeling was performed based on various finite dif ference time domain (FDTD) methods using an in-house MA TLAB code. During the numerical simulat ions, a permit- ti vity mod el with a width o f 2 .0 m and a dep th of 0.7 m was constructed. A conv olutional perfectly matched layer (CPML) was employed to mitigate the impacts of the boundary effects. The spatial size of the FDTD forward grid was 0.01 m, and the CPMLs h ad o ccu pied 10 meshes. Th erefore, each pe rmittivity map co nsisted of 9 0 × 220 meshes, which included the 70 × 200 meshes of the tunnel lining and the outer 10 meshes of the CPMLs surrounding the tunnel lining. The total number of traces R for each model is 99, and the total time step T was 800, with a time window of 2.3587e − 11 s. The source wa velet was a Ricker wa velet with a center frequency of 600 MHz. The equation of the Ricker wa velet in time-domain can be express ed as follo ws : f ( t ) = ( 1 − 2 π · f 2 c · t 2 ) · e − (π f c · t ) 2 (3) where f c represents the center frequency . One of the main contrib u tions of this study was the recon- struction of the permitti vity map of various tunnel lining defects with irre gular geometries. Therefore, the shapes of the simulated lining defects wer e relati vely irregular in order to show the applicability of the proposed GPRInvNet in the in version of defects with various shapes. Durin g the simu la- tions, the background was first modeled, which included the concrete, surrounding rock, and rebars. The interfaces of the surrounding rock were generated by fitting randomly deployed nodes at the bottom of the model using the secondary spline curves. The rebar layers were located in the range of 5–25 cm, with interv als randomly selected between 15 and 30 cm. T o simul ated practical conditions of the tunnel, lining had resembled real situations as clos ely as possible. The dielectric parameters of the concrete and rock were randomly selected from the ranges listed in T able I. Foll ow ing the completion of the background model ing, the common types of tunnel lining defects with irregular shapes were generated b y fitting the constraint nodes using the spline curves. The sizes of the voids had ranged from 16 × 5c mt o6 0 × 40 cm, and the lengths of the cracks were between 20 and 6 0 cm. Then, in order to simulate the lining-rock delamination defects, this study first randomly located their positions along th e interfaces between concrete and rock. The same method which had been adopted for the modeling process was implemen ted for the void defects in order to formulate delamination defects wi th s izes ranging Authorized licensed use limited to: SHANDONG UNIVERSITY. Downloaded on September 26,2021 at 07:58:20 UTC from IEEE Xplore. Restrictions apply. LIU et al. : GPRIn vNet: DEEP LEARNING-BAS ED GROUND PENETRA TING RADAR DA T A INVERSION 8313 TA B L E I I D ET AILS OF THE GPRI NV N ET from 16 × 5 cm to 100 × 40 cm. In re gard to the noncom- pactness defects, sections with sizes ranging from 20 × 20 cm to 60 × 60 cm were randomly selected. Subsequently , m any small voids wer e g enerated with in the selected sections. All of the defects were randomly distributed in the permittivity map. B. Experimental Pr ocess This study randomly assigned each configuration of defects to th e tr a ining d ata, validation data, and testin g d ata with a set ratio of 10:1:1. Then, a data set with a total of 432 000 data pairs was randomly di vided int o three sub-data s ets, in which 360 000 pairs were us ed for trai ning, 36 000 for va lidation, and 36 000 for testing. In order to verify the impact of the conducti vity on the in version result of relativ e permitti vity , a supplementary data set with a total of 50 data pairs was added into the testing dat a set. The defects of the permitti vity m odels in the supplementary data set were filled with a media wit h the conducti vity of 0.5 S/m and the relati ve dielectrics constant of 81. It should be noted that the permitti vity models in the supplementary data set contained different electric conductivities, and the GPRIn vNet was never trained on the supplementary data set. Each B-Scan D i was measured 800 × 99 ( T × R ), and the corresponding permittivity model P i had the dimensions of 90 × 220 ( H × W ). The outer ten layers o f P i were CPMLs, which had been cropped from the p ermittivity mo del. Finally , an outp ut p ermittivity model with the dimensions 70 × 200 was obtained, which corresponded to a tunnel lining m easuring 0 . 7 × 2m . The d etails of each layer o f the GPRIn vNet in this study are liste d in T able II. The experiments were conducted on an Intel Xeon (R) Gold 5118 CPU worksta tion, with 64 GB RAM and a GTX 1080 T i GPU. The GPRIn vNet was implemented based on Pytorch [48]. Then, in order to optimi ze the GPRIn vNet, an Adam optimizer with batch size of 12 was applied , with a learning rate of 5e − 5 . The dropout rate in the decoder was 0.2. The GPRIn vNet contai ned 2 041 326 parameters and could be trained end-to-end. The model s were trained for 100 epochs (means 100 iterations in this study), which was observed to be more than suffici ent to ensure conv ergence. In addition, follo wing the con vention, the parameters which had performed be st on th e v alidation set were saved and follo w-up experiment s were conducted on the validat ion and test se ts. A series of metrics were employed to quantitatively ev al- uate the performance result s of the GPRIn vNet. This study quantified th e misfit er rors o f the in version resu lts based o n mean a verage error (MAE) and mean square error (MSE) methodology [37]. In addition, the similarities of the local structures were measured by MSSIM [45] and SSIM [49]. C. Comparati ve Study and Results For the purpose of verifying the superiority of the proposed method in reconstructing the permitti vity maps of tunnel linings containing comple x internal defects, a comparati ve study w as performed based on synthetic GPR data. Both physics-dri ven and data-dri ven methods were chosen as base- lines. T h e GPRInvNet was comp ared against the DNN-based model Enc-Dec, as well as the widely used physics-dri ven method FWI. All of t he methods were tested on the same testi ng data set. This study’ s comparativ e result s are shown in Figs. 6 and 7. The in versio n results for th e relati vely sim- ple tunnel lining defects are displayed in Fig. 6(a-1)–(e-1) , and Fig. 7(a-1)–(e-1) illustrates the ground truths. The per- mittivity maps recon structed using the FWI are shown in Fig. 6(a-2)–(e-2) and Fig. 7(a-2)–(e-2) . The inv ersion results of the Enc-Dec are detailed in Fig. 6(a-3)–(e-3) and Fig. 7(a-3)–(e-3) . In addition, Fig. 6(a-4)–(e-4) and Fig. 7(a-4)–(e-4) provide the reconst ruction results achie ved using the GPRIn vNet. D. Comparison W ith Enc-Dec Network The En c-Dec network, wh ich was initially developed for image segmentati on, wa s e mployed for mapping the GPR B-Scan images to the subsurface images of concrete in [42] . The image-to-image translati ons were found to be simil ar to the inversion task, with the exception that the inversion pro- vided not o nly the su bsurface images but also the perm ittivity va lues. The Enc-Dec network was found to outperform the U-Net and GAN for imaging the subsurface defects according to the aforementioned study . Therefore, the Enc-Dec network was chosen as a baseline model in this article. The Enc-Dec in this study had the same architecture as in [35] and [36] . It consisted of an encoder and a corre- sponding decoder . Each con vol utional layer employed a 4 × 4 conv olu tional filter with a strid e o f 2 for do wnsamplin g the input images, batch normalization, and element-wise rectified- linear non lin earity (ReLU) in orde r to extract features from the Authorized licensed use limited to: SHANDONG UNIVERSITY. Downloaded on September 26,2021 at 07:58:20 UTC from IEEE Xplore. Restrictions apply. 8314 IEEE TRANSACTIONS ON GEOSCIENCE AND REMOTE SE NSING, V OL. 59, NO. 10, OCTOBER 2021 Fig. 6. In version res ults for simple tunnel lining defects . (a) Tunnel lining with anhydrous defects. (b) Tunnel lining containing one water -bearin g defect. (c) Tunnel lining w ith multiple water-bear ing defects. (d) Tunnel lining containing multiple defects with different relative permittivit y and different conducti vities. (e) Tunnel lining containing multiple defects with differen t relative perm ittivity and different conducti vities. T he images of t he first column are B-Scan; the images of the second column are ground tr uths; the inv ersion results of the FWI, E nc-Dec, and G PRIn vNet are illus trated in the im ages of the third, fourth, and fifth columns, res pectiv ely; and lines I–V are the four cutting lines . GPR B-Scan images. Accordingl y , the decoder recovered the defects from the embedding vector . Then, 4 × 4 transposed con volutions wit h a stride of 2 were employed to upsample the vector . T he loss fun ction was DSSIM [42], and th e initial learning rate was set as 5e − 5 . Both the Enc-Dec and GPRIn vNet were trained on the same data set for 100 epochs. In addi tion, in order to maintain physical information in the input and output data, this study directly employed the raw data p airs to train the n etwork rather than reformatting them into images. As a result, the input and output of the Enc-Dec network in this study both contained data of the physical characteristics of the concrete rather than the pixels of the images. The input B-Scan data with the dimensions of T × R were r esized in to a matrix with dimensions of 256 × 128, and the output permittivity maps were resized from [128, 256] to [90, 220]. As can be seen from F ig. 6, Enc-Dec w as capable of reconstructing the interf aces between rock and concrete as well as some simple defects, such as cracks, voids, and delamination without rebar . Howe ver, the reconstructed defects typically had blurred boundaries. Moreov er , for some of the permittivity m aps con taining multiple d efects with differ - ent relative p ermittivity and d ifferent conductivity , Enc-Dec incorrectly reconstructed the water -bearing defect, as shown in Fig. 6(d-3). In contrast, GPRIn vNet successfull y recon- structed tunnel lining defects with relat iv ely clear bound- aries. The shapes of anhydrous cracks, anhydrous voi ds, wate r-bearing cracks, rebar , and surrounding rocks recon- structed by GPRIn vNet were highly consiste nt with the ground truths. Even wh en th e materials of th e multiple defects inside the perm itti vity model are different ( one defect was filled with water and the other was air) and present noticeably different electric conductivities, the GPRIn vNet could still reconstruct these tunnel lining defects with relative ly clear boundaries [Fig. 6(d-4) and (e-4)]. Additionally , it should be noted that the permittivity models with ne w electric conducti vities were directly u tilized for testing, and the GPRInvNet was never trained on the data pairs with new electric conductivities. The result indicates that th e GPRIn vNet h as satisfy ing adaptab ility . For tunnel linings with complex defects, such as noncom- pactness, defects under t he rebar, etc., GPRIn vNet clearly outperformed Enc-Dec. As can be seen in Fig. 7(b)–(d), Authorized licensed use limited to: SHANDONG UNIVERSITY. Downloaded on September 26,2021 at 07:58:20 UTC from IEEE Xplore. Restrictions apply. LIU et al. : GPRIn vNet: DEEP LEARNING-BAS ED GROUND PENETRA TING RADAR DA T A INVERSION 8315 Fig. 7. In version results for com plex tunnel lining defects. (a) Tunnel lin ing with noncom pactness and delamination. (b) T unnel lining w ith rebar on ly . (c) Tunnel lining with anhydrous defects under rebars. (d) Tunnel lining cont aining one water-bearing crack under rebars . (e) T unnel lining w ith wat er-bearing noncompactness under rebars. The images of the firs t column are B-Scan; the images of th e second column are ground truths; the in v ers ion res ults of the FWI, Enc-Dec, and GP RIn vN et are illus trated in the images of the thir d, f our th, and fifth columns, res pecti v ely; Lines I–V are the four cutting lines . Enc-Dec failed to reco ver the rebar for most of the cases. This is probably because the size of each rebar is very small, so Enc-Dec failed to learn the features of rebar during the fea- ture extraction pr ocess. The En c-Dec reconstructed the rebar in Fig. 7(e-3). This is p robably because the size dif ferences of the w ater-beari ng non-compactness defects and the rebar were small in this case, and their characteristics were quite similar . The Enc-Dec learned ef fectiv e features for this par- ticular case during the training process. For the noncompact- ness [Fig. 7(a)] and water -bearing non-compactness defects under rebar [Fig. 7(e)], because the hone ycomb obstructed the pr opagatio n of electromagnetic wa ves, neith er method could perfectly recover the shapes of defects. As shown in Fig. 7(a) and (e), Enc-Dec could only partially reco ver the defect with a very blurry region. In contrast, GPRIn vNet successfully p r ovided comp lete pro files of th e co mplex non-compactness defects [Fig. 7(a-4)] even if the defects were belo w the rebar [Fig. 7(e-4)]. Although the shapes of the com- plex defects reconstructed by GPRIn vNet were not completely consistent with the ground truths, it still pro vided the best in version results. T ABLE III C OMP ARIS ON OF E VA L U A T I O N M ETRICS T o quantitatively ev alu ate the perf ormances of the two DNN-based methods, the e valuation metrics on the validation set and test set are listed in T able III. In general, GPRIn vNet achie ved the best performance. On the test set, the MAE, MES, SSIM, and MSSIM of GPR In vNet were 0.00286, 0.000374, 0.973784, and 0.980623, respecti vely . They are better than Authorized licensed use limited to: SHANDONG UNIVERSITY. Downloaded on September 26,2021 at 07:58:20 UTC from IEEE Xplore. Restrictions apply. 8316 IEEE TRANSACTIONS ON GEOSCIENCE AND REMOTE SE NSING, V OL. 59, NO. 10, OCTOBER 2021 Enc-Dec’ s, which were 0.004895, 0.002515, 0.949639, and 0.858237. In general, GPRIn vN showed consis tent superiority according to all ev aluatio n metrics compared. Therefore, GPRIn vNet outperformed Enc-Dec in GPR in version. The shapes and details of the defects reconstructed by GPR In vNet are obviousl y better than those reconstruct ed by Enc-Dec. This is due to the speci ally designed encoding approach of GP RIn vNet, which can make full use of t he informatio n durin g the extraction of the featur e map as well as retaining the spatial alignment between the input and output. On the contrary , Enc-Dec employs a fixed con volutional kernel to extract the f eature map as we ll as comp ressing the dimen- sion. This may lose detailed information, such as the features of small-sized rebars and the boundaries of defects. Moreover , Enc-Dec decod es the permittivity m ap from the vector , which may contrib ute to the loss of spati al information. E. Comparison W ith FWI FWI is used to reconstruct dielectric p roperties with all recei ved wav eforms, b y means of minimizing the difference between the forward modeling wa veform and observed wa ve- form [13 ]. FWI for GPR d ata is very sensitive to the initial model, and is easily conver gent to a local minimum or cycle skipping. Many de velopments of FWI ha ve been presented, so as to improve its performance. In tunnel lining-related applications, an FWI with mu ltiscale strategy was introduced in [24] to accurately reconstruct the complex irregular defects. In order to demonstrate the performance of GPRIn vNet, in this section of this article, a comparative study ag ainst the multi- scale FWI meth od was perfor med. The multi-scale inv ersion strate gy employed frequency information ranging from lo w-to high-frequency regions during the inv ersion process, so as to a void FWI con vergence to a local minimum or cycle skipping. In addition, in order to further improve the performance, the initial models utilized in this study were o btained by apply- ing a Gau ssian smooth ing to the tru e permittivity models [50 ]. The mu ltiscale FWI procedure in this study is as f ollows. Step 1: Input the initial models. In this article, the initial models were obtained by applying a Gaus sian smoothing to the true mo dels. This op eration has previously been utilized in [50 ] to improve the quality of th e FWI of GPR data. The size of the squ are matrix in the Gau ssian func tion was 3 5, and the standard devi ation was set to 35. By doing so, the main trends o f the defects an d interfaces were retained in the initial models. Step 2: Determine the n umber of mu ltiple scales an d th e objective frequency of each scale. The multiscale inversion strategy deco mposes th e inversion p roblem into mu ltiple scales with v arious frequencie s. In this st udy , the inv ersion was performed by using the followi ng three scales: 200 MHz for in versing the enve lopes and 200 and 600 MHz for inv erting the permittivity map s. T h e flo wchart of the three scales is designe d as fo llows. 1) The objecti ve frequency was assigned as 200 MHz. Then, Steps 3–6 were employed to in vert the env elopes using the low-frequenc y GPR data with the objectiv e frequency of 200 MHz. 2) The inversion result of 1) was employed as the initial model, and the objecti ve frequency w as as signed as 200 MHz. Then, we repeated Steps 3–6 to invert the permitti vity map using the lo w-frequency GPR data with the objecti ve frequency of 200 MHz. 3) The objectiv e frequency was assigned as 600 MHz and the inversion result of 2) was emp loyed as the initial model. Next, the high-frequenc y GPR data wi th the objecti ve frequency of 600 MHz were employed to in vert the perm ittivity m a ps b y repeating Step s 3–6 once again. Step 3: Filter the GPR data using a Wiener low-pass filter . The multiscale in version strategy inv olved a W iener lo w-pass fi lter by which to process the wa velet of source pulse and GPR data, so as to obtain the info rmation within the objecti ve frequency . More specifi cally , the collected GPR data were transformed into the frequency domain. Subsequently , the W iener low-pass filtering with th e preset objecti ve f r e- quency in Step 2 was applied on the source pulse and the collected GPR data. The equation o f W iener low-pass filter can be found in [24]. Finally , the filtered results were transformed back into the time domain. Step 4: Calculat e the gradient using the equations of forward- and back-propagated wa v e-fields. Then, calculate the iteration stride based on the equatio n of grad ient direction and update the model. The equations utilized in this step can be found in our pre vious study [25]. Step 5: Determin e whether or not the termin ation co ndition has been achiev ed. The terminatio n cond ition was set to achie ve the maximum number of iterati ons at 200 times. If the termination condition was achieved, then pro ceed to Step 6, otherwise return to Step 4. Step 6: Access if FWI has been conducted for all the scales. If not, return to Step 2 and update the initial model and objective f requen cy . If the FWI for multiple scales has been completed, then output th e in version results. At this point, the multiscale FWI o f GPR data has been realized using low- to high-frequency serial in version tech- niques. The frequency-by-freq uency strate gy wa s capable of a voi ding the local minimum, t h ereby retaining the d etails of the d efect and eliminating the pseudomorph of in version. Therefor e, the FWI is shown to b e suitable fo r the in version of complex tunnel lining irregular defects. The in version results of FW I for tunnel lining with simple defects can be found in Fig. 6. As we can see from Fig. 6 , FWI can roughly determine the p rofile of cracks, v oids, and delaminatio n in no n-reinf orced co ncrete with relatively blurred boundaries. The in versi on results of the anhydrous defects [Fig. 6( a -2)] are sligh tly better th an those o f the water-bearing defects [Fig. 6(b-2) and (c-2)]. For the multiple d efects filled with different materials, the FWI could reconstruct their pro- files [Fig. 6(d-2) and (e-2)], although the boundaries were blurred. On the contrary , GPRIn vNet could reconstruct the defects with clear boundaries. For the complex defects, FW I provided the best inv er - sion results in reconstructi ng the anhydrous noncompactness . It is outperformed the Enc-Dec, but it still underperformed GPRIn vNet. Comparing Fig. 7(a-2) with Fig. 7(a-4), both the Authorized licensed use limited to: SHANDONG UNIVERSITY. Downloaded on September 26,2021 at 07:58:20 UTC from IEEE Xplore. Restrictions apply. LIU et al. : GPRIn vNet: DEEP LEARNING-BAS ED GROUND PENETRA TING RADAR DA T A INVERSION 8317 FWI and the GPRIn vNet provide relati vely accurate detailed structures of noncompactness. Howe ver , the FWI presents blurred profiles for the delaminati on under noncompactness. For defects under rebar , it is apparent that FW I underper - forms the GP RIn vNet for reconstructing anhydrous defects and water -bearing defects deplo yed in reinforced concrete, as is shown in Fig. 7(b-2), (c-2), (d-2), and (e-2). The FWI could only reconstruct the region of rebar . The defects under rebar were submerged in the pseudomorph, as show n in Fig. 7(c-2), and (e-2). This is probably due to the mask of rebar on the defects. Moreover , as there are great dif- ferences in the dielectric prope r ties of the rebar and the defects, so most electromagnetic wa ves were reflected by rebar . In such situations, FWI could rarely achieve optimal parameters. Howe ver , GP RIn vNet provided more satisfying results and clear boundaries of defects, even if the defects were under the rebar . Thus, the overall performance of GPRIn vNet is better than that of the traditional FWI. In terms of the compu tational cost, th e multi-scale FWI took approximately 60 min to complete in version for a single B- Scan image. On the contrary , a well-trained GPRInvNet is capable of in verting one image within app roximately 0. 027 s. Although training the neural network is a comput ationally intensive process, it takes place only once. Th e well-trained GPRIn v Net can be used with near-real-time speed for GPR in version. F . Comp arison o f P ermittivity V alues T o further analyze the in version effects, we compared the permittivity v alues of th e aforementioned methods. The relative p ermittivity v alues were extracted along the cutting lines. The cutting lines were nu mbered fr o m I to V , as shown in Fig s. 6 an d 7. Th e relative perm ittivity values along the cutting lines of Fig s. 6 and 7 are sho wn in Fig s. 8 and 9 respecti vely . As show n in Figs. 8 and 9, the in version curves of permit- ti vity through GPR InvNet are essential ly the same as those of the ground truth, except that the amplitude is slightly different. Compared with Enc-Dec and FWI, we can find that f o r all the common def ects, the oscillation of p ermittiv- ity reconstructed by GPRIn vNet is effecti vely alleviated and closer to the real values. T aking the line V in Fig. 9 as an example, GPRIn vNet successfu lly pr ed icted the variation o f permitti vity at a depth of 40 cm , while the remaining methods mis-detected it. FWI g av e the worst results, as shown in Fig s. 8 and 9 (pink line). It can be observed that the FWI provides desirable inv ersion results for the anhydrous defects. Howe ver , the relative permitti vity v alu es of defects under rebar and water -bearing defects predicted by FWI are always away from the true values. Compared with the DNN-based method, the permittivity curves reconstr u cted using traditio nal FWI show great fluctuations. The performance of Enc-Dec was better than that of FWI, but it still underperformed GPRInvNet. For some water -bearing defects, the results of Enc-Dec dif- fered greatly from the real results in terms of the general trend of permittivity change (Fig. 9 ; Line V). Moreover , Enc-Dec f ailed to reconstruct some of the permittivity of Fig. 8. Comparison of in verted per mittivity values along the depth of the tunnel linings for simple tunnel lining defect. (a)–(e) Inv erted relati ve permittivity values of cutting lin es I–V in Fig. 6, respectively . rebar . Therefore, the overall performance of GPRInvNet w as better than th at of Enc-Dec as well as the wid ely used FWI method. Authorized licensed use limited to: SHANDONG UNIVERSITY. Downloaded on September 26,2021 at 07:58:20 UTC from IEEE Xplore. Restrictions apply. 8318 IEEE TRANSACTIONS ON GEOSCIENCE AND REMOTE SE NSING, V OL. 59, NO. 10, OCTOBER 2021 Fig. 9. Comparison of in verted permittivity v alues along the depth of the tunnel linings for complex tunnel linin g defects . (a)–(e) Inv erted relativ e permittivity values of cutting lines I–V in F ig. 7 respectively . W e also looked closer at th e permittivity measu red for different filling mater ials an d co mpared the in version results at a pixel level. The inverted results with maximu m er ror fo r anhydrous defects lie in Fig. 9 Line I at a depth of 20 cm. The relati ve permittivity of the anhydrous defects in verted by GPRInvNet was appro x imately 2 , which is close to the true value o f 1, while at the same location , the inverted p ermittivity values by Enc-Dec and FWI were 4 and 3, respectiv ely . For GPRI n vNet, the inverted value of rebar with the maxi- mum devia tion can be found in Line V of Fig. 9. The in verted va lue is 296, which is quite close to the true value of 300 in the simulation. On the contrary , the result of rebar provided by FWI with the best performance was 50, and Enc-Dec failed in recognizing rebar . For the water -bearing d efects, the results reconstru cted using GPRInvNet were also clo se to the true values. For example, the true r elative permittivity at a depth of 24 cm in Fig. 8 Line II I is 80. The permittivity p rovided by GPRIn vNet was approximately 78, while the result of Enc-Dec was 68. Even for the water -bearing defects below the rebar (Fig. 9(e) at the depth of 40 cm), only GPRIn vNet predicted the v ariation of the permitti vity . Although the predicted value of 40 was smaller than the true value, it still perfo rmed be tter than other methods. In general, we can conclude that GPRIn- vNet outperforms o ther methods in quantitatively in verting permittivity values. G. Comparat ive Study of Resolution The resolution of the GPR image as proposed in [51], can be understood as the capacit y to dis criminate indivi dual targets in the subsurface. The vertical resolution is the capacity to discriminate two adjacent targets separated in different depths as two dif feren t e vents, wh ile the horizontal resolution is the minimum distance between two targets located at the same depths that can be detected as two events [52] , [53]. Unlike the geophysics model-dri ven in versi on methods, it is dif ficult for the DNN-based inversion method which is d ata-driv en to provide a mathematical r elationship for im aging resolution. At presen t, th ere are no existing literatures to study the imaging resolution fo r th e deep learning -based G PR inversion and imaging method, e ven in the field of seismic in version and electrical resistivity in version. In add ition, in the stud ies related to deep learning-based images superres olution, which has been one of the most acti ve research areas, the mathe- matical relationships have also not been deriv ed and resolu- tions of all the methods were va lidated on the classi cal data sets [54], [55]. Therefore, in order to verify the resoluti on of the proposed method, we examined the performance of the classical square models and rebar models. These models have been documented and were considered as ef fectiv e indicators of resolution iss ues [56] , [57]. A supplementary data set with square models and rebar model s w as synthesized to fine-tune the GPRIn vNet. The supplement ary data set con- sist ed of 15 600 data pair s, in which 11 388 for training, 2106 for validation, and another 2106 for testing. The band- width and central frequency of the GPR excit ation signal are important for characterizing the resolution [59], [61]. In order to study the effect of different GPR excitation sign als on the resolutio n, th ree different GPR source wavelets, which were widely utilized for tunnel detecti on, were employed to synthe- size the GPR data in th is study . The three source wav elets were the Ricker wav elets [60] with central frequencies of 400, 600, Authorized licensed use limited to: SHANDONG UNIVERSITY. Downloaded on September 26,2021 at 07:58:20 UTC from IEEE Xplore. Restrictions apply. LIU et al. : GPRIn vNet: DEEP LEARNING-BAS ED GROUND PENETRA TING RADAR DA T A INVERSION 8319 Fig. 10. Time-domain signals and the amplitude spectrum s of Ricker wavelets. (a) Time-domain signals of Ricker wav elets with different central freq uencies. (b) N ormalized amplitude s pectrums of Ricker wavelets w ith different central frequencies. (a-1) –(a-3) Time-domain signals of Ricker wavelets w it h central frequencies of 400,600, and 900 MHz, res pecti v ely. (b-1)–(b-3) Normalized amplitude spectrum s of the Ricker wav elets with central frequencies of 4 00,600, and 900 MHz, the corresponding bandwidths for the 400, 600, and 900 MHz R icker wavelets were approximate 436, 654, and 981 MHz, res pectiv ely. Fig. 11. In version results of square models and rebar models with different bandwidths and central frequencies to v erify the vertical res olution. The dimensions of the square models are 15 cm × 15 cm, and the diameters of the rebars are 2 cm. The red horizontal lines re present the m edial depths of targets, which are 25 cm . The first and second columns are anhydrous abnormalities. The third and fourth columns are water-bearing abnormalities. The fifth and sixth columns are rebars . (a) Ground truths and the corresponding inv ersion results of the 400-MHz G PR data. (b) Ground truths and the corresponding in version results of the 600-MHz GPR data. (c) Ground truths and the corresponding inv ers ion results of the 900-MHz GPR data. ε 1 , ε 2 ,a n d ε 3 are the relative perm itti vities, w here ε 1 is 1, ε 2 is 81, and ε 3 is 300. and 900 MHz. The bandwidths were calculated by referring to [61], and the corresponding bandwidths for the 400, 600, and 900 MHz Ricker wa velets were approximate 436, 654, and 981 MHz, respecti vely . The time-domain signals and amplitude spectrums of Ricker wa velets employed in this study are illustrated in Fig. 10 (a) and (b ) . Th e spatial size of the FDTD forward grid for the models of the three central frequen cies was 0.0 1 m, and th e dimen sions of the p er mittivity map of all of the models were 70 cm × 200 cm. W ithin the models, two targets (two square abnormalities or two rebars) with different distances and depths were randomly deployed into the m odels [56], [5 7]. In or der to clearly illustrate the targets, we zoomed in on the models and concentrated on the r egion of 70 cm × 70 cm in the middle of the model, as shown in Figs. 11 and 12. Both air and water were successi vely filled in the square abnormalities as anhydrous and water-bearing defects. The relative permittivities of the air , wat er , rebar , and background were 1, 81, 300, and 9, respecti vely . The dimensions of the square a bnormalities were randomly selected from 10 cm × 10 cm–25 cm × 25 cm, and the minimum diameters of rebars were 1 cm. The parameters of GPRIn vNet were fine-tuned on the supplementary data set for 50 epochs, and the b atch size for each epoch was 12. W e grad u ally increased th e d istances b etween the two targets, and some inv ersion results for the cases with different vertical resolutio ns were illustrated in Fig. 11. I t can be seen in Fig. 11, for the GPR data with different central frequencies (corresponding to different bandwidths), the GPRIn vNet was capable of distinguis hing anhydrous target s, water -bearing tar - gets, and rebars deployed with the vertical interval of 7, 5 and 3 cm, respecti vely [Fig. 11(a-1), (a-3), (a-5), Fig. 11(b-1), (b-3), (b-5), and Fig. 11(c-1), ( c-3), (c-5)]. When we increased the distances, the boundaries of the two targets can also be detected clearly . Although the in verted shape was sl ightly blurred for the rebars, th e two targets can still be detected . The results indicate that the GPRIn vNe t can effecti vely reconstruct the targets filled with air , wate r , and metal, and the detectable vertical d istances for the two targets wer e slightly larger than a quarter of the wav elength. Fig. 12(a)–( c) illu strate the inversion r e sults for GPR data with different cen tral frequenc ies and ban dwidths, in which two targets were placed horizontally with different intervals to ver ify the horizon tal resolution . The r esults show that GPRIn vNet can dist inguish anomalies with depths ranging Authorized licensed use limited to: SHANDONG UNIVERSITY. Downloaded on September 26,2021 at 07:58:20 UTC from IEEE Xplore. Restrictions apply. 8320 IEEE TRANSACTIONS ON GEOSCIENCE AND REMOTE SE NSING, V OL. 59, NO. 10, OCTOBER 2021 Fig. 12. Inv ersion results of s quare models and rebar models with differ ent bandwidths and central frequencie s to verify the horizontal res olution. The dimensions of the square models are 15 cm × 15 cm, and the diameters of the rebars are 2 cm. The red horizontal lines represent the medial depths of targets. T he depths of 1s t–6th columns are 25 cm, the 7th–12th columns ar e 45cm, and the 11th–12th columns are 15 cm. The first and second colum ns are anhydrous abnormalities. T he third and fourth columns are water-bearing abnormalities. The fifth and s ixth columns are rebars. (a) G round truths and the corresponding inv ersion results of the 400-MHz GPR data. (b) Ground truths and the corresponding in version results of the 600-MHz GPR data. (c) Groun d truths and the corres ponding in version results of the 900-MHz GPR data. ε 1, ε 2, and ε 3 are the relativ e permittivities, w here ε 1i s1 , ε 2 is 81, and ε 3 is 300. Fig. 13. Schematic of testing model and defects. (a) W aterproof box for the simulating void. (b) Acrylic box f or s imulating the cracks. (c) GPR system utilized in the experiment. (d) Model testing results and the deployment of the defects . from 15 to 45 cm. As it can be seen in Fig. 12(c-7)–(c-10), the GPRIn vNet is capable of detecting targets at the depths of 45 cm with an interv al of 3 cm [Fig. 12(c-7) and (c-9)] and 5 cm [Fig. 12(c-8) and (c-10)]. How ev er, the shapes of the recon structed targets at the d epths of 45 cm wer e slightly blurred than at t he depths of 25 cm [Fig. 12(c-1)–(c-4)]. A similar conclusion can be found for the GPR data with the central frequencies of 400 and 600 MHz. It demonstrated that horizontal resolutions are related to the depth s, an d the shallow targets hav e higher horizontal resolutions, which agrees with the theoretical analysis [56]. The results indicate that for the in version of tunnel lin- ing, the GPRIn vNet can take full use of the high-frequenc y information from the full wa veforms of GPR data [17], [58], and provide desirable resolution (slightl y larger than a quarter of the wa velength). Moreover , it was also found that when the vertical or horizontal distance between the two targets is less than a quarter of the wa velength, that GPRIn vNet cannot clearly distingui sh the two targets . V. E XPERIM ENTS ON R EAL D ATA The previous section demonstrated the superiority of the GPRIn vNet when synthetic data had been used. Howe ver , the question remain ed as to whether the GPRIn v Net was applicable to real data. It has been found that real GPR data is much mo re complex, and curr ently , there is no a vailable real data for training data-driven DNN models. In this section, a method was presented for g eneralizing the GPRInvNet trained using synt hetic data on real data. An experimental modelin g pr ocess was perfor med to validate the f easibility of the GPRIn vNet in such cases. Authorized licensed use limited to: SHANDONG UNIVERSITY. Downloaded on September 26,2021 at 07:58:20 UTC from IEEE Xplore. Restrictions apply. LIU et al. : GPRIn vNet: DEEP LEARNING-BAS ED GROUND PENETRA TING RADAR DA T A INVERSION 8321 Fig. 14. GPR B-Scan im ages from the experiments. (a) B-Scan images of the reb ars. ( b) B-Scan im ages of the water-bearing defect. (c) B-Scan im ages of the anhydrous defect. Fig. 15. B-Scan data with backgr ound noise patches. (a) and (b) T wo synthetic B-Scan data. ( c) and (d) T wo real background noises. (e) Synthetic B-Scan data of (a) w ith real background noise (c) added. (f) Synthetic B-Scan data of (b) w ith real background noise (d) added. A. Model T esting The performance results of the GPRIn vNet on real data were validated in this study using a m odel testing pro cess. A concrete experimental mode l with approximate dimensions of 4 × 2 × 0 . 7 m (l ength × width × height) was b u ilt, as shown in Fig. 13. The middle section of t he concrete model had not contained any defects and was referred to as a non-defect zone in this study . The remaining sections of the m odel were d i vided into several zones with approxim ate dimensions of 0 . 7 × 0 . 7 × 0 . 7 m for dif ferent experimental processes . Rebars, cracks, and voids were deployed in different zones of the concrete model. A hollo w acrylic box with the dimensions of 400 × 600 × 30 mm was used in the concrete to represent the anhydrous cracks [Fig. 13(a)]. A waterproof plastic box measuring 400 × 600 × 200 mm w as utilized as a void [Fig. 13(b)] , and filled with water to simulate water -bearing defects. Then, c rack defects were deployed on the superficial layer at a depth of approximatel y 20 cm. The simulated water-bearing defect s were placed on the bottom of the model. There were four rebars with diameters of 16 mm in the concrete model, which were located at intervals of approximately 15 cm. The distances between each of the defects were large enough to a void interferences from two signals, as well a s mitigate the im pacts of any movements which may occur during the pouring of the concrete. Three of the defects were at depths of approximat ely 15 cm, and the remaining defect was located at a depth of 20 cm. The experiments were carried out 41 days after the concrete model had been formed. This stud y utilized MALA Impu lse Radar with a central frequency of 600 MHz in the experiment al process to penetrate the concrete with a depth of 0.7 m, as shown in Fig. 13. The instrument inte grated an antenna with its logger and transmit- ted the recorded data via W iFi to a tablet PC. The data were displayed in real-time in the format of the B-Scan images. The logged data could als o be imported to a computer and further analyzed using pr ofessiona l software. In th is article, the sampling point was set as 512 under a “wheel” mode, and the trace interval was set as 0.02 m. B. Data Pr ocessing Due to the inhomogeneity of practical structures in which the detections were made, as well as the potential impact of noise under real en vironmental c onditions, the detected real GPR B-Scan was more complicat ed than the synthetic data. Moreover , the training of DNN models required a large amount of data pairs, including the real B-Scans and the corresponding permittivity m a ps. It is difficult to acquire these data p airs in real engineering, and there currently is no av ailable real GPR data set for tr aining th e DNN mode ls. In order to generalize the GPRIn vNet on real data, we employed the synthetic data inte grated with real background nois es for the purpose of data augmentati on. The GPR B-Scan data from the non-defect zone of the concrete experimental model were logged as the background noi se. Then, background noise Authorized licensed use limited to: SHANDONG UNIVERSITY. Downloaded on September 26,2021 at 07:58:20 UTC from IEEE Xplore. Restrictions apply. 8322 IEEE TRANSACTIONS ON GEOSCIENCE AND REMOTE SE NSING, V OL. 59, NO. 10, OCTOBER 2021 Fig. 16. Inv e rsion results of the experimental data. (a) Ground truth and inversion results of the concrete model with rebars only . (b) Ground truth an d in version results of the concrete model with water-bearing defects. (c) G round truth and in version results of the concrete model with the anhydrous d efect. of real data recorded from the concrete model were added into the synthetic B-Scan data for the purpose of training the GPRIn vNet. Therefore, in the present study’ s experiment, not only the B-Scan data with defects in the concrete were recorded but also those without any defects. The B-Scan data containing de fects were u tilized only for testin g p urposes, and the B-Scan containing background noise was employed in the training process of the GPRIn v Net. Prior to in tegrating the real data in to th e sy nthetic B-Scan data, preprocessing was performed on the real data. The p reprocessing included se veral operations, such as sta- tic corrections, direct component remov al, gain adjustments, background remov al, fi ltering, and av eraging. The B-Scan images for the rebars and defect s follo wing the preprocessing are sho wn in Fig. 14. The real B -Scan data which contai ned only background noise were also pre-processed. The direct component of the background noise was removed and interpol ation was employed to enlarge the tim e steps T of the real background noise data to 800. Then, a sliding windo w method was used to randomly crop the background noise patches. A total of 187 background noise patches with dimensions of 800 × 99 ( T × R ) were obtained at this step in the experimental process, as sho wn in Fi g. 15(c) and (d). Amplitude normali zation was then performed for both the background nois e patches and the synthetic data. During the normalizati on process , the maxim um amplitu des of t he B-Scan images were mul- tiplied by a weight coefficient which was randomly selected in the range of 0.5–2, in order to increase the div ersity of the data. Finally , the data of the normalized background noise patches and synthetic B-Scan images were added per pixel to form a new B-Scan with real background noise. By doing so, a ne w data set which contai ned a large amount of data pairs was generated. Compared with the synthetic B-Scan data, the B-Scan in this n ew data set contained the infor mation of background noises from the real en vironmental conditions. Therefore, the DNN models trained on this ne w data set may be applicabl e to the real GPR data in version. Fig. 15 depicts some of the B-Scans in the new data set with background noise s. The GP RIn vNet w as retrained on the new data set for 100 epochs. Then, by adding th e real background patches with synthetic d ata into the trainin g and validation data sets, this study expected that the GPRIn vNet would acquire new infor- mation, such as the inhomogeneity of the practical medium and the interference lev els of noise in the real environment. It should be noted that there were no real data included in the new training data set, and the GPRIn vNet was nev er trained using real data which depicted any hyperbolic echoes induced by the defects. C. Experimental Results and Analysis The retrained GPRInvNet was tested using the real B-Scan data of the defects. The perform ance results of the GPRInvNet, Enc-Dec, and FWI were then compared. This study’ s compar- ati ve result s pertaining to the different methods are show n in Fig. 16. The inv ersion results for the anhydrous cracks are Authorized licensed use limited to: SHANDONG UNIVERSITY. Downloaded on September 26,2021 at 07:58:20 UTC from IEEE Xplore. Restrictions apply. LIU et al. : GPRIn vNet: DEEP LEARNING-BAS ED GROUND PENETRA TING RADAR DA T A INVERSION 8323 presented in Fig. 16(a). Meanwh ile, Fig. 16(b) and (c) depicts the in version results for the rebars and water -bearing void, respecti vely . As can be seen in Fig. 16, the overall performance results of the GPR In vNet were s uperior to thos e of the Enc-Dec and FWI, ev en for the real data. The shapes of the rebars, anhydrous cracks, and water-bearing voids which had been in verted using GPRIn vNet were found to be almost identi- cal to the ground truths. For example, the GPRIn vNet had successfully recovered the locations and profiles of the four rebars [Fig. 16(a-4)]. On the contrary , the Enc-Dec had com- pletely missed the rebar layer [Fig. 16(a-3)], and FWI was only able to determine the approximate dist rib ution range of the rebars, rather than their s hapes [Fig. 16(a-2)]. In addi- tion, the water -bearing defect had well reconstructed by the GPRIn vNet, as shown in Fig. 16(b-4). How ev er , the Enc-Dec was only able to reconstruct a part of the defect, whil e the FWI had missed the water-bearing d efect on the bottom of the model. In regard to the anhydrous cracks, all three methods were observed to be capable of in verting the profile of those defects, as can be seen in Fig. 16(c), but the shapes of the crack reconstructed by GPRIn vNet were found to be closer to the true model. The GPRIn vNet had obvious ly outperformed the other two methods for the rebars and water-bearing defects. Although the boundaries of the in verted defects were slightly blurred due to the inhomogeneity of the concrete in the experiment, the GPRInvNet was still able to provide rough profiles for those common types o f d efects. It was determined through this st udy’ s experimental processes that the GPRIn vNet had provided the best over - all performance, especially in regard to the rebars and water -bearing defects. Moreover , the experimental results indi- cated that the GPRIn vNet trained only on synthetic data could be effecti vely generalized on real GPR data by adding real background patches into the traini ng data set. VI. C ONCLUSION In this article, a novel DNN-based architecture referred to as GPRIn vNet w as proposed for reconstructing high-quality rel- ati ve permittivity maps of tunnel linings from GPR data. The GPRIn vNet framework included a specially designed encoder for GPR data which was able to make full u se of the GPR recordings, as well as retain the spatial alignments between the B-Scan images an d th e permittivity maps. Theref o re, it was determined that the GPRInvNet had clear potential significance for impro ving the reconstruct ion of tunnel lining defects and asses sing the status o f complex defects in tunnel l inings. Furthermore, the network was also found to hav e the potential to be employed in the in version processes of GPR data in other GPR related applications , provided that suf ficient training data were made a vail able. The GPRIn vNet was first val idated based on synthetic GPR data. Then, the GPRInvNet w as successfully applied to reconstruct a permittivity map of tunnel linings contain- ing comple x defects with irregular geometric characteristics. It was determined to be capable of effecti vely reconstructing the dielectric properties and shapes of the most common types of tunnel lining defects, with clear boundaries observe d. This study’ s comparativ e results demonstrated that the GPRIn vNet had outperformed the exist ing baseline methods. The performance results of the GPRIn vNet were also ver- ified through real GPR data experiments . A method was introdu ced to tran sfer GPRIn vNet, which was first trained using only synthetic data, to real GPR data. The experimental results verified that the GPRInvNet was able to ef fectiv ely in vert the tunnel lining defects based on the real data, particu- larly the rebars and water-bearing defects. It was also revealed that the GPRIn vNet had generalized the real GPR data by adding some background GPR acqui sitions to the training data pool. Ho we ver , due to the complexity of the real GPR data, only rough profiles of the defects could be recons tructed. Also, this study did not perform va lidation experiment s using field experimental data, and these issues will merit further research in the future. R EFERENC ES [1] W . W .-L . L ai, X. Dérobert, and P . Annan, “ A re view of ground penetrating radar application in civ il engineering: A 30-year journe y from locating and tes ting to imaging and diagnosis, ” NDT E Int. , vol. 96, pp. 58–78, Jun. 2018. [2] Z.-L. Huang and J. Z hang, “D etermination of param eters of s ubsurface layers using GPR spectral inv ersion m ethod, ” IEEE T ran s. Geosci. Remote Sens. , vol. 52, no. 12, pp. 7527–7533 , Dec. 2014. [3] Q. Dou, L. W ei, D. R. Magee, and A . G. Cohn, “Real-time hyperbola recognition and fitting in GPR data, ” IEE E T r ans. G eosci. Remote Sens. , vol. 55, no. 1, pp. 51–62, Jan. 2017. [4] A. M. Alani and F . T osti, “GP R applications in structural detailing of a major tunnel using different frequency antenna systems , ” Construct. Building Mater . , vol. 158, pp. 1111–1122 , Jan. 2018. [5] F . J. Prego, M. Solla, X. N úñez-Nieto, and P . Arias, “ Assessing the applicability of ground-penetrating r adar to quality control in tunneling construction, ” J. Cons truct. Eng. Manage . , vol. 142, no. 5, May 2016, Art. no. 06015006. [6] N. E conomou et al. , “ Adv a nced ground penetrating r adar s ignal process- ing techniques, ” Signal P r ocess. , vol. 132, pp. 197–200 , Mar . 2017. [7] X. L. Tra vassos, S. L . A vila, and N. Ida, “ Artificial neural networks and m achine learning techniques applied to ground penetrating radar: Ar e v i e w , ” Appl. Comput. Informat. , Jul. 2020. [Online]. A vailable: https://www . emerald.com/insight/c ontent/d oi/10.1016 /j.aci .2018.10.001/ full/html, doi: 10. 1016/j.aci.2018. 10.001. [8] E. Menendez, J . G. V ictores, R. Monter o, S . Martínez, and C. Balaguer, “T unnel s tructural inspection and asses sment using an autonomous roboti c system, ” Autom. Constr uct. , vol. 87, pp. 117–126, Mar . 2018. [9] G. Parkinson and C. Ekes, “Ground penetrating radar ev aluation of concrete tunnel linings, ” in Pr oc. 12th Int. Conf. Gr ound P enetrating Radar , Birmingham, U.K. , vol. 11, J un. 2008. [Online]. A vailable: https://sewervue.com/papers/Park inson_E kes_Kapoor_Tunnel- GPR2008-compressed.pdf [10] D. Feng, X. W ang, and B. Zhang, “Specific ev aluation of tunnel lining multi-defects by all-refined GPR simulation method using hybrid algorithm of FET D and FD TD, ” Construct. B uilding Mater . , vol. 185, pp. 220–229 , Oct. 2018. [11] R. Montero, J. G. V ictores, S. Martínez, A. Jardón, and C. Balaguer , “Past, present and future of robotic tunnel inspection, ” Autom. Con- struct . , vol. 59, pp. 99–112, Nov . 2015. [12] A. Fedeli, M. Pastorino, and A. Randazzo, “ Advanced inversion tech- niques for ground penetrating radar , ” J. T elecommun. Inf. T echnol. , vol. 2017, no. 3, pp. 37–42, 2017. [Online]. A vailable: https://core. ac.uk/download/pdf/235205640.pdf, doi: 10.26636/jtit. 2017.119717. [13] E. Fisher , G. A . McMechan, and A. P . Annan, “ Acquisition and processing of wide-aperture g round-penetrating radar data, ” Geophysics , vol. 57, no. 3, pp. 495–504 , Mar . 1992. [14] G. A. Meles, J. V an der Kruk, S. A. Greenhalgh, J. R. E rnst, H. Maurer, and A. G. Green, “ A new vector waveform in version algorithm for simu l- taneous updating of conducti vity and permittivity parameters from com- bination crosshole/borehole-to-s urface GPR data, ” IEEE T rans. Geosc i. Remote Sens. , vol. 48, no. 9, pp. 3391–3407 , Sep. 2010. Authorized licensed use limited to: SHANDONG UNIVERSITY. Downloaded on September 26,2021 at 07:58:20 UTC from IEEE Xplore. Restrictions apply. 8324 IEEE TRANSACTIONS ON GEOSCIENCE AND REMOTE SE NSING, V OL. 59, NO. 10, OCTOBER 2021 [15] S. Liu, L . Lei, L . F u, and J. W u, “ Application of pre-stack reverse time migration based on FW I velocity estim ation to ground penetrating radar data, ” J. Appl. Geophys. , vol. 107, pp. 1–7, A ug. 2014. [16] J. D. Irving, M. D. Knoll, and R. J. K night, “Improving crosshole radar velocity tomogram s: A new appr oach to incorporating high-angle traveltime data, ” Geophysics , vol. 72, no. 4, pp. J31–J41, Jul. 2007. [17] J. van der Kruk et al. , “GPR full-wa v eform in version, recent devel- opments, and future opportunities, ” in Proc. 17th Int. Conf. Ground P enetrating Radar (GPR ) , Rapperswil, Switzerland, Jun. 2018, pp. 1–6. [18] S. Bus ch, J. van der Kruk, and H. V ereecken, “Improved characterization of fine-texture soils using on-ground GPR full-wav eform in version, ” IEEE T rans. G eosci. R emote Sens . , vol. 52, no. 7, pp. 3947–3958 , Jul. 2014. [19] I. Giannakis, A. Giannopoulos , and C. W arren, “Realistic FDTD GPR antenna models optimized using a novel linear/nonlinear full- wa veform in v ersion, ” IEEE T r ans. G eosci. Remote Sens. , vol. 57, no. 3, pp. 1768–1778 , Mar . 2019. [20] X. Y ang, J. va n der Kruk, J. Bikowski, P . Kum bhar , H. V ereecken, and G. A. Meles , “Full-waveform in version of GPR data in frequency- domain, ” in Pr oc. 14th Int. Conf. Ground P enetrating R adar (GPR) , Shanghai, China, Jun. 2012, pp. 324–328 . [21] A. T arantola, “In v ers ion of seism ic reflection data in the acoustic approximation, ” Geophysics , vol. 49, no. 8, pp. 1259–1266 , Aug. 1984. [22] A. V an, D. C. L . W i elen, and F . Nguyen, “Detection of defects in concrete with ground penetrating radar, ” in Proc. Eur . Symp. P olym. Sustain. Constr uct. (E SPSC) , W arsaw ., P oland, 2011, pp. 221–225 . [23] Q. Ren, “Inv erts perm itti vity and c onductivity w ith structural constraint in GPR FWI based on truncated Newton method, ” J . A ppl. Geophys . , vol. 151, pp. 186–193 , Apr . 2018. [24] D. Feng, X. W ang, and B. Zhang, “I mproving reconstruction of tunnel lining defects from ground-penetra ting radar profiles by m ulti-scale in version and bi-parametric full-wav eform inv ersion, ” Adv . Eng. Infor - mat. , vol. 41, Aug. 2019, Art. no. 100931 . [25] F . Z hang et al. , “ Application of ground penetr ating radar to detect tunnel lining def ects bas ed on improved full wav eform inversion and reverse time migration, ” Near Surf. Geophys. , vol. 17, no. 2, pp. 127–139 , Feb . 2019. [26] Y . L eCun, Y . Bengio, and G. E. Hinton, “Deep learning, ” Nature , vol. 521, no. 7553, pp. 436–444 , May 2015 [27] K. Is hitsuka, S. Is o, K. Onishi, and T . Matsuoka, “Object detection in ground-penetrating radar im ages us ing a deep con volutional neural network and image s et preparation by migration, ” Int. J. Geophys. , vol. 2018, Nov . 2018, Art. no. 9365184. [28] S. Ren, K. He, R. Girshick, and J . Sun, “Faster R-CNN: T owards real-time object detection with region proposal networks, ” IEEE T ran s. P attern Anal. Mach. Intell. , vol. 39, no. 6, pp. 1137–1149 , Jun. 2017. [29] X. Miao, J. W ang, Z. W ang, Q. Su i, Y . Gao, and P . Jiang, “ Automatic recognition of highway tunnel defects based on an improved U-Net model, ” IE EE Sensors J. , vol. 19, no. 23, pp. 11413–11423 , Dec. 2019. [30] P . J iang, F . Gu, Y . W ang, C. Tu, and B. Chen, “Difnet: Semantic segmentation by diffusion networks, ” in Proc. Adv . Neural Inf. Process. Syst. Red Hook, NY , USA: Curran A ssociates, 2018, pp. 1630–1639 . [31] I. Goodfellow et al. , “Generative adversarial nets, ” in P r oc. Adv . Neural Inf. Pr ocess. Syst. , 2014, pp. 2672–2680 . [32] V . Das, A . P ollack, U . W ollner , and T . M ukerji, “Conv olutional neural network for seismic impedance inv e rsion, ” in P r oc. SEG T ech. Progr am Expanded Abstr . , Anaheim, CA, USA, Aug. 2018, pp. 2071–2075 . [33] M. Araya-Polo, J. Jennings, A. A dler, and T . Dahlke , “Deep-learning tomography , ” Lead. E dge , vol. 37, no. 1, pp. 58–66, Jan. 2018. [34] M. Alfarraj and G. AlRegib, “Sem i-s upervised learning for acoustic impedance in v ers ion, ” 2019, . [Online] . A v ailable: http://arxi v . org/abs/1905.13412 [35] Z. Zhang, Y . Wu, Z. Z hou, and Y . Lin, “V elocityGAN: Subsurface velocity image estimation us ing conditional adversarial networks, ” in Proc. IEE E W inter Conf. A ppl. Comput. V is. (W ACV) , W aikoloa Village, HI, USA, J an. 2019, pp. 705–714 . [36] Y . W u, Y . Lin, and Z. Zhou, “InversionNet: Accurate and efficient seismic waveform inv er sion w ith co n volutional neural networks, ” in Proc. SE G T ech. Pro gr am Expanded Abs tr . , Aug. 2018, pp. 2096–2100 . [37] S. Li et al. , “Deep-learning inv ersion of s eismic data, ” IEEE T ra ns. Geosci. Remote S ens. , vol. 58, no. 3, pp. 2135–2149 , Mar . 2020. [38] M.-T . Pham and S. L efe vre, “Buried object detection from B-scan ground penetrating radar data us ing faster-RCNN, ” in Pr oc. IEEE Int. Geosci. Remote Sens. Symp. (IGAR SS) , V alencia, Spain, Jul. 2018, pp. 6804–6807 . [39] K. Dinh, N. Gucunski, and T . H. Duong, “ An algorithm for automatic localization and detection of rebars from GPR data of concrete bridge decks, ” Autom. Construct. , vol. 89, pp. 292–298 , May 2018. [40] X. Xu, Y . L ei, and F . Y ang, “Railway subgrade defect automatic recognition m ethod based on improved faster R-C NN, ” Sci. Pro gram. , vol. 2018, pp. 1–12, Jun. 2018. [41] Z. T ong, J. Gao, and H. Zhang, “Recognition, location, measure- ment, and 3D reconstruction of concealed cracks using con volutional neural networks, ” Constr uct. Building Mater . , vol. 146, pp. 775–787 , Aug. 2017. [42] J. K. Alv arez and S. Kodagoda, “ A pplication of deep learning image- to-image transformation networks to GPR radargrams for sub-surface imaging in infrastructure m onitoring, ” in Pr oc. 13th I EEE Conf. Ind. Electron. Appl. (ICIEA) , Wuhan, China, May 2018, pp. 611–616 . [43] P . Is ola, J. -Y . Zhu, T . Zhou, and A. A. Efros, “Image-to-im age trans- lation with conditional adversarial networks, ” in Pro c. IEEE Conf. Compu t. V is. P att ern Reco gnit . (CVPR) , Honolulu, HI, USA, Jul. 2017, pp. 5967–5976 . [44] O. Ronneberger , P . Fischer , and T . Brox, “U-net: Conv olutional networks for biomedical image segmentation, ” in Pr oc. Med. Image Comput. Comput .-Assist. Interve nt. , 2015, pp. 234–241 . [45] B. Liu et al. , “Deep learning inv ersion of electrical resis tivity data, ” IEEE T rans. G eosci. R emote Sens. , vol. 58, no. 8, pp. 5715–5728 , Aug. 2020. [46] Z. W ang, E. P . Simoncelli, and A. C. Bovik, “Multiscale structural similarity for image quality as sessm ent, ” in Proc. 37th Asilomar Conf. Signals, Syst. Comput. , vol. 2, 2003, pp. 1398–1402 . [47] J. L. Davis and A. P . Annan, “G round-penetrating radar for high- resolution mapping of so il and rock stratigraphy , ” Geophys. P r ospecting , vol. 37, no. 5, pp. 531–551 , 1989. [48] J. K. Huang, T . Jia, D. E. Carlin, and T . Ideker , “pyNBS: A Python implementation for network-bas ed stratifi cation of tumor mu tations, ” Geophys. Prospecting , vol. 34, no. 16, pp. 2859–2861 , Aug. 2018. [49] Z. W ang, A. Bovik, H. Sheikh, and E. Simoncelli, “Im age quality assess ment: From err or m easurement to structural s imilarity , ” IEEE T rans. I mag e Process. , vol. 13, no. 4, pp. 600–612 , Apr . 2004. [50] F . Lavoué, R. Brossier, L . Métivie r , S. Garambois, and J . V irieux , “T wo- dimensional permittivity and conduc tivity imaging by full waveform in version of multioffset GP R data: A frequency-domain quasi-Newton approach, ” Geophys. J. Int. , vol. 197, no. 1, pp. 248–268, Apr . 2014. [51] P . Annan, Gr ound P enetrating Radar Principles, P r o cedures and Applications . Mississauga, MI, Canada: S ensors Softw ., 2003, ch. 4, pp. 71–74. [Online]. A va ilable: https://us9060. scholar .eu. org/ extdomains/books.google.com /books/about/Pro specci %C3%B3n_ geof %C3%ADsica_de _alta_resoluci.html?id=t4GYOwAA CAAJ [52] E. Lorenzo, “Pros pección geofísica de alta resolución mediante GeoRadar . Aplicación a obras civiles, ” Ph.D. disser tation, D ept. Laboratorio de Geotecnia del CEDE X, Com plutense de Madrid Uni v ., Madrid, S pain, 1996. [O nline]. A vailable: https://us9060. scholar . eu.org/ extdomains/books.google.com /books/about/Pro specci %C3%B3n_ geof %C3%ADsica_de _alta_resoluci.html?id=t4GYOwAA CAAJ [53] D. J. Daniels, D. J. Gunton, and H. F . Scott, “Introduction to subsurface radar , ” IEE Pr oc. F Radar Signal Process. , vol. 135, no. 4, pp. 278–320 , Aug. 1988. [54] C. Dong, C. C. Loy , K. He, and X. T ang, “Image super-resolution using deep conv olutional networks, ” IEE E T rans. P atter n A nal. Mach. Intell. , vol. 38, no. 2, pp. 295–307 , Feb. 2016. [55] J. K im, J. K. Lee, and K. M. Lee, “ Accurate image super-resolution using very deep convolutional n etworks, ” in Proc. IEEE Conf. Com- put. V is. P atte rn Recog nit. (CVPR) , Seattle, W A , US A, Jun. 2016, pp. 1646–1654 . [56] V . Pérez-Gracia, R. G onzález-Drigo, and D. Di Capua, “Horizontal resolution in a non-destructiv e shallow G PR survey: An experimental e v aluation, ” ND T E Int. , vol. 41, no. 8, pp. 611–620, Dec. 2008. [57] T . Z iani, D. T eguig, M. A. T akkouc he, X . Derobert, and M. Benslam a, “GPR modelling applied to vertical and hor izontal resolution of buried objects, ” in Pr oc. Int. Conf. Electroma gn. Adv . Appl. , Sep. 2011, pp. 1–4. [58] X. Feng, Q. Ren, and C. L iu, “Quantitative imaging for ci vil engi- neering by joint full waveform in version of surface-based GPR and shallow seismic refl ection data, ” Construct. Building Mater . , vol. 154, pp. 1173–1182 , Nov . 2017. [59] I. Nicolaescu, “Improv em ent of stepped-freque ncy continuous wa ve ground-penetrating radar cross-range resolution, ” IEEE T rans. Geosci. Remote Sens. , vol. 51, no. 1, pp. 85–92, Jan. 2013. [60] N. Ricker, “The form and laws of propagation of s eismic wavelets, ” Geophysics , vol. 18, no. 1, pp. 10–40, J an. 1953. [61] Y . W ang, “Frequencies of the ricker wa v elet, ” Geophysics , vol. 80, no. 2, pp. A31–A37, Mar . 2015. Authorized licensed use limited to: SHANDONG UNIVERSITY. Downloaded on September 26,2021 at 07:58:20 UTC from IEEE Xplore. Restrictions apply. LIU et al. : GPRIn vNet: DEEP LEARNING-BAS ED GROUND PENETRA TING RADAR DA T A INVERSION 8325 Bin Liu received the B. S. degree and the P h.D. degree in civil engineering from S handong Uni- versity , Shandong, China, in 2005 and 2010, respectively . He then joined the Geotechnical and Structural Engineering R esearch Center, S handong Univ ers ity , where he is a Profes sor with the School of Qilu Transportation. His res earch area is engineering geophysical pros pecting techniques, especially their applications in tunnels. Dr . Liu is a member of Society of E xploration Geophysicists (SEG) and Internati onal Society for Rock Mechanics and Rock Engineering (ISRM). He serves as a Council Member for the Chinese Geophysical Society . Y u xiao Ren receiv ed the bachelor’ s degree in mathematics from Shandong Univ ersity , Shandong, China, 2014, and the master’ s degree in m athemat- ics from Loughborough Uni versity , Loughborough, U.K., in 2015. He is pursuing the Ph.D. degree in ci vil engineering with Shandong Univ ersity . He joined Shandong Uni versity and has been studying for his doctoral degree in ci vil engineering since 2016. He is a V isiting Scholar with the Georgia Institute of T echnology , under the supervision of Prof. F . Herrmann. His research interests include seismic modeling and imaging, full-wav e form in version and deep learning- based geophys ical inversion. Hanchi Liu received the B.E . degree in inform ation and electrical engineering from Shandong Jianzhu Uni v ers ity , S handong, China, in 2019. She is pur- suing the master’s degree with the School of Con- trol Science and Engineering, Shandong University , Shandong, China. Her res earch interests include defects recognition and deep learning-bas ed geophysical inv ersion. Hui Xu r ecei v ed the m aster’ s de gree with Qilu Transportation, Shandong Univ ersity , Shandong, China, in 2019. He is working on 3-D object reconstruction. Zhengfang W ang receive d the Ph.D. degree in mea- surement technology and automatic instrument from Shandong Univ ers ity , S handong, China, in 2014. He is an Associate Professo r with the School of Control Science and Engineering, Shandong Univ er- sity . His research inter ests include GPR data pr ocess- ing, detection and diagnosis of infrastructures and optic fiber sens ors for infrastructures monitoring. Anthony G. Cohn is a Full Profess or with the School of Computing, Univ ers ity of Leeds, Leeds , U.K. , and a Fellow with the A lan Turing Ins titute, U.K. He is a Fellow of the Royal Academy of Engineering, the Association for Advancement of Artificial Intelligence, and the European As sociation for Artificial Intelligence. His resear ch interes ts are in artificial intelligence, knowledge repres entation and reasoning, cogniti ve vision, robotics, s ensor fusion, and decision support system s. Since 2014, part of his research has focused on decision support systems for streetworks and utilities. The V A U L T system which provides 24/7 real-tim e integrated utility data across Scotland arising from his Mapping the Underworld and V IST A projects won an IET Innovation A ward and an NJUG A ward for A voiding Damage. Mr . Cohn has received the Distinguished Service A wards from IJCA I and AAAI. Peng Jiang (Me mber , IEEE) r ecei ved the B. S. and Ph.D. de grees in computer science and technol- ogy from Shandong Uni versity , Shandong, China, in 2010 and 2016, respectiv ely . He is a Research Assistant with the School of Qilu Transportation, Shandong Uni versity . He has authored or coauthored many w orks on top-tier venues, including ICCV , NeurIPS(NIPS), the IEEE T RANSACTIONS ON I MAGE P R OCESSING (TIP), and the IEEE T RANSACTIONS ON G EOSCI ENCE AND R EMOTE S ENSING ( T G R S ) . He is f ocusing on deep learning-based geophysical in v e rsion. His research spans various areas, including computer vision, im age processing, machine learning, and deep learning. Authorized licensed use limited to: SHANDONG UNIVERSITY. Downloaded on September 26,2021 at 07:58:20 UTC from IEEE Xplore. Restrictions apply.
Original Paper
Loading high-quality paper...
Comments & Academic Discussion
Loading comments...
Leave a Comment