Decoding Imagined Speech and Computer Control using Brain Waves
In this work, we explore the possibility of decoding Imagined Speech brain waves using machine learning techniques. We propose a covariance matrix of Electroencephalogram channels as input features, projection to tangent space of covariance matrices …
Authors: Abhiram Singh, Ashwin Gumaste
Decoding Imagined Speech and Computer Control using Brain W a ves Abhiram Singh ∗ , Ashwin Gumaste Department of Computer Science and Engineering, Indian Institute of T echnology Bombay , India Abstract Backgr ound . In this work, we explore the possibility of decoding Imagined Speech (IS) brain wa v es using machine learning techniques. Appr oac h . W e design two finite state machines to create an interface for controlling a computer system using an IS- based brain-computer interf ace. T o decode IS signals, we propose a covariance matrix of Electroencephalogram channels as input features, covariance matrices projection to tangent space for obtaining vectors from matrices, principal component analysis for dimension reduction of v ectors, an artificial neural network (ANN) as a classification model, and bootstrap aggregation for creating an ensemble of ANN models. Result . Based on these findings, we are first to use an IS-based system to operate a computer and obtain an information transfer rate of 21-bits-per-minute. The proposed approach can decode the IS signal with a mean classification accuracy of 85% on classifying one long vs. short word. Our proposed approach can also di ff erentiate between IS and rest state brain signals with a mean classification accuracy of 94%. Comparison . After comparison, we show that our approach performs equiv alent to the state-of-the-art approach (SO T A) on decoding long vs. short word classification task. W e also sho w that the proposed method outperforms SOT A significantly on decoding three short words and vo wels with an av erage mar gin of 11% and 9%, respectively . Conclusion . These results show that the proposed approach can decode a wide variety of IS signals and is practically applicable in a real-time en vironment. K e ywor ds: Brain-Computer Interface, Imagined Speech, Artificial Neural Network, Electroencephalogram, Finite State Machine. 1. Introduction Brain-Computer Interface (BCI) is a combination of hard- ware (used to capture brain signals) and software (to analyze and understand di ff erent cognitiv e tasks). Research in BCI is getting popular to study human behavior , diagnose brain dis- eases, and utilize as a human-computer interface (HCI) device. A BCI system can be seen as a replacement for existing tech- nologies such as a touch screen, mouse, or keyboard. Man y BCI systems utilize di ff erent paradigms such as P300 or motor imaginary for Human-Computer Interaction [1], [2]. Imagined Speech : V arious activities generate electrical sig- nals from the brain. Imagined speech (IS) or speech imaginary [3] is one such class of brain signals in which the user speaks in the mind without explicitly moving any articulators. IS is di ff erent from silent speech, in which a user thinks to move articulators during the imagination of words. Hence, silent speech is likely to generate signals from the brain’ s motor cor- tex, whereas IS generates the signals from Broca’ s and W er- nicke’ s areas [4], [5]. Electr oencephalo graphy : There exist di ff erent techniques to capture electrical signals from the brain. Electroencephalog- raphy (EEG) [6] is one such widely used technique that in- volv es placing electrodes over the scalp in a non-in v asi v e fash- ∗ Corresponding author Email addr esses: abhiram25.1990@gmail.com (Abhiram Singh), ashwin@ashwin.name (Ashwin Gumaste) ion. These electrodes capture voltage di ff erences generated due to ion mov ement along the brain neurons. These measurements are obtained ov er a time period to form an EEG signal. The number of electrodes can vary from sparse (just 1) to dense (256), determined based on the application requirements. The EEG signal requires preprocessing steps (e.g., band-pass filter- ing, artifacts remo v al) before e xtracting the useful information. After the noise remov al, relev ant features (temporal, spectral, and spatial) are extracted from the EEG signal and provided as an input to a classifier . The classifier categorizes input features into one of the classes, where each class represents an imagined task. EEG signal decoding : T o automate the preprocessing and features extraction steps with the EEG signal classification, Lawhern et al. [7] proposed a deep con v olutional neural net- work ( EEGNet ). The performance of EEGNet was ev aluated on four datasets, where each dataset represents a di ff erent BCI classification task. T o extract both spectral and temporal fea- tures of the EEG signal, W ang et al. [8] proposed CNN and RNN based deep learning model for decoding the imagined speech signals on the synthetic EEG data. Similarly , Bashi van et al. [9] proposed a recurrent-con volution-based deep learning model for preserving temporal, spatial, and spectral information present in the EEG signal. In a similar work, Zhang et al. [10] proposed a combination of conv olution and recurrent model (in- terconnected in a cascade and parallel f ashion) for decoding the EEG signals. In the context of machine learning techniques, Pr eprint submitted to JNM May 3, 2021 Nguyen et al. [11] proposed features from tangent space with relev ance vector machine. T omioka et al. [12] utilized a com- mon spatial pattern to extract log-v ariance features of the EEG signal with the linear discriminant analysis as a classification model. In a similar work, Dasalla et al. [13] applied a com- mon spatial pattern with the support vector machine to classify the EEG signals. Min et al. [14] utilized statistical features as an input to the extreme learning machine for decode the EEG signals. Pr oposed work : This paper focuses on the design, implemen- tation of an IS-based BCI system, and classification of EEG- based IS signals. The reason behind using IS signals in BCI is because the speech-based system is much f aster, expected to take less training time, pro vides more comfort than motor imag- inary tasks, and leads to a natural way of HCI [15]. Therefore, IS signals may lead to an overall improved user experience in computer interaction. The w ork in this paper assumes that the data is not fully corrupted with noise. Subjects participating in IS experiments are instructed to follow specific guidelines, making this assumption feasible (though this may not always be true in a real-life scenario). So, there is a possibility of extract- ing useful information related to the imagined speech and, after that, decode the signal. The proposed work aims to identify the discriminativ e features and a classification model that im- prov es decoding performance on di ff erent IS tasks and is rob ust to noise. Based on experimental results, we propose T angent Space (TS) [16] as input features to an Artificial Feed Forward Neural Networks (ANN) [17] model. Results : W e tested one IS-based computer control design in a partial online setting and obtained an information transfer rate (ITR) of 21 bits / minute. F or decoding the IS signal, our pro- posed approach improves the mean classification accuracy from 49.3% to 60.35%, 49.2 % to 58.61%, 66.56% to 69.43%, and 73.27% to 78.51% on three short words, three v o wels, tw o long words, and one long vs. one short word classification tasks re- spectiv ely , from the state of the art. Pr oblem Statement : Gi ven an EEG signal, we desire to iden- tify whether it belongs to an imagined speech category . If so, then we desire to decode the actual, imagined word or w ord cat- egory . Subsequently , we want to use the decoded information to take appropriate action for computer interaction. Contribution : Our work leads to the follo wing contributions: 1. W e propose an FSM to operate the computer system by using only IS signals. Thereafter , we de velop a new and simple graphical user interface (GUI) corresponding to the FSM for user interaction with the system. T o the best of our kno wledge, this is the first-e ver approach for general- purpose computer control, which is based only on the IS signals. W e discuss two FSM designs for binary classi- fication tasks using IS signals and then focus on sev eral improv ements to build a fully functional system that can work in a real-time (online) setting. For demonstration, we simulate an FSM design on a publicly a vailable dataset and obtain an ITR of 21-bits-per minute. 2. W e consider the aspect of generalization of neural net- works (NN) on IS signals. W e identify i) The cov ari- ance matrix as the most useful discriminative feature; ii) T angent Space (TS) as discriminativ e information preser- vati ve transformation of the covariance matrix to vectors; iii) PCA as a dimension reduction technique; iv) Artificial Neural Network (NN) as the most successful classification model with boot-strap aggregation (bagging) for combin- ing the output of multiple NN. Results confirm that our proposed approach improv es the classifier performance significantly ov er the existing machine learning and two baseline deep learning models (conv olutional neural net- work (CNN) and recurrent neural network (RNN). 3. W e sho w that the proposed approach can discriminate IS- based EEG signals from participant’ s rest state EEG sig- nals. This step helps to eliminate non-IS signals. P aper or ganization : This paper is org anized as follo ws. Sec- tion 2 describes the user interface designs and pipeline for an IS based real-time BCI system for computer control. Section 3 provides the dataset details and describes the proposed ap- proach for feature extraction and classification. Section 4 shows the results of the proposed approach and comparison with deep learning and machine learning models. Section 5 provides dis- cussion, related work and conclusion. 2. Imagined speech for computer interaction In this section, we provide design and implementation details of the imagined speech-based computer interaction system. W e propose two designs: 1) creating a new Graphics User Inter- face (GUI) to click anywhere on a computer screen; 2) a design that utilizes Arro w , Enter , and Backspace keys of a ke yboard to perform corresponding actions on a computer . 2.1. Design T o control a computer , the first requirement is to locate de- sired content displayed on a computer screen. So there must be some provision with which a user can reach the tar get loca- tion. Currently , this step is the mov ement of a mouse sho wn as a change in the cursor position on the screen. A keyboard may also be used by using the T ab or arro w keys to reach the target. Since cursor control requires continuous input from the user , and the imagined speech classifier provides a discrete output; therefore it does not make sense to control continuous move- ment using discrete steps. Hence, the type of classifier output (continuous or discrete) must be considered in the design. 2.1.1. Assumption The binary classifier is used for imagined speech decoding. This assumption is due to simplicity in GUI demonstration and high classification accuracy obtained by the binary classifier (§4) on the dataset (3). Also, the classifier is trained such that the 0 output corresponds to a short word, and the 1 output cor- responds to a long word. These assumptions can be relax ed by increasing the classifier performance on the multiclass classifi- cation problem. 2 (a) (b) Figure 1: (a) State diagram 1 of computer control application. This FSM design can be used to click anywhere on a computer screen. In the cr op or switch state, a user has an option to select one of the cr op r ectangle or switch states by thinking of a short or long word. In the cr op rectangle state, the user narrows down the visible rectangular window and in the switch state, the user can switch the rectangular window either for double click operation (thinking a short word) on a folder or recreate a rectangle from the previous crop operation (thinking a long word). (b) State diagram 2 of computer control application. This FSM design is used to navigate within a file system. In the figure, p, w and stands for a short word, long word, and transition without user input. 2.1.2. F irst design In the first design of FSM (Figure 1a), we propose the fol- lowing steps in each iteration to open a folder currently being displayed on the screen. 1) W e obtain the screen resolution and create a rectangular window with partial transparenc y of the same size as that of the screen resolution. W e then divide the current rectangle into two halves (as shown in Figure 2a). If the length is greater or equal to the breadth, then we di vide the rectangle along the length, otherwise divide the rectangle along the breadth. 3) W e then display one short word on one half of the rectan- gle and one long word on the other side of the rectangle. For consistency , if the rectangle is divided along its length, then the short word is always displayed on the left part of the rectangle, and the long word is always displayed on the right part of the rectangle. Similarly , if the rectangle is divided along its breath, then the short word is displayed on the top part, and the long word is displayed on the lower part of the rectan gle. The short and long w ords are chosen randomly from their respecti ve sets. 4) A display response is used for ensuring that the user starts thinking of either the short or long w ord in a giv en time-interval leading to the capture of the corresponding brain signals. A response is provided by sho wing one textbox for each rectangle and a textbox specifies a word to be imagined. For example, if the rectangle is di vided vertically , then a short word is displayed on the left part, and a long word is displayed on the right part of the rectangle. The user imagines either a short or long word by looking at the part of the rectangle under which the target folder is located. 5) After capturing the IS signal, it is pre-processed, features are extracted and gi ven to the classifier to decode the word imagined by the user . If a classifier generates an output of 0 then, the rectangle part (either right or bottom) representing a long word is remo ved. In contrast, if the output is a 1 then, the rectangle part (either left or top) corresponding to a short word is remov ed. 6) Steps 2-5 are repeated until the rectangle becomes small enough to co ver the folder entirely . At this stage, the user needs to switch the window and double-click on the folder . How- ev er, until this stage, the system only recognizes one action: to crop the current window to reach a target location. T o intro- duce another action in the design, at the starting of each step, two options are displayed to the user . The first option asks a user to go to the crop state, whereas the second option ask for a switch state. A user selects the crop action by thinking of a short word, and this leads to the system state where all the abov e-defined steps 1-5 can be performed. 7) A user can select the switch option by thinking of a long word. If at a switch state, the user at any time thinks of a short word then the system switches the window and double clicks the folder behind the current rectangle. Thereafter, the system resets its state, the rectangle is set to the full-screen resolution, and the whole process restarts to select a di ff erent folder . How- ev er, if the classifier made a mistake on the pre vious crop, the user can go to a switch state, think of a long w ord to recreate the last crop’ s rectangle, and go to the crop rectangle state again. 2.1.3. Second design The second design (shown by an FSM in Figure 1b) con- verts user imagined speech into the ke yboard actions. Here we demonstrate one application to utilize a tree file directory struc- ture. The tree structure can be di vided into multiple le vels, with a root at the top and leav es at the bottom. A file in the system represents a tree leaf, and the root is the top level directory of the computer system. Initially , a user decides to open a par- ticular file in the computer system. Then computer control is shifted to the root of a directory tree. There might be multi- ple directories at the root. So the first among them is selected. Based on the tar get file location, the user can either na vigate at the same lev el of the tree or go a le vel down. T o achie ve this, a user imagines of one short word to change the system state from A to B (see Figure 1b). In-state B, the user can either move in the same directory lev el or go one lev el down. A user can think of a short word to go one le vel down along the directory tree 3 (a) (b) Figure 2: (a) The first di vision of rectangle from crop action. T o open a folder in the blue box, the user thinks of one long word so that the right part of the rectangle is selected and the left part is cropped. (b) The second di vision of rectangle from crop action. T o open a folder in the blue box, the user thinks of one short word so that the top part of the rectangle is selected and the bottom part is cropped. hierarchy . This user’ s imagined speech is con verted into action corresponding to pressing an Enter key . In another case, a user can think of a long word to switch state from B to C and navig ate in the same directory le vel by thinking of a short w ord for selecting the right arro w and a long word for choosing the do wn arro w . Then the system goes to state A. It is possible that the classifier has made a mistake or that the user wants to go up the directory tree. Hence, in the state A, a user thinks of a long word to change state from A to D and thinks of a short word to rev ert to the pre vious action or a long word to go a level up in the tree. In this w ay , this design provides na vigation among directories in the computer system and provides a simple way for computer interaction. If a user is in state C and thinks either a short or long word to move in the same directory , then corresponding action (move right or bottom in the same hierarchy) is performed by the sys- tem. After performing the action, system transition occurs from state C to A without taking any input from the user, which is represented by the transition in the Figure 1b. Similarly in state D, if the user thinks of a short or long word, then corre- sponding action (undo the previous action in the same le vel or mov e one lev el up in hierarchy) is performed and the system state is changed from D to A without taking any input from the user (denoted by transition). 2.1.4. Design specifics T wo designs presented here alternate between user input for 1 second and user rest state for 1 second. Here the maximum time is consumed in taking user input. Another 1 second is taken so that the user can decide to navigate within a directory . After waiting for the initial 1 second, the system pre-processes the signal, extracts useful features, classifies it to one of the cate- gories, and takes appropriate action according to both: the clas- sifier output and design implementation (design1 or design2). All the processing steps can be performed in milliseconds by the computer except for taking the user input. 2.2. Implementation Details GUI implementation (design1) for displaying rectangles is performed using the Tkinter library in Python. Before starting the GUI, we train the classifier on the training data (as discussed later in §3). In this implementation, 60% of the dataset was used for training the model parameters, and then the remaining 40% of the data was used during the testing state. At the starting of each step, the system displays an option to select between crop and switch action and then alert the user to start thinking. The system then w aits for 1 second to capture the EEG recording. In the partial-online analysis, a user clicks using the mouse in one part of the rectangle to select between a short and long word. After that, one trial of either short or long word from test data is selected at random. Selection from test data is based on the location of the click in the rectangle. If the location of the click is inside the top or left part of the rectangle, then a random test trial from the set of short words is selected. Otherwise, a random test trial from the set of long words is selected. Finally , the EEG signal is then pre-processed, transformed, and finally decoded by the classifier . All these steps are also repeated for taking inputs for the other states of FSM. Figure 2 shows the display , rectangle division, and the target folder Downloads (in blue) by two repeated crop actions. By cropping the rectangle, the user reaches the tar get location and selects the switch window option to double click on the desired folder . The window in which the rectangle is shown has been kept partially transparent so that the user can visualize the target folder’ s location and crop the rectangle accordingly . 2.2.1. GUI Design Considerations Many techniques can improve GUI performance as this de- sign pro vides only a starting point for creating a real-time com- puter control system using imagined speech. 1) Dividing the rectangle into multiple parts instead of two. A higher number of divisions imply that each step reduces the rectangle size by k instead of 2. For example, if k = 4 then, this new method is twice faster than the method with k = 2. Howe ver , a higher value of k requires a high accuracy of the multiclass classifier . 2) When a classifier performs misclassification, then care has to be taken to circumv ent this situation. For this situation to be rectified, the switch option is preferred. If a user detects that the last crop was incorrect, then in the ne xt step, the user decides to switch to the previous rectangle. The switch action re generates the previous rectangle, and the user can crop the rectangle in 4 Figure 3: Pipeline for computer control using IS signals. the next step. 3) Prior to each crop with crop / switch state, the decision to crop or switch can be skipped for k steps, and the v alue of k can be decreased with each decision. 4) This design considers only opening a folder by perform- ing a double mouse click operation. Other options can also be provided for feature enhancement, such as a single mouse click, right-click of a mouse, and then creating a new window dictated from the size of the right-click menu. These features take the BCI system tow ards practical realization. 5) This implementation is done in the Linux Operating Sys- tem (OS), which means a few components are OS-dependent. Implementations can be made OS independent or developed for multiple operating systems. 2.3. BCI Pipeline Based on the proposed approach, we can design a BCI sys- tem that identifies the rest state brain condition from the IS condition. If the brain signal corresponds to the IS condition, then it can decode the target word. Here, we have two mod- ules performing two di ff erent categorization tasks. Similarly , a BCI system has other components related to artifact detec- tion / remov al and for OS interaction. By combining all the com- ponents, we propose a data flow framew ork of the IS-based BCI system (Figure 3). This frame work is essential for the real-time functioning of the IS-based BCI system. The detail of each component is as follows. After reading brain signals from the EEG device, it is neces- sary to identify whether the gi ven signal is corrupted from the noise. If the signal is not corrupted, then the useful frequency components are extracted. After that, the filtered signal is ex- amined to identify if the IS components are present within the signal. If the IS components are present, then the useful fea- tures are extracted, and the classification model is built to de- code the imagined word. If the signal is noise corrupted, then a noise remo val technique or signal reconstruction should be per- formed. A noisy signal also triggers the word prediction model. This model works based on the word’ s history . The classifier and word prediction model outputs are compared to identify the most probable word. This word is then mapped to the intended user action. Action is mapped to an application program inter- face (API). The API on ex ecution changes the current state of the computer system. The modified system state again asks the user for some input and provides a ne w way of brain-computer interaction. As sho wn in Figure 3, we have implemented pro- cesses inside red boxes. Implementation of the processes inside green-colored boxes is left as a future work. 3. Dataset Details and Decoding Imagined Speech Signal In this section, we first provide details of the experiment and dataset. Thereafter, we describe the proposed approach for de- coding the EEG-based IS signals. 3.1. Experiment and dataset details Nguyen et al. [11] experimented with IS-related brain sig- nals using an EEG device. Authors divided the experiment into four tasks namely short w ords { in , out , u p } , v o wels { a , i , u } , long words { ind e pend ent , coo perat e } and short vs. long word { in , coo per ate } . Experiment : In each experiment, subjects focus on a com- puter screen to receiv e the visual cue about the word to be imag- ined along with periodic beeps indicating the start of imagina- tion. Each trial consists of 7 periods of T seconds. Starting 4 periods consists of the visual cue with audio to imagine the word while the last three periods include only visual cue for imagined speech. The trial ended with 2 seconds of rest state condition without any beep sound or visual cue. Audio helped the subjects to estimate periodic interv als for imagining the pro- nunciation of vo wels / words after the completion of 4 periods. For vo wels and short words, T is 1 second, and for long words and long vs. short word tasks, T is 1.4 second. Each task has 100 trials for the target class corresponding to each subject. 5 Pr epr ocessing : EEG signals are captured using 64 electrodes and do wn-sampled to 256 Hz. Out of 64 channels, 60 chan- nels were used for recording EEG signals of IS tasks. EEG signals are preprocessed by applying a 5th order Butterworth bandpass filter in the range 8-70 Hz, a notch filter at 60 Hz, and an algorithm of electrooculogram artifact removal [18]. The dataset contains nine subjects for vo wels IS task, six subjects for short w ords IS task, six subjects for long words IS task, and sev en subjects for long vs. short word IS task. Each subject has 100 trials for ev ery target class except for two subjects in the short vs. long word classification task having 80 trials each. W e rejected data of one subject from short words IS task, three subjects from vo wels IS task, one subject from long words IS task, and one subject from long vs. short word IS task due to a mismatch between the number of channels in the subject’ s data. Dataset details : W ithin each trial, subjects performed three repetitiv e thinking processes under the imagined speech con- dition. Hence, each trial gav e rise to three di ff erent [ c , t ] di- mensional matrices with c = 60 , t = 256 for vo wels and short words and c = 60 , t = 360 for long words and short vs. long word tasks. For each subject, we hav e [900 , 60 , 256] or [600 , 60 , 360] dimensional matrix as input (except for two subjects in short vs. long words task where dimension is [480 , 60 , 360]) and 3 or 2-dimensional one hot vector as tar- get labels depending on the 3 vo wels / short words category or 2 long words / short vs. long word category . 3.2. Appr oach Overview and Bac kgr ound W e provide a brief description of our approach and an ov ervie w of the concepts used in the approach. 3.2.1. Overview Our proposed approach for decoding the IS signal is summa- rized in the follo wing steps. First, we create the cov ariance ma- trices from the raw EEG trials. Then, we project each of these cov ariance matrices to the tangent space (TS) to get a vector representation of the matrices. Third, we reduce the dimen- sion of these vectors using PCA. Finally , features in the lower dimension are giv en as an input to the ensemble of NN clas- sifiers, and the results of all classifiers are av eraged to get the final prediction of the model. Based on the user’ s thoughts, the model makes a prediction, and after that, a corresponding ac- tion is performed on the computer screen for updating the user interface. Before a detailed explanation, we briefly go through the concepts used in our proposed approach. 3.2.2. Covariance Matrix Giv en an EEG trial E ∈ R n , m , cov ariance matrix C ∈ R n , n is computed as C = 1 m E ∗ E T , where n is number of EEG chan- nel and m is number of samples, T represents matrix transpose operation. 3.2.3. T angent Space In order to obtain a feature vector , a cov ariance matrix is transformed to the tangent space (ts) [16] as follows: P i = C 1 / 2 m logm ( C − 1 / 2 m C i C − 1 / 2 m ) C 1 / 2 m logm ( M ) = V D 0 V − 1 , D 0 [ i , i ] = log ( D [ i , i ]) (1) where C i is the co v ariance matrix, C m is the mean of the co vari- ance matrices (denoted as reference point in Figure 4), V DV − 1 represents diagonalized form of the matrix M and P i is the pro- jected matrix. 3.2.4. Principal Component Analysis In our work, we used PCA [19] for dimension reduction. The objectiv e function of PCA is, ma x u ∈ R n u T C u subject to k u k 2 2 = 1, where C is the co variance matrix obtained and v ector u ∈ R n . 3.2.5. Artificial Neural Network W e use Artificial Neural Network (ANN) [17], [20], [21] as a classification model. ANN linearly combines the input and then applies non-linearity (both steps applied in a layered f ashion) to generate the desired output. Connectivity between two layers of ANN is defined as follows: a l = g l ( W l ∗ a l − 1 ) (2) Here, v ector a l − 1 ∈ R n represents an input obtained from layer l − 1, a l ∈ R m represents an output at layer l , W l ∈ R m , n is the weight matrix between layer l − 1 and l and g l is the elementwise non-linear activ ation function at the layer l . 3.2.6. Bootstrap Aggr e gation T o increase the accuracy , we use the Bootstrap Aggre gation (Bagging) [22] with ANN as a base classifier . This classifica- tion method creates sev eral base classifiers and trains each on a subset of the original dataset. The result of the Bagging classi- fier is the av erage of base classifiers. 3.3. Pr oposed Approac h In this section, we describe our proposed approach in detail (as shown in Figure 4). 3.3.1. F eature Extr action The following steps pro vide details of the proposed approach for feature extraction from the ra w EEG signals. • W e store raw EEG trials in the format [ n , c , s ] where n is the number of trials, c is the number of channels, and s is the number of samples. Thereafter , we divide data into training and test set in the form [ n tr , c , s ] and [ n te , c , s ] where n tr and n te represents the number of trials in train and test set, respectiv ely . • For each trial in the train and test set, covariance matrices are calculated (as described in section 3.2.2) and stored in the form [ n tr , c , c ] and [ n te , c , c ]. After that, the train set is used to find the mean of covariance matrices, which is represented as C m in equation (1). • Each trial of the training and testing data is then projected to tangent space (as defined in equation 1). After that pro- jected matrices are con verted to vector representation by concatenating rows of the matrix to form the matrices of dimension [ n tr , n f ] and [ n te , n f ] where n f denotes the num- ber of features. 6 Figure 4: Proposed approach. • Feature dimension is then reduced by PCA (as defined in section 3.2.4). The training data [ n tr , n f ] is used for learning the projection vectors ( u ). Thereafter , dimension of training and testing data is reduced using the learned vectors u to form the matrices of dimension [ n tr , n r f ] and [ n te , n r f ], where n r f denotes the number of features ob- tained after the dimension reduction. The number of fea- tures ( n r f ) are selected from the set { 4, 8, 16, 32, 64 } using the cross-validation. The computation of obtaining cov ariance matrices from raw EEG signals and cov ariance matrix transformation to vectors was performed using the Pyriemann library [23]. PCA imple- mentation of sklearn [24] is used to project vectors into lower - dimensional space. 3.3.2. F eature Classification T o classify the features obtained after the dimension reduc- tion, we utilize a bagging classifier with ANN as its base clas- sifier . A bagging classifier contains k base classifiers, where k is a hyperparameter selected from the set { 2, 4, 8, 16, 32, 64 } using the cross-v alidation. The output of the bagging classifier is the av erage of k ANN’ s. The base classifier (ANN) tak es [ n b , n r f ] dimensional matrix as input and generates [ n b , n o ] dimensional matrix as an output by applying equation (2) in a layered fashion. In the matrix di- mension, n b denotes the batch size, and n o denotes the number of output classes. The intermediate features of ANN are rep- resented by [ n nb , n l f ] where, n l f denotes the number of features at layer l . In the implementation, we have used a single hid- den layer, and the number of neurons in the hidden layer are selected from the set { 8, 16, 32, 64, 128, 256 } by performing the cross-validation. Non-linearity in the ANN is introduced by applying the ReLU activ ation function at the hidden layer . At the output layer, the cross-entropy loss is computed through the ANN output matrix O pred of dimension [ n b , n o ] and target output represented by one hot matrix O tr ue of dimension [ n b , n o ]. Each row of the output matrix O pred generates target class probability and sums to 1. Each row of one hot matrix O tr ue has all zeros b ut one for the class in which input belongs. For the regularization, the l2 penalty is applied with a regular - ization parameter of 0.0001. The gradients of the weights are calculated with respect to cross-entropy loss and computed us- ing the back-propagation algorithm. ANN weights are updated using the gradient descent variant Adam optimizer [25]. The learning rate of the Adam optimizer is initialized with 0.001. At each iteration of the training, samples are randomly shuf- fled and divided into a mini-batch size of 200. The weights of ANN are initialized using the approach suggested by Glorot et al. [26]. The bagging classifier’ s training (with ANN as a base classifier) is performed using the sklearn library [24] of Python. T o obtain each ANN weights’ after the training, a class BaggingClassifier in sklearn contains an attribute estimator that provides the weights and hyper -parameters of each ANN. 4. Results This section shows the results of our proposed approach and then compares the results with various state-of-the-art ap- proaches. 4.1. Model Evaluation In this section, we first report results based on our pro- posed approach of using the cov ariance matrix, tangent space, PCA, and ANN with the be gging classifier (termed as ts + ann in short); after that, compare with existing approaches for decod- ing the IS task. 4.1.1. P erformance metric W e used classification accurac y ( C A ) to check model perfor- mance. C A measures the number of predicted outputs equal to actual outputs divided by the number of predictions. This quantity lies between 0 and 1. (1 − C A ) denotes the model’ s misclassification rate. A train and test set is created by utiliz- ing stratified 10-fold validation, which preserv es the percentage of samples present in each class. Also, samples of each class are shu ffl ed before di viding the data into batches for creating k-folds. 7 Figure 5: Spectrogram for two classes of the long words classification task. (a) (b) Figure 6: (a) Classification accuracy on long words imagined speech, short words, and v owels vs. rest state brain signals. (b) Classification accuracy of our proposed approach (ts + ann) on four di ff erent IS tasks. The participant’ s id follows the name of each task. Error bars sho w the standard error of mean. 4.1.2. F eature analysis T o analyze the IS-based EEG signal, we plot a spectrogram (in Figure 5) of subject s11 corresponding to the two long-word classification task. In Figure 5, Class 0 and 1 corresponds to the two target classes of the long words classification task, and each ro w corresponds to a channel of the EEG signal. The spec- trogram shows that the IS-based EEG signals of two classes in the long-word classification task contain discriminativ e infor- mation, which a classifier can utilize to identify an imagined word. 4.1.3. IS vs. r est state W e first show results for the classification of IS signals from the rest state signals. For comparison, we extracted IS signals of the 5 th period from the dataset and 2 seconds of rest state brain signals. W e choose the 5 th period because it only con- tains visual cues for imagined speech condition, thereby a void- ing any e ff ects generated due to the audio. Using e xperimental results, we sho w that our proposed approach can separate IS signals from brain rest state signals with very high accuracy . W e sho w these results on the classification task of long words, short words, and vo wels in Figure 6a. The high accuracy of many subjects on three di ff erent tasks shows that our proposed approach can successfully di ff erentiate IS signals from rest state brain signals. W e performed a significance test of our proposed approach with chance level classification accuracy . W e report p-values using 2 tailed t-test in T able 1. Small p-values show that results obtained using our proposed approach are significantly di ff erent from the chance lev el classification accuracy . In T able 2, we report the mean classification accuracy and standard de viation of all the subjects calculated for each classi- fication task. A high accurac y of many subjects on three di ff erent classifi- 8 T able 1: P-V alues for the proposed approach and chance level accurac y . t-test p-values V o wels 0.0005 Short words 0.0083 Long words 0.001 T able 2: Classification accurac y across subjects on di ff erent IS classification tasks and rest state brain signals. IS task vs. rest state Mean accuracy Standard deviation V o wels 0.8033 0.0858 Short words 0.794 0.1355 Long words 0.858 0.0927 cation tasks shows that our proposed approach can successfully di ff erentiate IS signals from the rest state brain signals. T able 3 shows the mean classification accuracy , the standard de viation of the mean values, standard error of the mean, the maximum and minimum value of each subject in di ff erent IS tasks. Note that all subjects’ minimum classification accuracy is well above the chance le vel for the long-word classification task compared to the other task of short words and vo wels. Experimental re- sults suggest that long words carry a lot more information than short words, which our proposed model uses to di ff erentiate from the rest state brain signals. 4.1.4. F our IS tasks Now we report results using our proposed approach on four IS tasks: 3 v owels, three short words, two long words, and one long vs. short word. Figure 6b sho ws the mean classification accuracy of the pro- posed approach on di ff erent subjects. W e report a maximum mean classification accurac y of 0.85 for subject s9 on short vs. long word and a minimum of 0.5378 for subject s12 on v ow- els based IS classification task. Note that the classification ac- curacy is well abov e the chance level for each subject. High performance on short vs. long word classification task across all subjects states that the long word imagination leads to EEG patterns that are v ery di ff erent from the short w ord imagination. In T able 4, we report mean classification accuracy and standard deviation obtained on each IS task. Due to the complexity of short and long words, our approach obtains the highest mean classification accuracy in the short vs. long word IS task. 4.1.5. Comparison Baseline : W e compare our approach with two baselines (CNN and RNN) on the three short words and two long words classification tasks. T o model spectral and spatial features of the EEG signals, CNN contains fi ve conv olutions, three pool- ing, and two dropout layers. T o reduce the number of training parameters, the output of the 5 th con volution layer is directly connected to the output layer of CNN. Nonlinearity in the net- work is introduced by applying the ReLU activ ation function between con volution and pooling layers. A dropout layer is added to reduce the network’ s ov erfitting and is applied after T able 3: Mean, Standard Deviation (Std), Standard Error Of Mean (Sem), Max- imum (Max) And Minimum (Min) Classification Accuracy for all Subjects on Di ff erent IS T asks. Long words vs. rest MEAN STD SEM MAX MIN s2 0.9125 0.0406 0.0135 0.95 0.825 s6 0.7825 0.0461 0.0153 0.875 0.7 s7 0.735 0.0538 0.0179 0.825 0.675 s9 0.94 0.0254 0.0084 0.975 0.875 s11 0.92 0.0471 0.0157 0.975 0.8 Short words vs. rest MEAN STD SEM MAX MIN s1 0.8633 0.0296 0.0098 0.9166 0.8166 s3 0.9266 0.0249 0.0083 0.95 0.8666 s5 0.6083 0.0597 0.0199 0.7166 0.55 s8 0.695 0.0628 0.0209 0.7666 0.5333 s12 0.8766 0.0454 0.0151 0.95 0.8166 V o wels vs. rest MEAN STD SEM MAX MIN s8 0.7983 0.0292 0.0097 0.85 0.75 s9 0.8516 0.039 0.013 0.9166 0.8 s11 0.8866 0.042 0.014 0.9666 0.8 s12 0.9 0.0324 0.0108 0.9666 0.8666 s13 0.675 0.0606 0.0202 0.7666 0.55 s15 0.7083 0.0389 0.0129 0.7666 0.6666 T able 4: Mean Classification Accurac y and Standard Deviation on four IS tasks using our proposed approach of ts + ann. IS task Mean accuracy Standard deviation vo wels 0.586083 0.038881 short words 0.6035 0.044183 short vs. long word 0.785117 0.049689 long words 0.6943 0.055531 the pooling layers. The kernel size at each con volution layer and the dropout rate is a hyperparameter , which are tuned using cross-validation. T o model the temporal nature of EEG signals, a variant of RNN named GR U [27] is used as a baseline. At each time step of the GR U, a sample of the EEG trial is provided as an in- put to the model. Similarly , the output is collected from the GR U at each time step. The output of all time steps is a veraged to generate a single output of GR U. Both CNN and RNN are trained using the minibatch size of 32 and using the Adam op- timizer . The weights of CNN and RNN are initialized using the approach of Glorot et al. [26]. Figure 8 compares the proposed approach with two deep learning baselines CNN and RNN. Figure 8 sho ws that the pro- posed approach of ts + ann outperforms both baselines on the short words classification task and performs better on three sub- jects (out of 5) on two long words classification task. These re- sults confirm the generalization capability of the proposed ap- 9 (a) (b) (c) (d) Figure 7: Classification accuracy of di ff erent approaches on vo wels, short vs long, short and long words classification tasks. Error bars show standard error of mean. The results for comparison are from the paper [11]. Due to the una vailability of comparison results in long words IS task [11], we compare our approach only with ts + rvm. (a) (b) Figure 8: Classification accuracy of our proposed approach and two baseline approaches (CNN, RNN) on classification tasks: (a) 2 long words, (b) 3 short words. proach of ts + ann ov er two baselines of CNN and RNN. Existing appr oaches : No w we compare our proposed ap- proach of using ts + ann with existing approaches on di ff erent IS tasks (Figure 7). W e compare our approach of using ts + ann with: (a) ts as features with rvm as a classifier approach sug- gested by Nguyen et al. [11]; (b) ts as features, and elm as a classifier approach also suggested by Nguyen et al. [11]; (c) use of statistical features with elm as a classifier suggested by min et al. [14]; (d) CSP based transformed signal with SVM as a classifier approach of Dasalla et al. [13]; and (e) variance of CSP transformed signal with LD A as a classifier suggested by T omioka et al. [12]. The results for comparison are from the paper [11], which are av ailable for three di ff erent IS tasks: vo wels, short words, and short vs. long word. Due to the un- av ailability of comparison results for the long-word classifica- tion task in [11], we compare our proposed approach only with the ts + rvm approach [11]. Detailed comparison : As reported in Figure 7, our approach outperforms existing approaches in v owels, and short-words IS tasks and performs equiv alent to the ts + elm, ts + rvm approach on decoding short vs. long word and tw o long w ords IS tasks, respectiv ely . W e report the highest classification accuracy of 0.85 on short vs. long w ord IS task for subject s9 and minimum classification accuracy of 0.5378 for subject s12 on vo wels IS task. Results obtained using our approach of ts + ann are well abov e chance level for all subjects on all four IS tasks. Chance lev el accuracy is 0.33 for vowels, and short words and 0.5 for short vs. long word and long-word IS tasks. Due to the di- mension reduction with PCA and the generalization capability of ANN, our proposed approach outperforms other approaches with a significant margin on vo wels and short words IS tasks. For the short vs. long words classification task, our approach ts + ann outperforms the approach proposed by Nguyen et al. [11] on four subjects (out of 6) with a significant margin. Simi- larly , on the long words classification task, our approach ts + ann outperforms the approach proposed by Nguyen et al. on three subjects (out of 5). In our approach, the Bagging classifier helps in reducing the v ariance in predicting the output. Therefore, re- sults are more stable in terms of SEM in comparison to the other approaches. W e compare the mean classification accuracy , standard de vi- ation, maximum, and minimum accuracy obtained using our ap- proach with existing approaches in T able 5. For the long w ords IS task, we compared our approach only with the approach pro- posed by Nguyen et al. [11] due to the lack of comparison results in [11]. As we observe from T able 5, our proposed ap- proach is able to outperform other approaches in short words and vo wel classification tasks and performs equi valent with the approach suggested by Nguyen et al. [11] on short vs. long words and long words classification task. Our proposed ap- proach of using ts + ann also has less de viation in comparison to the other approaches. This is achie ved by using an ensemble of ANN classifiers and av eraging the results. T -test : Now we perform significance testing of our proposed approach with chance lev el accuracy and other approaches. T a- ble 6 sho ws the p-values after performing the two-tailed pair- wise t-test. Results in T able 6 sho w a very low p-value when comparing our proposed approach ts + ann with chance lev el ac- curacy . Hence, our approach performs well abov e the chance lev el on all four IS tasks. In comparison to the approach pro- posed by Nguyen et al. [11], results obtained using our ap- proach are significantly di ff erent for vo wels and short words IS tasks. This is verified by the low p-values of 0.01171 and 0.00385 for a 0.05 significance le vel. In contrast, for short vs. long word and long words IS tasks, p-values 0.15901 and 0.34204 show the equi valence of results between our proposed 10 T able 5: Detailed comparison with di ff erent approaches. Result are in the format: Mean Accuracy + Standard Deviation, Minimum Accurac y - Maximum Accuracy . The comparison results are from the paper [11], where results of the long words IS task are av ailable only for ts + rvm approach. V o wels IS task Subjects s8 s9 s11 s12 s13 s15 csp + lda [12] 34.6 + 11.8 40.3 + 10.4 31.0 + 8.5 37.3 + 7.1 37.5 + 8.1 31.0 + 12.7 16.6-60 13.3-46.6 20.0-46.6 30.0-53.3 26.6-53.3 10.0-50.0 csp + svm [13] 36.7 + 9.2 34.7 + 7.7 33.7 + 8.7 41.7 + 5.7 38.7 + 7.6 31.0 + 7.4 30.0-60 30.3-53.3 23.3-53.3 36.7-56.7 30.3-56.7 23.3-46.7 statF + elm [14] 46.5 + 5.6 36.1 + 4.4 36.0 + 7.1 39.3 + 9.4 34.3 + 6.5 34.0 + 8.3 36.7-56.7 26.6-43.3 30.0-50.0 30.0-60.0 23.3-43.3 23.3-46.7 ts + elm [11] 45.3 + 8.9 46.0 + 5.1 43.3 + 7.9 48.6 + 8.9 45.7 + 7.2 46.7 + 7.5 30.0-56.7 36.7-53.3 33.3-53.3 36.7-60.0 36.7-63.3 36.7-60.0 ts + rvm [11] 51.0 + 6.7 47.0 + 5.5 53.0 + 4.0 51.0 + 6.3 46.7 + 8.2 48.0 + 7.2 43.3-63.3 36.7-53.3 46.7-60 43.3-63.3 33.3-60.0 33.3-56.7 ts + ann (proposed) 62.0 + 4.68 61.66 + 6.46 54.0 + 4.16 53.78 + 4.84 58.44 + 3.52 61.55 + 3.69 53.33-68.8 54.44-72.22 45.55-61.11 43.33-58.88 53.33-64.44 55.55-66.66 Short words IS task Subjects s1 s3 s5 s8 s12 csp + lda [12] 39.6 + 7.6 32.6 + 4.9 27.7 + 9.8 43.3 + 7.0 27 + 10.8 26.6-53.3 26.6-43.3 20.0-50 36.6-53.3 13.3-43.3 csp + svm [13] 42.3 + 8.2 38.3 + 5.3 35.3 + 8.3 38.3 + 6.1 41.33 + 6.7 33.3-56.7 33.3-50.0 30.0-56.7 33.3-53.3 33.3-53.3 statF + elm [14] 41.0 + 5.5 42.3 + 8.0 48.3 + 7.2 34.7 + 5.9 49.0 + 6.7 46.7-56.7 26.7-56.7 36.7-60.0 26.7-46.7 36.7-56.7 ts + elm [11] 44.6 + 10.3 45.3 + 7.4 43.4 + 7.7 45.0 + 8.5 55.0 + 9.8 33.3-60.0 33.3-56.7 30.0-56.7 30.0-56.7 40.0-70.0 ts + rvm [11] 48.0 + 6.1 49.7 + 5.5 46.3 + 8.2 47.7 + 9.8 54.7 + 6.9 40.0-56.7 40.3-56.7 36.7-66.7 36.7-66.7 43.3-66.7 ts + ann (proposed) 57.44 + 4.55 55.0 + 5.28 59.77 + 4.91 63.88 + 6.25 65.66 + 5.99 48.88-64.44 43.33-61.11 54.44-72.22 53.33-75.55 57.77-76.66 Short vs long words IS task Subjects s1 s5 s8 s9 s10 s14 csp + lda [12] 50.5 + 14.8 59.5 + 5.7 36.9 + 15.9 74.1 + 16.6 64.3 + 23.0 78.5 + 6.3 30.0-72.5 52.5-70.0 21.9-71.9 31.3-87.5 20.0-80.0 70.0-90.0 csp + svm [13] 61.5 + 12.0 61.5 + 8.8 62.5 + 8.3 58.1 + 7.2 66.0 + 11.5 54.5 + 13.2 50.0-85.0 50.0-80.0 50.0-81.3 50.0-75.0 50.0-85.0 45.0-90.0 statF + elm [14] 51.0 + 8.4 59.5 + 6.4 59.4 + 11.5 51.9 + 6.6 61.0 + 9.7 54.0 + 6.1 40.0-65.0 50.0-70.0 43.8-81.3 43.8-68.8 45.0-75.0 50.0-70.0 ts + elm [11] 73.5 + 8.2 70.0 + 6.2 80.6 + 13.2 72.5 + 12.2 75.5 + 6.8 85.5 + 6.8 60.0-85.0 60.0-80.0 62.5-93.8 43.7-87.5 65.0-85.0 75.0-95.0 ts + rvm [11] 63.3 + 2.9 65.8 + 3.1 76.9 + 3.0 69.4 + 7.5 76.8 + 6.2 87.5 + 5.5 60.0-70.0 62.5-70.0 71.8-81.3 59.4-81.3 67.5-85.0 75.0-92.5 ts + ann (proposed) 76.5 + 2.83 71.33 + 5.66 77.08 + 4.26 85.0 + 4.73 77.83 + 5.16 83.33 + 3.57 73.33-81.66 60.0-78.33 68.75-85.41 77.08-91.66 68.33-85.0 78.33-90 Long words IS task Subjects s2 s6 s7 s9 s11 ts + rvm [11] 70.0 + 7.8 72.0 + 0.6 64.5 + 5.5 67.8 + 6.8 58.5 + 7.4 55.0-80.0 65.0-85.0 59.0-75.0 55.0-80.0 50.0-77.5 ts + ann (proposed) 74.66 + 4.76 69.33 + 5.53 75.33 + 6.35 64.33 + 5.12 63.5 + 5.39 66.66-81.66 60.0-76.66 65.0-86.66 56.66-71.66 53.33-73.33 approach (ts + ann) and Nguyen et al. [11] (ts + rvm). Similar behavior is also observed for the ts + elm approach, which is suggested by Nguyen et al. [11]. For all other approaches, we see that p-v alues are far below the significance lev el. Hence, it shows that results obtained with our approach (ts + ann) are significantly di ff erent from ap- 11 T able 6: P-V alues Obtained After T wo T ailed Paired T -T est. The comparison results are derived from the paper [11], where results of the long words IS task are av ailable only for ts + rvm approach. IS task ts + ann, chance level ts + ann, ts + rvm ts + ann, ts + elm ts + ann, statF + elm ts + ann, csp + svm ts + ann, csp + lda vo wels 0.000016673 0.0117196 0.000780616 0.000246665 0.00038811 0.0000936821 short words 0.000157915 0.00385681 0.001383572 0.005317578 0.000641303 0.002537817 short vs. long 0.0000327993 0.159018237 0.372650079 0.001139683 0.002841504 0.019606281 long words 0.001440737 0.34204982 - - - - T able 7: Mean classification accuracy (Mean) and standard deviation (Std) computed across all subjects for each IS task. The comparison results are de- riv ed from the paper [11], where results of the long words IS task are available only for ts + rvm approach. T ask Short words V o wels Short vs. Long Long words csp + lda Mean 34.04 35 64.83 - Std 7.21 3.91 10.12 csp + svm Mean 39.1 35.5 61 - Std 2.77 3.8 4.64 statF + elm Mean 43.06 37.5 56.16 - Std 5.86 4.71 4.75 ts + elm Mean 46.66 45.5 75 - Std 4.71 1.81 5.25 ts + rvm Mean 50.1 49.0 73.3 66.2 Std 3.5 2.4 8.86 4.8 ts + ann Mean 60.35 58.6 78.5 69.43 Std 4.41 3.88 4.96 5.55 proaches suggested by min et al. [14] (statistical features with elm as a classifier), Dasalla et al. [13] (CSP based transformed signal with SVM as a classifier) and T omioka et al. [12] (vari- ance of CSP transformed signal with LDA as a classifier) on vo wels, short words and short vs. long word classification tasks. A verag ed performance per approac h : From T able 5, we ob- serve that the performance of each approach varies significantly across subjects. T o compare di ff erent approaches, we require a result from each of the considered approaches. T o this end, we av erage the performance of each approach across all subjects. This pro vides one performance measure for each classification task. T able 7 summarizes these results. T able 7 shows that our proposed approach gives the highest accurac y across all the IS classification tasks. By examining the standard de viation of our approach, it is clear that the ANN model does not show much variability across subjects. Other approaches show lo w mean accuracy with lo w v ariance or high accuracy with high variance across all the subjects. Hence, existing approaches are either unable to e xtract useful discriminati ve information, thereby re- sulting in lo w accuracy and low deviation, or these approaches can decode IS signals of some subjects and, therefore, achie ve high accurac y , howe ver , with high variance. The approach with high mean accuracy and lo w variance (when calculated across all subjects) is desired. Kappa scor e : In T able 8, we show the kappa score for each classification task. T o e valuate the kappa score, all subjects’ ac- T able 8: Kappa score computed across all subjects for each IS task. The com- parison results are deri ved from the paper [11], where results of the long w ords IS task are av ailable only for ts + rvm approach. T ask Short words V o wels Short vs. Long Long words csp + lda 0.015 0.02 0.29 - csp + svm 0.09 0.03 0.22 - statF + elm 0.15 0.06 0.12 - ts + elm 0.203 0.18 0.5 - ts + rvm 0.25 0.23 0.46 0.32 ts + ann 0.408 0.382 0.57 0.388 curacy is a veraged and compared against chance le vel accurac y for each task. Kappa score is calculated as (accuracy with an approach - chance le vel) / (1 - chance le vel). If the accuracy of an approach is close to chance le vel, then the kappa score will be close to 0. Similarly , if an approach achieves an accurac y of 1, then the kappa score is 1. In contrast, if the accurac y is below the chance level, then the kappa score is negati ve. From T able 8, it is evident that the kappa score of the proposed approach is positi ve and higher than the existing approaches. Therefore, the relativ e accuracy of the proposed approach (ts + ann) w .r .t. chance lev el is much higher than the existing approaches. Conclusion : The results show the generalization capability of ANN models ov er other models when giv en the same input data. Note that the classification accuracy of w ords in the long words IS task and short vs. long words IS task is much higher than vo wels and short-word IS tasks. The high classification accuracy for long words and short vs. long words IS tasks sug- gests that the proper choice of words based on word length and complexity provides useful discriminative information and im- prov es the models’ generalization po wer . 4.1.6. Ablation results W e perform the ablation e xperiment to demonstrate the e ffi - ciency of both PCA and Bagging classifier in the proposed ap- proach. Figure 9 compares the proposed model’ s accuracy (co- variance matrix, tangent space, PCA, and Bagging with ANN as a base classifier) and a model using the cov ariance matrix, tangent space, and ANN as a classifier . Figure 9, shows that the PCA and Bagging classifier indeed improves the model’ s accu- racy in the tw o long words and three vo wels classification task. The high accuracy with the proposed approach shows that the features obtained after PCA contain discriminativ e information and reduce the number of training parameters of the ANN, thus av oiding o verfitting of the model. In the three short-word clas- 12 (a) 2 long words (b) 3 short words (c) 3 vo wels Figure 9: Ablation results with and without pca and bagging classifier . Classification accuracy of our proposed approach co v + ts + pca + ann + bag and a second approach of cov + ts + ann on di ff erent IS classification tasks. sification task, the performance drop is observed for three out of 5 subjects. A reason for the performance drop is the loss of discriminativ e information after applying the dimension reduc- tion on the features obtained in the tangent space. Based on the results shown in Figure 9, it is advised to decode IS signals belonging to the long words and v owels category with the pro- posed approach. For the short words category , EEG signal clas- sification for a subject should be performed with and without PCA, and a model with the highest v alidation accurac y should be selected. 4.1.7. Design evaluation T o ev aluate an FSM design for the IS based BCI system, we compute average information (denoted as I ) across di ff erent tri- als of a subject as follows: I = log 2 | C | + alog 2 a + ml og 2 m | C | − 1 (3) Where, | C | is the number of classes in the tar get class set C , a is the classification accurac y and m is the misclassification rate of the classifier computed as 1 − a . No w information transfer rate (ITR) can be obtained as, I T R = I / T (4) Where, I is a verage information in bits per trial and T is the total time of each trial. For our analysis, we have | C | = 2 since C = { 0 , 1 } , a = 0 . 95, m = 0 . 05 and T = 2 seconds. Hence, I T R in our case is 0.35 bits per second or 21 bits per minute. As sho wn later in the results section, a = 0 . 95 is the mean clas- sification accuracy of subject s9 rounded to the nearest decimal (0.94 is upto 2 decimal places) for the classification task of rest state brain signals vs. long word IS signals (§4). 5. Discussion, Related W ork and Conclusion This section discusses a few points related to performance on di ff erent datasets and design aspects of an IS based BCI system. After that, we provide the concluding remarks. 5.1. Discussion In this paper , we ha ve shown that our proposed approach can decode IS-based brain signals such as long words and short vs. long word with high accuracy . Also, our approach gen- eralizes to vo wels and short words IS tasks by improving the results of the state-of-the-art approaches. W e observe that an appropriate feature and a classification model can improve the word decoding capability . Because words or v owels are di ff er - ent in their speech signal representation, the process generat- ing these sounds inside the brain must generate di ff erent acti- vation patterns. These activ ation patterns lead to the discrim- inativ e EEG signals. Since long words are more complicated than vo wels and short words in terms of imagined pronuncia- tion. Hence, this additive complexity in silently speaking the long words provides more discriminative information and im- prov es the classification results for short vs. long w ord and long words decoding tasks. The beha vior of sophisticated features representation is also supported by the results obtained for the IS signal vs. rest state brain signal. W e observe high classification accuracy for long words vs. rest state in comparison to short words / v o wels vs. rest state brain signals. W e observe a di ff erence of around 5% in classification accurac y when decoding long w ords IS signals from rest state in comparison to v owels / short words IS signals from rest state brain signals. W e believe that model perfor- mance will increase if the time di ff erence of capturing IS signal and rest state signal increases. In the experiment by [11], the rest state condition was immediately follo wed by the IS condi- tion. So there is some chance that subjects are still in an imagi- nary state, and thus feature representation is the same. Extension of the interface design : The proposed work also presents two new interface designs for computer control with the follo wing benefits and di ff erences from existing designs: 1) This interface design is generic. Though we illustrate for IS- based EEG tasks, the design can be expanded for use in other BCI paradigms such as motor imaginary . Howe ver , the inter- face currently being used in P300 speller or motor imaginary to control the mouse cannot be easily used in IS tasks. 2) The in- terface in this paper is shown for the binary classification tasks, but it can easily be extended to a multiclass setup for providing faster navigation or multiple features to the user . 3) Design 2 provides an easy way of navigation within a file structure. Since 13 design 1 is generic, it can be used in various computer applica- tions such as folder navigation, browser -control, or navigating through documents (reading purpose). 4) Designs 1 and 2 can be easily extended for providing more functionality to users, such as pro viding right-click, double-click, and single-click of the mouse. 5) One crucial di ff erence between existing designs and proposed design is that designs presented in this work are reactiv e instead of existing proactiv e designs. Reactive vs. pr oactive design : In the case of reacti ve design, we wait for the user signal to modify the current system. In contrast, the proactiv e design keeps the system activ e by au- tomatically moving the cursor over av ailable computer screen options. The user requires to provide input when the target lo- cation is reached. An example of proactive design is the hor- izontal line mov ement from top to bottom and a vertical line mov ement from left to right on the computer screen. These lines create various intersection points on the computer screen. When the intersection of lines is at the target location, the user provides an input, and the system state changes accordingly . After that, the whole process repeats. The second proactiv e de- sign is a circular rotation of a line segment starting from a com- puter screen center up to the end of a computer screen. When the line intersects with a target location, such as some folder , the user pro vides input, and the line rotation stops (say at an an- gle of degree θ from positi ve-x / horizontal direction). Then line segments of di ff erent lengths are displayed from small lengths up to the maximum screen resolution size along the direction θ . A user provides a second input whene ver a new line seg- ment reaches the target location. The above are fe w examples of proactiv e interface design to operate the computer system. Design simulation : Note that the designs presented here are tested in a partial online setting. In a partial online setting, rather than taking input from an EEG device, the input was taken from a user mouse click. Based on the click’ s location, corresponding IS based EEG trial from the test set was picked, processed, classified, and the system state was changed. The new system state was sho wn to the user , and then the user ag ain provides input to reach a target location. This provides a closed- loop of the BCI system for human-computer interaction. 5.2. Related work Now we discuss e xisting approaches for decoding IS signals. These approaches are state of the art and widely used in decod- ing brain signals. Nguyen et al. [11] used 64 channel EEG to capture three vo wels, two long words, and three short words across di ff erent subjects. They used features from Riemann manifold (T angent Space (TS)) [16] as an input to the Relev ance V ector Machine (R VM) [28]. Their results show the mean classification accu- racy of 49% for vo wels and short words, 66% for long words across, and 73% for long vs. short word classification tasks for di ff erent subjects. W e significantly improve these results for vo wels and short-word classification tasks and obtain equiv a- lent results for long words and short vs. long word classifica- tion tasks. This impro vement was achie ved by reducing the di- mensions of the transformed cov ariance matrix using the PCA and a more powerful NN classifier combined with bagging as an ensemble classifier . The authors also suggest using Extreme Learning Machine (ELM) as a classifier , but they obtained very similar results by using R VM as a classifier . T omioka et al. [12] applied Common Spatial Pattern (CSP) to data, calculated log-variance of each transformed channel to create input features, and used linear discriminant analysis (LD A) as a classifier . Here, the LD A classifier poses the main limitation, which works well if the features of each class are generated using the normal distrib ution. Our approach remo ves this limitation by using a robust ANN classifier for modeling complex distrib utions. Dasalla et al. [13] used CSP-based transformation and sup- port vector machine (SVM) as a classifier . They used four CSP channels for transforming raw EEG signals using the training data and then transformed both training and test data using learned parameters. Signals obtained after transformation were stacked together to form a v ector and finally gi ven as input fea- tures to the SVM classifier . The authors used CSP , which is known to work best for the case of motor imaginary signals. In contrast, we used the covariance matrix as input features to our model, capturing the dependence between di ff erent chan- nels and retaining some information caused by imagined speech production. Min et al. [14] used statistical features such as mean, vari- ance, standard deviation, and skewness, and ELM as a clas- sifier . T o extract these features, they divided the signals into ov erlapping windows and calculated these features over each channel of each windo w to form a feature v ector, used a sparse- regression-based feature selection scheme to reduce the dimen- sion of the features, and used ELM as a classifier . In our pro- posed approach, we used PCA for feature dimension reduction as this method is much faster than a sparse regression-based feature dimension approach. Another di ff erence lies in the use of the classification model. Our feed-forward neural network model is trained using gradient descent, and gradients are com- puted using a backpropagation algorithm (rather than random initialization of weights in the first layer of ELM). Gradient de- scent makes our model more robust and shows good general- ization on test data. In other contexts such as motor imagery classification of EEG signals, Amin et al. [29] proposed a deep learning model based on con volution neural networks. Acharya et al. [30] pro- vided a revie w of the EEG signals based on the focal and non- focal category to detect brain areas a ff ected by seizures. W eijie et al. [31] proposed various signal processing techniques for an- alyzing the brain signals. Rajdeep et al. [32] proposed a feature selection approach (based on the machine learning technique) for the motor imagery signal. Hyun et al. [33] proposed an approach based on genetic algorithms and neural networks to recognize Alzheimer’ s disease based on the EEG signals. 5.3. Conclusion Our proposed work shows that it is possible to design an imagined speech signal-based brain-computer interface for human-computer interaction with machine learning techniques. W e ha ve presented an approach using the cov ariance matrix as input feature and ANN as classification model for decoding IS 14 signal. This approach outperformed e xisting methods when ap- plied on decoding short words and vo wels across all the sub- jects. Similarly , for long w ords and long vs. short words classi- fication tasks, our approach outperformed existing approaches on the majority of subjects. W e show that IS signals can be di ff erentiated from other brain signals, and the length of words is a useful criterion in discriminating words. In the future, we will work on improving model performance, developing new ways of computer interaction, and IS signal prediction models to recov er from high noise scenarios. References [1] J. W olpaw , E. W olpaw , Brain-Computer Interfaces: Principles and Prac- tice, Oxford Univ ersity Press, USA, 2012. URL https://books.google.co.in/books?id=tC2UzuC_WBQC [2] E. M. Mugler, C. A. Ruf, S. Halder, M. Bensch, A. Kubler, Design and implementation of a p300-based brain-computer interface for controlling an internet browser , IEEE Transactions on Neural Systems and Rehabili- tation Engineering 18 (6) (2010) 599–609. doi:10.1109/TNSRE.2010. 2068059 . [3] G. Hick ok, D. Poeppel, The cortical organization of speech processing, Nature Revie ws Neuroscience 8 (2007) 393–402. [4] N. T . Sahin, S. Pinker, S. S. Cash, D. L. Schomer , E. Halgren, Sequential processing of lexical, grammatical, and phonological information within broca’ s area., Science 326 5951 (2009) 445–9. [5] S. Martin, P . Brunner , I. Iturrate, J. del R. Millan, G. Schalk, R. T . Knight, B. N. Pasley , Corrigendum: W ord pair classification during imagined speech using direct brain recordings, in: Scientific reports, 2016. [6] M. T eplan, Fundamental of eeg measurement, MEASUREMENT SCI- ENCE REVIEW 2. [7] V . J. Lawhern, A. J. Solon, N. R. W aytowich, S. M. Gordon, C. P . Hung, B. J. Lance, Eegnet: a compact conv olutional neural network for eeg- based brain–computer interfaces, Journal of neural engineering 15 (5) (2018) 056013. [8] K. W ang, X. W ang, G. Li, Simulation experiment of bci based on imag- ined speech eeg decoding, arXi v preprint [9] P . Bashiv an, I. Rish, M. Y easin, N. Codella, Learning representa- tions from eeg with deep recurrent-con volutional neural networks, arXiv preprint [10] D. Zhang, L. Y ao, X. Zhang, S. W ang, W . Chen, R. Boots, B. Benatal- lah, Cascade and parallel con volutional recurrent neural netw orks on eeg- based intention recognition for brain computer interface, in: Proceedings of the AAAI Conference on Artificial Intelligence, V ol. 32, 2018. [11] C. H. Nguyen, G. K. Karavas, P . K. Artemiadis, Inferring imagined speech using eeg signals: a ne w approach using riemannian manifold fea- tures., Journal of neural engineering 15 1 (2018) 016002. [12] B. Blankertz, R. T omioka, S. Lemm, M. Kawanabe, K. r . Muller, Optimiz- ing spatial filters for robust eeg single-trial analysis, IEEE Signal Process- ing Magazine 25 (1) (2008) 41–56. doi:10.1109/MSP.2008.4408441 . [13] C. S. DaSalla, H. Kambara, M. Sato, Y . Koik e, Single-trial clas- sification of vowel speech imagery using common spatial patterns, Neural Networks 22 (9) (2009) 1334 – 1339, brain-Machine Interface. doi:https://doi.org/10.1016/j.neunet.2009.05.008 . URL http://www.sciencedirect.com/science/article/pii/ S0893608009000999 [14] B. Min, J. Kim, H. jun Park, B. Lee, V owel imagery decoding to ward silent speech bci using extreme learning machine with electroencephalo- gram, in: BioMed research international, 2016. [15] S. Ruan, J. O. W obbrock, K. Liou, A. Y . Ng, J. A. Landay , Speech is 3x faster than typing for english and mandarin text entry on mobile devices, CoRR abs / 1608.07323. . URL [16] A. Barachant, S. Bonnet, M. Congedo, C. Jutten, Multiclass brain–computer interface classification by riemannian geometry , IEEE T ransactions on Biomedical Engineering 59 (4) (2012) 920–928. doi: 10.1109/TBME.2011.2172210 . [17] I. Goodfellow , Y . Bengio, A. Courville, Deep Learning, The MIT Press, 2016. [18] P . He, G. W ilson, C. Russell, Remo val of ocular artif acts from electro- encephalogram by adaptive filtering, Medical and biological engineering and computing 42 (3) (2004) 407–412. [19] I. Jolli ff e, Principal Component Analysis, John W iley & Sons, Ltd, 2014. doi:10.1002/9781118445112.stat06472 . URL http://dx.doi.org/10.1002/9781118445112.stat06472 [20] G. E. Hinton, Connectionist learning procedures, Artificial Intelli- gence 40 (1) (1989) 185 – 234. doi:https://doi.org/10.1016/ 0004- 3702(89)90049- 0 . URL http://www.sciencedirect.com/science/article/pii/ 0004370289900490 [21] G. Cybenko, Approximation by superpositions of a sigmoidal function, Mathematics of Control, Signals and Systems 2 (4) (1989) 303–314. doi: 10.1007/BF02551274 . URL https://doi.org/10.1007/BF02551274 [22] L. Breiman, Bagging predictors, Machine Learning 24 (2) (1996) 123– 140. doi:10.1007/BF00058655 . URL https://doi.org/10.1007/BF00058655 [23] A. Barachant, et al., pyriemann: Biosignals classifica- tion with riemannian geometry, library av ailable from http: // pyriemann.readthedocs.io / en / latest / index.html (2015). URL https://github.com/alexandrebarachant/pyRiemann [24] F . Pedregosa, G. V aroquaux, A. Gramfort, V . Michel, B. Thirion, O. Grisel, M. Blondel, P . Prettenhofer, R. W eiss, V . Dubourg, J. V an- derplas, A. Passos, D. Cournapeau, M. Brucher, M. Perrot, E. Duchesnay , Scikit-learn: Machine learning in Python, Journal of Machine Learning Research 12 (2011) 2825–2830. [25] D. P . Kingma, J. Ba, Adam: A method for stochastic optimization, CoRR abs / 1412.6980. . URL [26] X. Glorot, Y . Bengio, Understanding the di ffi culty of training deep feed- forward neural networks, in: Proceedings of the thirteenth international conference on artificial intelligence and statistics, JMLR W orkshop and Conference Proceedings, 2010, pp. 249–256. [27] K. Cho, B. van Merrienboer, C ¸ . G ¨ ulc ¸ ehre, F . Bougares, H. Schwenk, Y . Bengio, Learning phrase representations using RNN encoder-decoder for statistical machine translation, CoRR abs / 1406.1078. arXiv:1406. 1078 . URL [28] I. Psorakis, T . Damoulas, M. A. Girolami, Multiclass relev ance vector machines: Sparsity and accuracy , IEEE Transactions on Neural Netw orks 21 (10) (2010) 1588–1598. doi:10.1109/TNN.2010.2064787 . [29] S. U. Amin, M. Alsulaiman, G. Muhammad, M. A. Mekhtiche, M. Shamim Hossain, Deep learning for eeg motor imagery classification based on multi-layer cnns feature fusion, Fu- ture Generation Computer Systems 101 (2019) 542 – 554. doi:https://doi.org/10.1016/j.future.2019.06.027 . URL http://www.sciencedirect.com/science/article/pii/ S0167739X19306077 [30] U. R. Acharya, Y . Hagiwara, S. N. Deshpande, S. Suren, J. E. W . K oh, S. L. Oh, N. Arunkumar, E. J. Ciaccio, C. M. Lim, Char- acterization of focal eeg signals: A review, Future Genera- tion Computer Systems 91 (2019) 290 – 299. doi:https: //doi.org/10.1016/j.future.2018.08.044 . URL http://www.sciencedirect.com/science/article/pii/ S0167739X18318818 [31] W . W ang, G. Zhang, L. Y ang, V . Balaji, V . Elamaran, N. Arunkumar , Revisiting signal processing with spectrogram analysis on eeg, ecg and speech signals, Future Generation Computer Systems 98 (2019) 227 – 232. doi:https://doi.org/10.1016/j.future.2018.12.060 . URL http://www.sciencedirect.com/science/article/pii/ S0167739X18326220 [32] R. Chatterjee, T . Maitra, S. Hafizul Islam, M. M. Hassan, A. Alamri, G. Fortino, A novel machine learning based feature selection for motor imagery eeg signal classification in internet of medical things envi- ronment, Future Generation Computer Systems 98 (2019) 419 – 434. doi:https://doi.org/10.1016/j.future.2019.01.048 . URL http://www.sciencedirect.com/science/article/pii/ S0167739X18327699 15 [33] H. T . Kim, B. Y . Kim, E. H. Park, J. W . Kim, E. W . Hwang, S. K. Han, S. Cho, Computerized recognition of alzheimer disease-eeg using genetic algorithms and neural network, Fu- ture Generation Computer Systems 21 (7) (2005) 1124 – 1130. doi:https://doi.org/10.1016/j.future.2004.03.012 . URL http://www.sciencedirect.com/science/article/pii/ S0167739X04000366 16
Original Paper
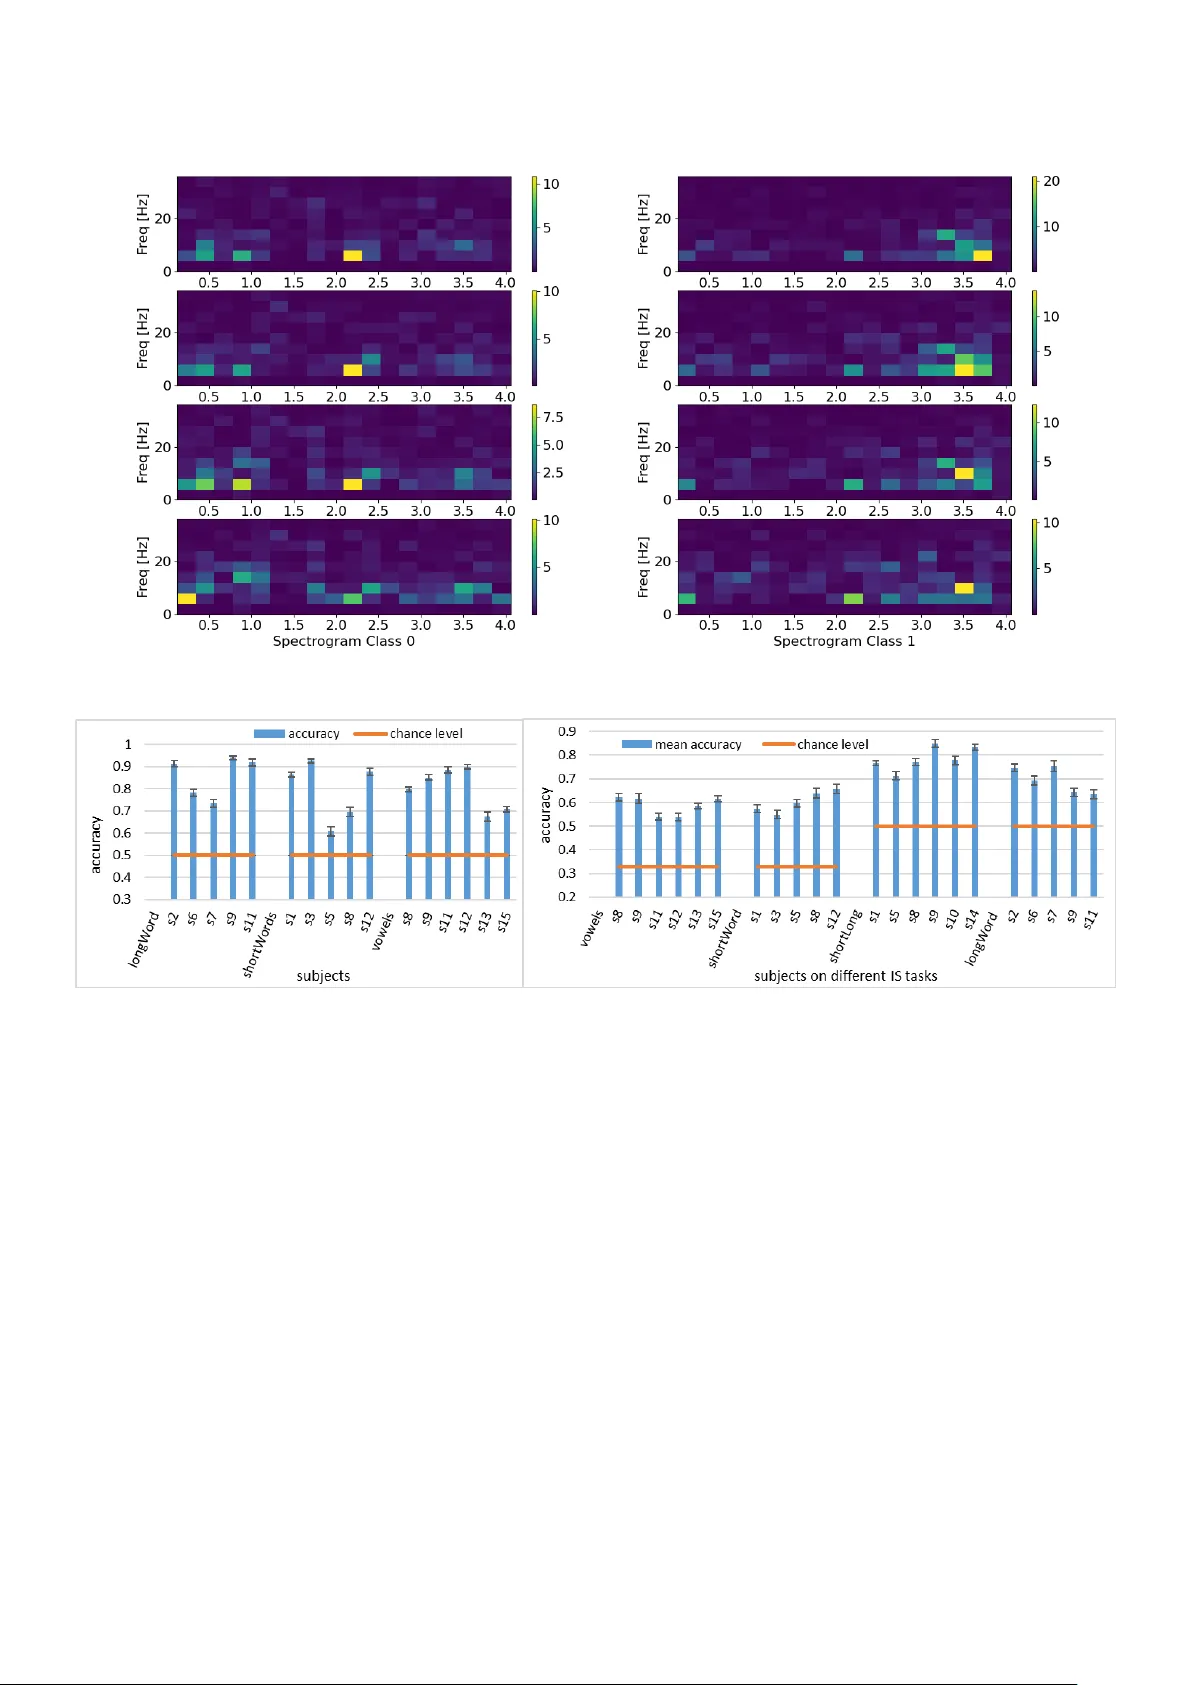
Loading high-quality paper...
Comments & Academic Discussion
Loading comments...
Leave a Comment