Quality Assessment of DIBR-synthesized views: An Overview
The Depth-Image-Based-Rendering (DIBR) is one of the main fundamental technique to generate new views in 3D video applications, such as Multi-View Videos (MVV), Free-Viewpoint Videos (FVV) and Virtual Reality (VR). However, the quality assessment of …
Authors: Shishun Tian, Lu Zhang, Wenbin Zou
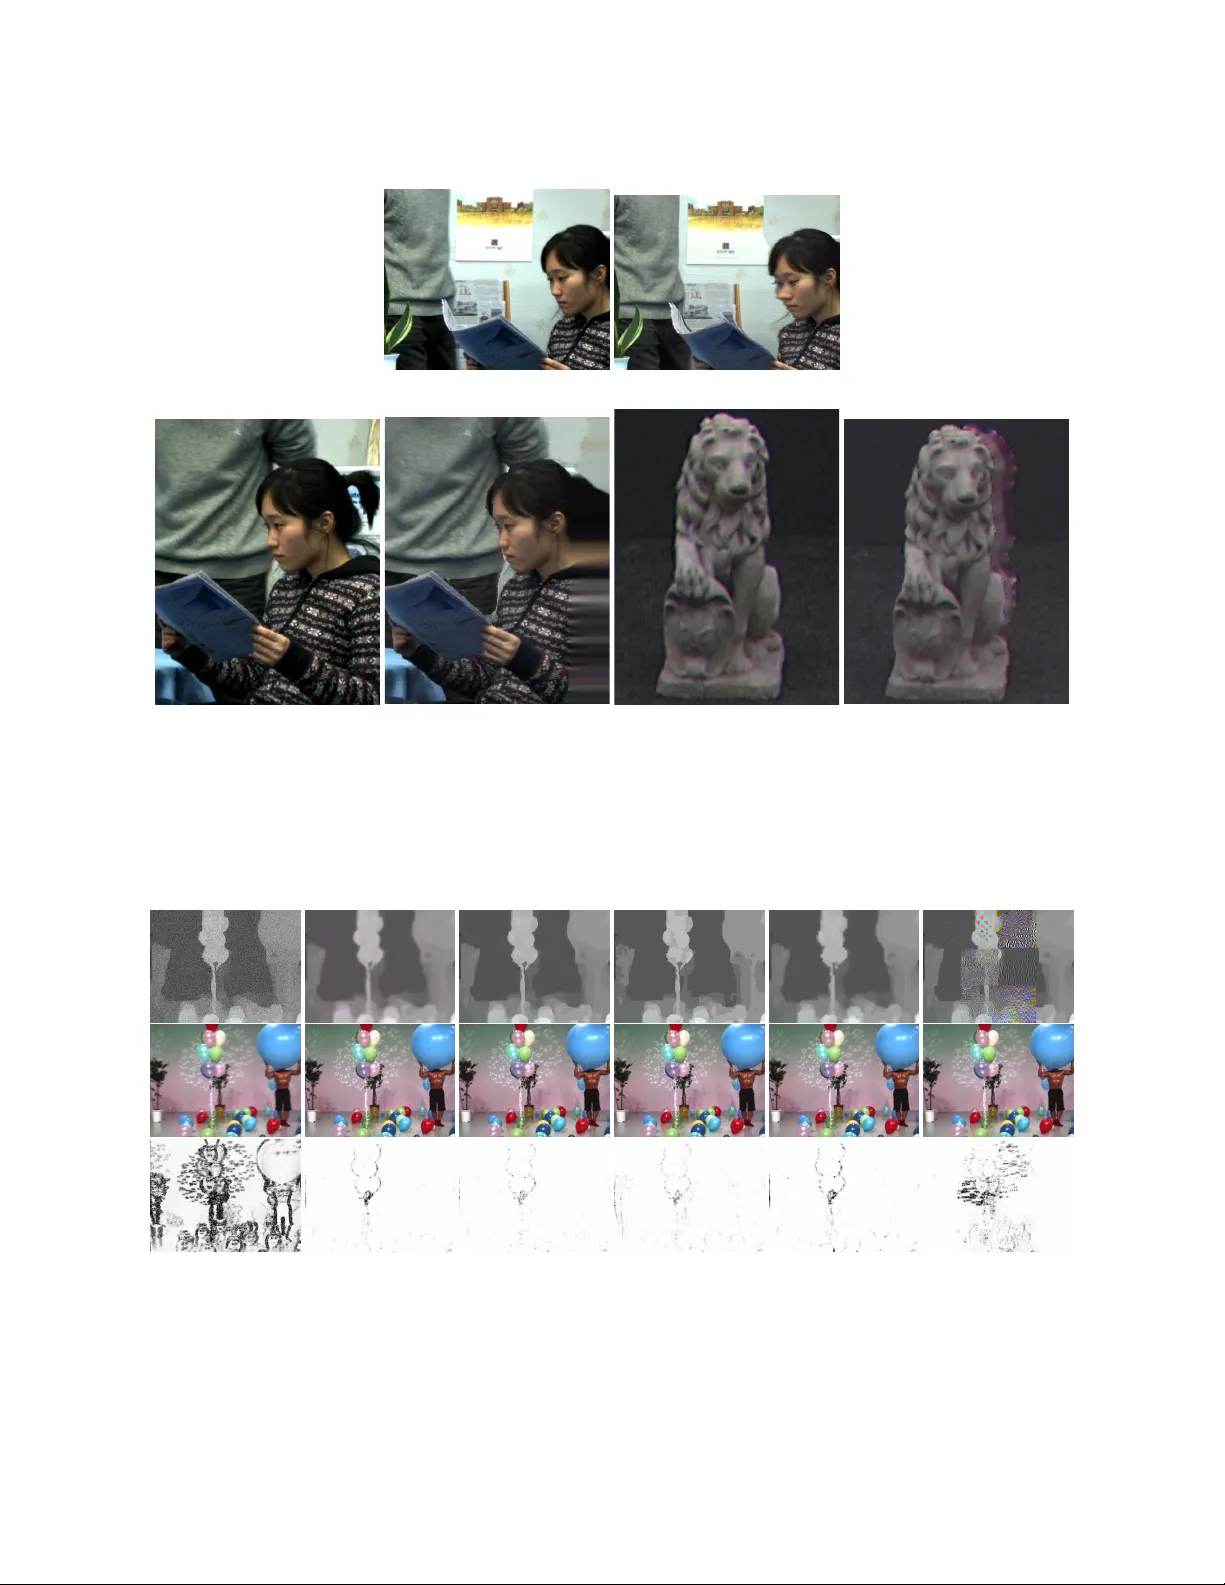
Q U A L I T Y A S S E S S M E N T O F D I B R - S Y N T H E S I Z E D V I E W S : A N O V E RV I E W Shishun T ian a,b , Lu Zhang c,d , W enbin Zou a,b , Xia Li a,b , T ing, Su e , Luce, Morin c,d , and Olivier , Déforges c,d a College of Electronics and Information Engineering, Shenzhen Uni versity , Shenzhen 518060, China. b Guangdong Ke y Laboratory of Intelligent Information Processing, Shenzhen Uni versity , Shenzhen 518060, China. c National Institute of Applied Sciences of Rennes (INSA Rennes), Rennes, France. d IETR (Institut d’Electronique et des T echnologies du num ´ Rique)„ UMR CNRS 6164, Rennes, France. e Research Center for Medical Articial Intelligence, Shenzhen Institutes of Adv anced T echnology , , Chinese Academy of Sciences, Shenzhen, Guangdong 518055, China. A B S T R A C T The Depth-Image-Based-Rendering (DIBR) is one of the main fundamental technique to generate new views in 3D video applications, such as Multi-V iew V ideos (MVV), Free-V ie wpoint V ideos (FVV) and V irtual Reality (VR). Ho wev er , the quality assessment of DIBR-synthesized views is quite different from the traditional 2D images/videos. In recent years, sev eral efforts have been made tow ards this topic, b ut there is a lack of detailed surve y in the literature. In this paper , we provide a comprehensiv e survey on various current approaches for DIBR-synthesized views. The current accessible datasets of DIBR-synthesized vie ws are firstly revie wed, follo wed by a summary analysis of the representati ve state-of-the-art objecti ve metrics. Then, the performances of dif ferent objectiv e metrics are ev aluated and discussed on all av ailable datasets. Finally , we discuss the potential challenges and suggest possible directions for future research. K eywords DIBR · Multi-view videos (MVV) · view synthesis · distortions · quality assessment 1 Introduction Providing more immersi ve e xperiences with depth perception to the observers, the 3D applications, such as the Multi- V iew V ideo (MVV) and Free-V iewpoint V ideo (FVV), hav e drawn great public attention in recent years. These 3D applications allo w the users to vie w the same scene at v arious angles which may result in a huge information redundancy and cost tremendous bandwidth or storage space. T o reduce these limitations, researchers attempt to transmit and store only a subset of these views and synthesize the others at the receiv er by using the Multivie w-V ideo-Plus-Depth (MVD) data format and Depth-Image-Based-Rendering (DIBR) techniques [ 1 , 2 ]. Only limited vie wpoints (both te xture images and depth maps) are included in the MVD data format, the other view images are synthesized through DIBR. This MVD plus DIBR scenario greatly reduces the burden on the storage and transmission of 3D video contents. Ho wev er , the DIBR vie w synthesis technique also raises ne w challenges in the quality assessment of virtual synthesized views. During the DIBR process, the pixels in the texture image at the original viewpoint are back-projected to the real 3D space, and then re-projected to the target virtual viewpoint using the depth map, which is called 3D image warping in the literature. As shown in Fig. 1, DIBR vie w synthesis can be divided into two parts: 3D image warping and hole filling. During the 3D image warping procedure, the pixels in the original vie w are w arped to the corresponding position in the target vie w . Because of the change in the viewpoint, some objects which are in visible in the original vie w may become visible in the tar get one, which is called dis-occlusion and causes black holes in the synthesized vie w . Then, the second step is to fill the black holes. The holes can be filled by typical image in-painting algorithms [ 3 ]. Most of the image in-painting algorithms use the pixels around the “black holes" to search the similar re gions in the same image, and then use this similar region to fill the “black holes". Due to the imprecise depth map and imperfect image in-painting method, v arious distortions, which are quite dif ferent from the traditional ones in 2D images/videos, may be caused. Most of the 2D objective quality metrics [ 4 , 5 , 6 , 7 , 8 ] which focus on the traditional distortions will fail to e valuate the quality of DIBR-synthesized vie ws. Subjecti ve test is the most accurate and reliable w ay to assess the quality of media content since the human observers are the ultimate users in most applications. The subjecti ve tests offer the datasets along with subjecti ve quality scores. The objective metrics are designed to mathematically model A P R E P R I N T 1 Origi na l vie w Sy nth esi zed vie w w ith ho le s Fina l sy nth esi zed vie w T ex ture im a g e De pth ima ge 3D w arp in g Ho le fill in g Figure 1: Procedure of DIBR. and predict the subjectiv e quality scores. In other words, an ideal objectiv e model is expected to be consistent with the subjectiv e results. Since the subjecti ve test is time consuming and practically not suitable for real-time applications, effecti v e objectiv e metrics are highly desired. Although se veral ef forts hav e been made tar geting at the objecti ve quality assessment of DIBR-synthesized vie ws in recent years, to the best of our knowledge, there is not a detailed surve y on these works in the current literature. In this paper , we provide a comprehensi ve surv ey on the quality assessment approaches for DIBR-synthesized views ranging from the subjectiv e to objective methods. The main contributions can be summarized as follows: (1) the state-of-the-art metrics are introduced and classified based on their approaches; (2) the metrics are analyzed deeply in terms of the contributions, adv antages and disadv antages; (3) the performances of these metrics are ev aluated on dif ferent datasets, and their performances on dif ferent type of distortions are reasoned; (4) furthermore, the limitations of current works are discussed and the possible directions for future research are giv en. The rest of this paper is or ganized as follo ws. Firstly , Section 2 introduces the DIBR view synthesis technique and analyses the vie w synthesis distortions. Secondly , the subjecti ve methods are surv eyed in Section 3. Section 4 introduces the state-of-the-art objectiv e quality metrics in detail. The experimental results are presented and discussed in Section 5. Finally , the conclusions are given in Section 6. 2 Depth-Image-Based-Rendering (DIBR) and distortion analysis As introduced in the previous section, the DIBR vie w synthesis procedure consists of two parts: 3D warping and hole filling cf. Fig. 1. Due to the lack of original texture information, various distortions may be induced in the DIBR-synthesized views which significantly degrade the image quality . In this section, we giv e a revie w of the algorithms that are designed to improve the visual quality of DIBR-synthesized vie ws, and then analyze the distortions that may occur in the DIBR-synthesized views. 2.1 Review of state-of-the-art DIBR algorithms During the 3D warping process, a lar ge number of small cracks may be induced by the numerical rounding operations of pixel positions since the corresponding pixel position in the target vie wpoint may be not an integer . These distortions mainly happen in the regions where the depth v alues are significantly different from their neighbours. Normally , these small cracks are handled by filtering the w arped depth map with a lo w-pass filter [ 9 , 10 , 11 ]. Howe ver , this may also cause slightly object shift in the synthesized views cf. Fig. 2. 2 A P R E P R I N T (a) Reference view (b) Synthesized view Figure 2: Object shifting caused by depth low-passing filter , the right borders of the character’ s faces are slightly modified. These images are from IVC DIBR image dataset [12]. Dis-occlusion hole filling also plays an important role in generating a high quality synthesized vie w . Many image in- painting algorithms ha ve been used to fill the dis-occlusion holes, such as the Criminisi’ s Examplar based algorithm [ 13 ] and the T elea’ s algorithm [ 14 ]. Howe ver , these in-painting algorithms do not consider the vie w synthesis characteristics. For e xample, the dis-occlusion regions are non-visible background objects in the original viewpoint b ut become visible in the target viewpoint. In other words, the dis-occlusion regions should be filled with background content. Face this issue, many studies [ 15 , 16 , 9 ] tried to extend the main idea of these image in-painting methods to DIBR view synthesis. Oliveira [ 15 ] extends the Criminisi’ s image in-painting method by changing the hole filling order with depth information. The texture propagation is enforced from the background to the foreground. Muddala [ 16 ] constrains the confidence and data terms to the background areas and local information. Ahn [ 9 ] improves the Criminisi’ s image in-painting method by optimizing the filling priority and the patch-matching measure. The optimized matched patch is selected only through the data term on the background areas which are e xtracted using warped depth map. It greatly reduces the ghost effect in the DIBR-synthesized vie ws. Instead of optimizing the priorities and searching regions of in-painting method, [ 10 , 17 ] try to reconstruct the background content and then use the reconstructed background to eliminate the dis-occlusion holes in the virtual viewpoint. Jantet et al. proposed an object-based Layered Depth Image (LDI) representation to improve the quality of virtual synthesized vie ws [ 10 ]. They firstly segment the foreground and background based on a region growing algorithm, which allows organising the LDI pixels into two object-based layers. Once the extracted foreground is obtained, an in-painting method is used to reconstruct the complete background image on both depth and texture images. Luo et al. proposed a hole filling approach for DIBR systems based on background reconstruction [ 17 ]. The foreground is firstly removed by using morphological operations and random walker segmentation. Then, the background is reconstructed based on motion compensation and a modified Gaussian Mixture model. All the DIBR vie w synthesis algorithms introduced above are single vie w based synthesis method. They use only one neighbouring vie w to extrapolate the synthesized vie ws. Differently , the intervie w algorithms use two neighbouring views to synthesize the virtual viewpoint images. The most popular interview synthesis method would be the V ie w Synthesis Reference Software (VSRS) [ 11 ] which has been adopted by the MPEG 3D video Group. The depth discontinuity artefacts are firstly solv ed by performing a post-filter on the projected depth map. Then, the in-painting method proposed in [ 14 ] is used to fill the holes in the dis-occluded re gions. Note that this approach is primarily used in the inter-vie w synthesis applications which only have small holes to be filled, but it can also be used in single view based rendering cases. Instead of in-painting the warped images directly , [ 18 ] focuses on the use of the occluded information to identify the relev ant background pixels around the holes. Firstly , the occluded background information is registered in both texture and depth during 3D warping. Then, the un-occluded background information around the holes is extracted based on the depth map. After that, a virtual image is generated by integrating the occluded 3 A P R E P R I N T (a) single view based mode (b) interview mode Figure 3: Examples of images synthesized by VSRS using single vie w based synthesis mode and intervie w synthesis mode. These images are from IETR DIBR image dataset [19]. background and un-occluded background information. The dis-occluded holes are filled based on this generated image with the help of a depth-enhanced Criminisi’ s in-painting method and a simplified block-averaged filling method. W ith more information, the interview synthesis cases only have smaller dis-occlusion regions to be filled, they thus outperform the single vie w based vie w synthesis methods in most circumstances. Ho wev er , due to the inaccurac y of depth map, the same object in the tw o base vie ws could be rendered to dif ferent positions which results in a “ghost” effect in the synthesized vie w . This phenomenon does not happen in the single view base synthesis method. As shown in Fig. 3, there exists a “ghost” ef fect of the “chat flo w” on the board marked by red block in (b); b ut according to the synthesized content marked by red circle, the intervie w synthesis method (b) works better than the single vie w based one (a) in generating the object texture. 2.2 Distortion analysis Imperfect hole filling methods may induce various distortions in the DIBR-synthesized vie ws, such as object warping, stretching and blurry regions, cf. Fig. 4. Fig. 4 (a), (b) gi ve an e xample of object warping distortion caused by T elea’ s image in-painting algorithm [ 14 ]. It could be observed that the “newspaper” and the “girl’ s nose” are extreme warped. The stretching distortion (the “girl’ s hair and clothes”) mainly happen in the out-of-field areas cf. Fig. 4 (c), (d). The blurry regions can be noticed around the sculpture in Fig. 4 (e), (f). Depth map represents the distance of objects to the camera. It is composed of a series of flat homogeneous regions and sharp edges. The flat areas indicate the objects at a certain distance while the edges relate to the transition of foreground and background objects. This is quite different from the natural scene images. In DIBR view synthesis, depth maps are used to guide the 3D warping. The distortions in the depth map will certainly induce degradations in the DIBR-synthesized views. In order to analyze the effect of depth distortions on the quality of DIBR-synthesized vie ws, we compare the images that are synthesized with undistorted depth map and depth maps with v arious distortions. As shown in Fig. 5, we can easily observe that most of the distortions distrib ute around the edge regions of the depth map. It is logical that the edge of depth map represents the transition of foreground and background objects, the noise in these edge regions will certainly cause aliasing of foreground and background texture. Besides, we also notice that the synthesized view quality is more sensiti ve to high-frequency distortions ( e.g. additi ve white noise (A WN), transmission loss) in the depth map compared to the lo w-frequency distortions ( e.g. Gaussian blur). The main reason would be that high-frequency distortions in depth map will cause great local shift in the synthesized vie w , which is much more annoying to human vision system and can be easily penalized by pixel-based IQA metrics. 3 Subjective image/video quality assessment of DIBR-synthesized views Subjectiv e test is the most direct method for image/video quality assessment. During the test, a group of human observers are asked to rate the quality of each tested image or video. The subjectiv e test results obtained from the 4 A P R E P R I N T (a) Reference view (b) Synthesized view (object w arping) (c) Reference view (d) Synthesized view (stretching) (e) Reference view (f) Synthesized view (blurry re gion) Figure 4: Example of distortions caused by imperfect image in-painting method. These images are from IVC DIBR- image dataset [12]. (a) A WN (b) Gaussian blur (c) JP2K (d) JPEG (e) Sampling blur (f) T ransmission loss Figure 5: Example of synthesized images using depth map with different distortions. The first row sho ws the distorted depth maps while the second ro w gi ves the DIBR-synthesized images using the corresponding distorted depth maps. The third row presents the SSIM maps between the synthesized and reference images. Note that, the reference images are the images synthesized with undistorted depth maps. These images are from MCL-3D image dataset [20]. 5 A P R E P R I N T subjectiv e ratings are recognized as the quality of the tested images/videos. In different subjecti ve test methodologies, the acquisition of subjectiv e scores is also dif ferent. The Absolute Category Rating (A CR) method used in IVC image / video datasets [ 12 , 21 ] randomly present the test sequences to the observers and ask them to rate on five-scales quality judgement (excellent, good, fair , poor, bad). The subjectiv e quality scores are calculated by simply av eraging the ratings. The Single Stimulus Continuous Quality Evaluation (SSCQE) in SIA T [ 22 ] dataset allows the observer to rate on a continuous scale instead of a discrete fiv e-scales e valuation. The IVY [ 23 ] image dataset uses the Double Stimulus Continuous Quality Scale (DSCQS). The test image along with its associated reference image are presented in succession. It is usually used when the test and reference images are similar . P airwise Comparison (PC) method directly performs a one-to-one comparison of e v ery image pair in the dataset. It is the most accurate and reliable way to get the subjecti ve quality scores, b ut it takes too much time since all the image pairs need to be tested. The Subjecti ve Assessment Methodology for VIdeo Quality (SAMVIQ) method used in IETR dataset can achieve much higher accurac y than ACR method for the same number of observers. It takes less time than PC since it allows the observer to freely vie w sev eral image multiple times and adopts a continuous rating scale. Besides, the IVY [ 23 ], IETR [ 19 ] and SIA T datasets normalize the obtained scores to z-score to make the results more intuiti ve. The IVC and MCL-3D [ 20 ] datasets directly use the av erage scores. Except for the subjectiv e test methodology , as shown in T able 1, they use dif ferent sequences, DIBR algorithms, etc. In the following part, we will introduce them respectiv ely in detail. 3.1 IVC DIBR datasets The IVC DIBR-image dataset [ 12 ] was proposed by Bosc et al. in 2011. It contains 84 DIBR-synthesized view images synthesized by 7 DIBR algorithms [ 1 , 14 , 24 , 25 , 26 , 27 , 28 ]. 3 Multi-view plus Depth (MVD) sequences, BookArri v al , Lov ebird1 and Newspaper , are extracted as the source contents. For each sequence, 4 virtual views are synthesized from the adjacent viewpoint by using the abov e algorithms. Note that in this dataset, virtual views were only generated by single-vie w-based synthesis, which means that the virtual view is synthesized with only one image and its associated depth map. The IVC DIBR-video dataset [ 21 ] uses almost the same contents and methodologies except that it adds the H.264 compression (with 3 quantization levels) distortion for each test sequence. In other words, there are 93 distorted videos in this dataset, among which 84 ones only contain the DIBR vie w synthesis distortions. As one of the first DIBR related image datasets, the IVC datasets play an important role in the first research phase of this topic. Howe v er , because of the fast de velopment of DIBR vie w synthesis algorithms, some of the distortions in these datasets do not exist an y more in the state-of-the-art view synthesis algorithms. 3.2 IETR DIBR image dataset Similar to the IVC datasets, the IETR dataset [ 19 ] is dedicated to in v estigate the DIBR vie w synthesis distortions as well. Compared to the IVC datasets, it uses more and newer DIBR view synthesis algorithms [ 13 , 10 , 9 , 17 , 29 , 24 , 18 ], includes both intervie w synthesis and single view based synthesis, and excludes some “old fashioned” distortions, e.g. “black holes”. In addition, the IETR dataset also uses more MVD sequences, of which 7 sequences ( Balloons , BookArriv al , Kendo , Lovebird1 , Newspaper , Poznan Street and PoznanHall ) are natural images and 3 sequences ( Undo Dancer , Shark and Gt_Fly ) are computer animation images. It contains 140 synthesized vie w images and their associated 10 reference images which are also captured by real cameras at the virtual viewpoints. 3.3 IVY stereoscopic image dataset Jung et al. proposed the IVY stereoscopic 3D image dataset for the quality assessment of DIBR-synthesized stereoscopic images [ 23 ]. Different from the abov e two datasets, in addition to the DIBR view synthesis distortion, the IVY dataset explores binocular perception [ 30 , 31 ] by sho wing the synthesized image pairs on a stereoscopic display . A total of 7 sequences and three MVD sequences are selected. 84 stereo images are synthesized by four DIBR algorithms [ 13 ], [ 9 ], [ 11 ], [ 32 ] in this dataset. All the virtual vie w images in the IVY dataset are generated by single-vie w-based synthesis methods. 3.4 MCL-3D image dataset Song et al. proposed the MCL-3D stereoscopic image dataset [ 20 ] to ev aluate the quality of DIBR-synthesized stereoscopic images. Although 4 DIBR algorithms are included, the number of images synthesized by these algorithms is quite limited (36 pairs). The major part of this dataset focuses on the traditional distortions in the synthesized views. 6 types of traditional distortions are considered in this dataset: additive white noise, Gaussian blur , do wn sampling blur, JPEG, JPEG2000 and transmission loss. Nine MVD sequences are collected, among which Kendo , 6 A P R E P R I N T T able 1: Summary of existing DIBR related datasets. Name Sequence Resolution Method. DIBR algos Other No. Ref. Disp. Name Y ear distortions PVS 1 IVC DIBR-image BookArriv al 1024 × 768 A CR 2 Fehn’ s 2004 None 84 Ori. 2D Lov ebird1 1024 × 768 T elea’ s 2003 Newspaper 1024 × 768 VSRS 2009 Müller 2008 PC 3 Ndjiki-Nya 2010 Köppel 2010 Black hole — IVC DIBR-video idem A CR 2 idem H.264 93 Ori. 2D IETR-image BookArriv al 1024 × 768 SAMVIQ 4 Criminisi 2004 None 140 Ori. 2D Lov ebird1 1024 × 768 VSRS 2009 Newspaper 1024 × 768 LDI 2011 Balloons 1024 × 768 HHF 2012 Kendo 1024 × 768 Ahn’ s 2013 Dancer 1920 × 1088 Luo’ s 2016 Shark 1920 × 1088 Zhu’ s 2016 Poznan_Street 1920 × 1088 PoznanHall2 1920 × 1088 GT_fly 1920 × 1088 IVY image Aloe 1280 × 1100 DSCQS 5 Criminisi 2004 None 84 Ori. Stereo. Dolls 1300 × 1100 Ahn’ s 2013 Reindeer 1300 × 1100 VSRS 2009 Laundry 1300 × 1100 Y oon 2014 Lov ebird1 1024 × 768 Newspaper 1024 × 768 BookArriv al 1024 × 768 MCL-3D image Kendo 1024 × 768 PC 3 Fehn’ s 2004 Additiv e White Noise 684 Syn. Stereo. Lov ebird1 1024 × 768 T elea’ s 2003 Blur Balloons 1024 × 768 HHF 2012 Do wn Sampling Dancer 1920 × 1088 Black hole — JPEG Shark 1920 × 1088 JPEG2k Poznan_Street 1920 × 1088 T rans. Loss 9 PoznanHall2 1920 × 1088 GT_fly 1920 × 1088 Microw orld 1920 × 1088 SIA T video BookArriv al 1024 × 768 SSCQE 6 VSRS 2009 3D V -A TM 140 Ori. 2D Balloons 1024 × 768 Kendo 1024 × 768 Lov ebird1 1024 × 768 Newspaper 1024 × 768 Dancer 1920 × 1088 PoznanHall2 1920 × 1088 Poznan_Street 1920 × 1088 GT_fly 1920 × 1088 Shark 1920 × 1088 1 PVS: Processed V ideo Sequences. 2 A CR: Absolute Categorical Rating. 3 PC: Pairwise Comparison. 4 SAMVIQ: Subjectiv e Assessment Methodology for VIdeo Quality . 5 DSCQS: Double Stimulus Continuous Quality Scale. 6 SSCQ: Single Stimulus Continuous Quality Scale. 7 A P R E P R I N T Real v i ew Referenc e Real v i ew (features) Referenc e Real v i ew Referenc e (a) FR metri c s (b) RR metri c s (c) Si de v i ew bas ed FR metri c s (d) NR metri c s Real v i ew V i rtual v i ew V i rtual v i ew Real v i ew Real v i ew V i rtual v i ew Real v i ew V i rtual v i ew Figure 6: Categories of quality assessment metrics for DIBR-synthesized vie ws. Lov ebird1 , Balloons , PoznanStreet and PoznanHall2 are natural images; Shark , Microworld , GT_Fly and Undodancer are Computer Graphics images. For each sequence, these traditional distortions are first applied on the base vie ws. Then, the left and right view images are synthesized from these distorted base view images by using the view synthesis reference software (VSRS) [ 24 ]. Different from the abov e IVC, IETR and IVY datasets, the reference images in the MCL-3D dataset are the images synthesized from undistorted base vie w images instead of the ones captured by real cameras. 3.5 SIA T synthesized video dataset The SIA T synthesized video dataset [ 22 ] focuses on the distortions caused by compressed texture and depth images in the synthesized views. It uses the same 10 MVD sequences as the IETR image dataset. For each sequence, 4 dif ferent texture and depth image quantization lev els and their combinations are applied on the base views. Then, the videos at the virtual viewpoints are synthesized using the VSRS-1D-Fast software [ 33 ]. This dataset uses the real images (captured by real cameras at the virtual viewpoint) as references. Only interview synthesis is used in this dataset. In the abov e datasets, the distortions in the DIBR-synthesized views come from not only the DIBR vie w synthesis algorithms, b ut also from the distorted texture and depth images. The IVC [ 34 , 12 , 21 ], IVY [ 23 ] and IETR [ 19 ] datasets focus on the distortions caused by dif ferent DIBR vie w synthesis algorithms; while the MCL-3D [ 20 ] and SIA T [ 22 ] datasets explore the influence of traditional 2D distortions of original texture and depth map on the DIBR-synthesized views. These datasets were usually used to e valuate and v alidate sev eral quality metrics. In the next section, we will introduce the objectiv e approaches for the quality assessment of DIBR-synthesized vie ws. 4 Objective image/video quality assessment of DIBR-synthesized views Sev eral methods ha ve been proposed to e v aluate the quality of DIBR-synthesized vie ws in the past decade. Based on the amount of reference information, these methods can be di vided into 4 categories: Full-reference (FR), Reduced- reference (RR), Side V iew based Full-reference (SV -FR) and No-reference (NR), as shown in Fig. 6. The FR methods use the original undistorted image/video at the virtual viewpoint as reference to assess the quality of synthesized views, while the RR methods only use some features extracted from the original reference. Especially , the SV -FR methods use the undistorted image/video at the original viewpoint, from which the virtual vie w is synthesized, as the reference. The NR methods need no access to the original image/video. T able 2 classifies the metrics based on their used approaches. Most of them (VSQA, MP-PSNR, MW -PSNR, EM-IQA and CT -IQA) e valuate the quality of synthesized vie ws by considering the contour or gradient degradation between the synthesized and the reference images which is one of the most annoying characteristics of geometric distortions. Meanwhile some metrics (DSQM, 3DSwIM) calculate the quality score by comparing the extracted perceptual features between the synthesized and the reference images. Especially , the APT metric uses a local image description model to reconstruct the synthesize image, and e v aluates the quality of the synthesized vie w based on the reconstruction error . These metrics are introduced as follows. 8 A P R E P R I N T T able 2: Overvie w of the e xisting metrics. The features in the first column indicate hand-craft feature (HF), deep feature (DF), contour/gradient (C/G), JND, Multi-scale decomposition (MSD), local image description (LID), depth estimation (DE), dis-occlusion Region (DR), Sharpness Ev aluation (SE), Shift compensation (SC), Image comple xity (IC), ML (Machine Learning). Metric Approach HF DF C/G JND MSD LID DE DR SE SC IC ML FR Bosc et al. 2012 [35] - - X - - - - - - - - - VSQA [36] - - X - - - - - - - - - 3DSwIM [37] X - - - - - - - - X - - MW -PSNR [38, 39] X - - - X - - - - - - - MP-PSNR [40] X - - - X - - - - - - - CT -IQA [41] X - - - - - - - - - - - ST -SIA Q [42] X - X - - - - - - X - - EM-IQA [43] X - X - - - - - - X - - PSPTNR [44] - - - X - - - - - - - - VQA-SIA T [22] - - X - - - - - - X - - SR-3D VQA [45] - - X - - - - - - X - X SDRD [46] - - - - - - - X - X - - SCDM [47] - - - - - - - X - X - - SC-IQA [48] - - - - - - - - - X - - CB A [23] - - - - - - - X - - - - Zhou [49] X - X - X - - - - - - X Ling [50] X - X - - - - - - - - X W ang [51] X - X - - - - X X - - - RR MP-PSNRr [52] X - - - X - - - - - - - MW -PSNRr [52] X - - - X - - - - - - - RRLP [53] - - X - - X - - X - - - Depth IQA FR/RR/NR (FR) Li [54] - - X - - - - - - - - (RR) RR-DQM [55] - - X - - X - - - - - - (NR) BDQM [56] - - X - - - - - - - - - (FR) Xiang [57] - - X - - - - - - - - - (NR) SEP [58] X - X - - - - - - - - X SV -FR 3VQM [59] - - - - - - X - - - - - LOGS [60] - - - - - - - X X X - - DSQM [61] X - - - - - - - - X - - SIQE [62] X - - - - - - - - X - - SIQM [63] X - - - - - - - - X - - NR APT [64] - - - - - X - - - - - - OUT [65] - - - - - X - - - - - - MNSS [66] X - - - X - - - - - - X NR_MWT [67] X - X - X - - - X - - - NIQSV [68] - - X - - X - - - - - - NIQSV+ [69] - - X - - X - - - - - - HEVSQP[70] - - X - - - - - - - - X CLGM [71] - - X - - - - X X - - - GDIC [72] X - X - - - - - - - X - W ang [73] X - X - - - - - X - X - SET [74] X - X - X - - - - - - X CTI [75] - - - - - - - - - X - - FDI [76] - - X - - - - - - X - - CSC-NRM [77] - - - - - - - - - - - X SIQA-CFP [78] - X - - - - - - - - - X GANs-NRM [79] - X - - - - - - - - - X 9 A P R E P R I N T 4.1 FR and RR metrics In this subsection, we revie w 20 well-kno wn FR metrics and 4 RR metrics. 4.1.1 Edge/Contour based FR metrics The distortions in DIBR-synthesized vie ws are mostly geometrical and structural distortions, which may degrade the object shape in the synthesized image. It can be measured by the change of object edges. In addition, the sharp edges in the depth map may also induce large dis-occlusions in the synthesized vie ws which may result in dramatic distortions. Thus, a few edge-based methods ha ve been proposed to e v aluate the quality of DIBR-synthesized vie ws. The FR metric proposed by Bosc et al. in [ 35 ] indicates the structural degradations by calculating the contour displacement between the synthesized and the reference images. Firstly , a Cann y edge detector is used to e xtract the image contours; then, the contour displacements between the synthesized and reference images are estimated. Based on the contour displacement map, three parameters are computed: the mean ratio of inconsistent displacement vectors per contour pixel, the ratio of inconsistent v ectors, the ratio of ne w contours. The final quality score is obtained as a weighted sum of these three parameters. In [ 42 ], Ling et al. proposed a contour-based FR metric ST -SIA Q for the quality assessment of DIBR-synthesized views. Instead of directly using the contour information in [ 35 ], ST -SIA Q uses mid-lev el contour descriptor called “Sk etch T oken” [ 80 ]. The “Sketch T oken” stands as a codebook of image contour representation, of which each dimension can be recognized as the possibility which indicates how likely the current patch belongs to one certain category of contour from the codebook. T o reduce the shifting ef fect in the feature comparison stage, the patches in the reference image are firstly matched to the synthesized image. The “Sketch T oken” is clustered into 151 cate gories, which means the “Sketch T oken” descriptor has 151 dimensions. A Random F orests decision model associated with a set of low-le v el features (including oriented gradient channels [ 81 ], color channels, and self-similarity channels [ 82 ]) is used to obtain the “Sketch T oken” descriptor . The geometric distortion strength in the synthesized vie w is calculated as the Kullback Leibler div ergence of “Sk etch T oken” descriptors between the synthesized and reference images. In [ 83 ], this metric is improv ed to ev aluate the quality of DIBR-synthesized videos by considering the temporal dissimilarity . Ling et al. also proposed another contour-based FR metric EM-IQA in [ 43 ]. Different from ST -SIA Q metric, EM-IQA uses an interest points matching and an elastic metric [ 84 ], instead of block matching and “Sketch T oken” descriptor , to compensate the shifting and ev aluate the contour degradation respecti vely . After the interest points matching, a Simple Linear Iterati ve Clustering (SLIC) is used to e xtract the contours in the image. SLIC is originally proposed for image segmentation. In the EM-IQA metric, the boundaries of the segmented objects are considered as contours. Then, the elastic metric proposed in [ 84 , 85 ] is used to finally measure the degradation between the contours of synthesized and reference images, which provides the quality score of DIBR-synthesized vie w . In [ 41 ], Ling et al. proposed a v ariable-length context tree based image quality assessment metric CT -IQA, dedicated to quantify the ov erall structure dissimilarity and dissimilarities in various contour characteristics. Firstly , the contours of the reference and synthesized images are con verted to dif ferential chain code (DCC) [ 86 ] which represents the direction of object contours. Then, an optimal context tree [ 87 ] is learned from the DCC in the reference image. The overall structural dissimilarity is calculated by subtracting the encoding cost of DCC in the synthesized image and reference images. In addition, the overall dissimilarity in contour characteristics is also obtained by measuring the difference of total contour number, total contour start information and total number of symbols between the reference and synthesized image. The final quality score is calculated by combining the overall structure dissimilarity and contour characteristics dissimilarity . Liu et al. proposed a gradient-based FR video quality assessment metric VQA-SIA T [ 22 ] by considering the “ Activity” and “Flickering” which is the most annoying temporal distortion in the DIBR-synthesized vie ws. The main contribution of this metric is the two follo wing proposed structures: Quality Assessment Group of Pictures (QA-GoP) and Spatio- T emporal (S-T) tube. The QA-GoP acts as a process unit on a whole video sequence, it contains a group of 2N+1 frames (N frames before and N frames after the central frame). Besides, a block matching method is used to search the corresponding blocks of the central frame blocks in the forward and backw ard frames. The 2N + 1 blocks along the motion trajectory construct a S-T tube. The distortion of “ Activity” is calculated from the dif ference of the spatial gradient in the (S-T) tube and (QA-GoP) between the synthesized and reference videos. The “Flickering” distortion is measured from the difference of temporal gradient, which is defined belo w: ~ 5 I temporal x,y ,i = I ( x, y, i ) − I ( x 0 , y 0 , i − 1) , (1) where ( x 0 , y 0 ) is the coordinate in frame i − 1 corresponding to ( x, y ) along the motion trajectory in the previous frame i . The final quality score of DIBR-synthesized view video is obtained by inte grating both “ Acti vity” and “Flickering” distortions. 10 A P R E P R I N T Furthermore, in [ 45 ], Zhang et al. proposed a FR metric SR-3DVQA combining the “ Acti vity” measurement module in VQA-SIA T with a sparse representation-based flicker estimation method. In the SR-3DVQA metric, a DIBR-synthesized video is treated as a 3D volume data by stacking the frames sequentially . Then, the volume data is decomposed as a number of spatially neighboring temporal layers i.e. X-T or Y -T planes, where X, Y are the spatial coordinate and T is the temporal coordinate. In order to effecti vely e v aluate the flicker distortion in the synthesized video, the gradient in the temporal layers and sharp edges in the associate depth map are extracted as key features for the dictionary learning and sparse representation. The rank-based method in [ 60 ] is used to pool the flick er score from the temporal layers. The final quality score is calculated by combining the flicker score and “ Acti vity” score in the previous VQA-SIA T [22]. Jakhetiya et al. proposed a free-energy-principle-based IQA metric RRLP for Screen Content and DIBR-synthesized vie w images based on prediction model and distortion categorization [ 53 ]. The image quality is measured by calculating the disorder and sharpness similarity between the distorted and reference images. The disorder is obtained from a prediction model. As shown in Eq. 2, an observation-model-based bilateral filter (OBF) [ 88 ] is firstly used to divide the predicted and disorder parts. ˆ X d i = X d i λ + P k ∈ N i ω k i I k i λ + P k ∈ N i ω k i (2) where ˆ X d i represents the predicted part, I k i and ω k i are respectively the pixels and their associated weights in the surrounding 3 × 3 window N i of the i th pix el, λ is a parameter . The disorder part is computed as the dif ference between the predicted part and the original image: R d i = | ˆ X d i − X d i | (3) Then, the sharpness (edge structures) is calculated by four filters in[ 89 ]. Finally , the disorder and sharpness similarity between the distorted and reference images are estimated by using the similarity function in SSIM [4]. 4.1.2 W avelet transf orm based FR metrics In the previous part, we introduced the metrics that use the edge/contour in luminance domain to ev aluate the geometric distortions in DIBR-synthesized vie ws. According to previous research, the wa velet transform representation can not only capture the image edges, b ut also some other texture unnaturalness. In this part, the wav elet transform based FR metrics will be revie wed. Battisti et al. proposed an FR metric (3DSwIM) for DIBR-synthesized views based on the comparison of statistical features of wav elet sub-bands [ 37 , 90 ]. The same as EM-IQA [ 43 ] and VQA-SIA T [ 22 ], 3DSwIM uses a block matching to ensure the “shifting-resilience”. The distortions in each block of the synthesized view is measured by the K olmogorov-Smirno v [ 91 ] distance between the histograms of the matched blocks in the synthesized and reference images. In addition, since the Human V ision System (HVS) pays more attention on the human body , a skin detector is used to weight the skin regions in the matched blocks. Sandi ´ c-Stankovi ´ c et al. proposed another multi-scaled decomposition based FR metric MW -PSNR [ 39 , 38 ]. The MW -PSNR uses morphological wa velet filters for decomposition. Then a multi-scale wav elet mean square error (MW -MSE) is calculated as the average MSE of all sub-bands and finally the MW -PSNR is calculated from it. The wa velet transform based FR metrics can be recognized as a kind of edge/contour based metrics. For example, the higher sub-bands of the wav elet transformed image represent the edge information of the original image. Compared to the pixel le vel edge/contour used in the pre vious subsection, the metrics in this subsection use the features in w av elet transformed domain to represent both the image edges and other characteristics. 4.1.3 Morphological operation based FR metrics Morphological operations are widely used in image processing, especially a couple of erosion and dilation operations can be used to detect the image edges [ 92 ]. In [ 40 ], Sandi ´ c-Stankovi ´ c et al. proposed the MP-PSNR based on multi-scaled pyramid decomposition using morphological filters. The basic erosion and dilation operations used in MP-PSNR are calculated as maximum and minimum in the neighbourhood defined by the structure element, as sho wn in the follo wing equation: D : dil ation S E ( f )( x ) = max y ∈ S E f ( x − y ) (4) E : er osion S E ( f )( x ) = min y ∈ S E f ( x + y ) (5) where f is a gray-scale image and S E is binary structure element. Then, they use the Mean Square Error (MSE) between the reference and synthesized images in all pyramids’ sub-bands to quantify the distortion. As shown in Fig 7, during the decomposition, the dilation is used as expanding operation and the erosion is used as reducing operation. 11 A P R E P R I N T R educ e / er o s i o n + D own - s a m pl i n g Up - s a m pl i n g S j S j + 1 S ’ j - + D j Figure 7: Decomposition scheme of MP-PSNR. S j represents the image at scale j ( j ∈ [1 , 5] ), D j represent the detail image at scale j [40]. The detail image of each scale is calculated as the difference between the original and processed (erosion and dilation) images. Finally , the ov erall quality is calculated by averaging the MSE of detail images in all the sub-bands and expressing it in terms of PSNR. In [ 52 ], Sandi ´ c-Stankovi ´ c et al. also proposed the reduced version of MP-PSNR, and MW -PSNR. Only detail images from higher decomposition scales are taken into account to measure the difference between the synthesized image and the reference image. The reduced version achie v ed significant improv ement ov er the original FR metrics with lo wer computational complexity . 4.1.4 Dis-occlusion region based FR metrics Since the DIBR vie w synthesis distortions mainly occur in the dis-occlusion regions, some of the FR metrics impro ve the performance of 2D FR metrics by using dis-occlusion maps[46, 47] instead of using weighting maps. The SDRD metric proposed by Zhou in [ 46 ] detects the dis-occlusion regions by simply comparing the absolute difference between the synthesized and reference images. Before that, a self-adaptive scale transform model is used to eliminate the ef fect of view distance, and a SIFT flo w-based warping is adopted to compensate the global shift in the synthesized view image. The final quality score is obtained by weighting the dis-occlusion regions with their size since the distortions with bigger size are more annoying to human vision system. T ian et al. proposed a full-reference quality assessment model (SCDM) for 3D synthesized views by considering global shift compensation and dis-occlusion regions [ 47 ]. This model can be used on any pixel-based FR metrics. SCDM firstly compensates the shift by using a SURF + RANSA C approach instead of the SIFT flow used in SDRD. Then, the dis-occlusion regions are directly e xtracted from the depth map. It is more precise and uses more resources compared to SDRD. The final quality score is obtained as a weighted PSNR or weighted SSIM. It is reported to improve the performance of PSNR and SSIM by 36.85% and 13.33% in terms of Pearson Linear Correlation Coef ficients (PLCC). Since the distortions in the DIBR-synthesized views are not restricted in the dis-occlusion regions only , they may occur around these regions as well. In [ 51 ], W ang et al. proposed a critical region based metric by dilating the dis-occlusion region with a morphological operator . Similar to SDRD, the dis-occlusion re gion map is extracted by a SIFT -flow based approach. Then a Discrete Cosine Transform (DCT) decomposition method is used to partition and classify the critical regions into edge blocks, te xture blocks and smooth blocks. Based on the perceptual properties of these three types of blocks, their distortions are measured differently . The edge and texture blocks contain more complex edges or te xture information, the blur distortions in these re gions would be much more annoying than that in the smooth regions. On the other hand, the smooth re gions are sensitiv e to color de gradations. Thus, the texture similarity and color contrast similarity between the synthesized and reference images are calculated to measure the local distortions in the edge, texture and smooth blocks respectively . Finally , a global sharpness detection is combined with the local distortion measurement to obtain the ov erall quality score. 4.1.5 2D related FR metrics The main reason of the inef fecti veness of 2D quality assessment metrics on DIBR-synthesized vie ws can be analyzed as follows. Firstly , there are large object shifts in the synthesized vie ws and this kind of shifts can be easily penalized by 2D metrics ev en though the HVS is not sensiti ve to the global shift in the image. The second reason is the distribution of distortions. The distortions in traditional 2D images often scatter over the whole image while the DIBR view synthesis distortions are mostly local, mainly in the dis-occluded regions. The 2D related metrics are based on the traditional 2D 12 A P R E P R I N T FR metrics, e.g. PSNR, SSIM, etc. They try to improv e the performance of 2D metrics by considering HVS and the characteristics of DIBR view synthesis distortions. The VSQA metric proposed by Conze et al. in [ 36 ] tries to improv e the performance of SSIM [ 4 ] by taking advantage of known characteristics of the HVS. It aims to handle areas where disparity estimation may fail, such as thin objects, object borders, transparency, by applying three weighting maps on the SSIM distortion map. The main purpose of these three weighting maps is to characterize the image complexity in terms of textures, div ersity of gradient orientations and presence of high contrast since the HVS is more sensitive to the distortions in such areas. For example, the distortions in an untextured area are much more annoying than the ones located in a high texture comple xity area. It is reported that this method approaches a gain of 17.8% ov er SSIM in correlation with subjectiv e measurements. Zhao et al. proposed the PSPTNR metric to measure the perceptual temporal noise of the synthesized sequence [ 44 ]. The temporal noise is defined as the the dif ference between inter-frame change in the processed sequence and that in the reference sequence: T N i,n = (( P i,n − P i,n − 1 ) − ( R i,n − R i,n − 1 ) 2 , (6) where T N indicates the temporal noise, P and R represent the distorted and reference sequence respectiv ely . In order to better predict the perceptual quality of synthesized videos, temporal noise is filtered by a Just Noticeable Distortion (JND) model and a motion mask [ 93 ], since the human can observ e noise only beyond certain lev el and motion may decrease the texture sharpness in the video. The shift compensation methods included in SDRD and SCDM only consider the global shift. But according to the recent research[ 94 ], the HVS is more sensiti ve to local artefacts compared to the global object shift. In [ 48 ], T ian et al. proposed a shift-compensation based image quality assessment metric (SC-IQA) for DIBR-synthesized vie ws. The same as SCDM, a SURF + RANSA C approach is used to roughly compensate the global shift. In addition, a multi-resolution block matching method is proposed to precisely compensate the global shift and penalize the local shift at the same time. A saliency map [ 95 ] is also considered to weight the distortion map of the synthesized view . Furthermore, only the blocks with the worst quality are used to calculate the final quality score since HVS tends to percei ve poor regions in an image with more sev erity than the good ones [ 94 , 22 ]. SC-IQA achieves the performance of SCDM without access to the depth map. The metrics introduced abov e consider only the view synthesis and compression artefacts which occur on applications that sho w the synthesized vie ws on a 2D display , the binocular ef fect in the synthesized stereoscopic images is not taken into consideration. In [ 23 ], Jung et al. proposed a SSIM-based FR metric to measure the critical binocular asymmetry (CB A) in the synthesized stereo images. Firstly , the disparity inconsistency between the two different views is generated to detect the critical areas in terms of Left-Right image mismatches. Then, only the SSIM value on the critical areas of each vie w are computed to measure the asymmetry in the corresponding vie w image. The final binocular asymmetry score is obtained by av eraging the asymmetry score in the left and right views. 4.2 Side view based FR metrics The major limitation of the FR metrics is that they always need the reference vie w which may be unav ailable in some circumstances e.g. FVV). In other words, there is no ground truth for a full comparison with the distorted synthesized view . In this part, four side vie w based FR metrics will be re viewed. This kind of metrics use the real image/video at the original vie wpoint, from which the virtual view is synthesized, as the reference to ev aluate the quality of DIBR-synthesized virtual views. These metrics are named “side view based FR metrics” in this paper . Solh et al. proposed a side vie w based FR metric 3VQM [ 59 ] to e valuate synthesized vie w distortions by deriving an “ideal” depth map from the virtual synthesized view and the reference vie w at a different vie wpoint. The “ideal” depth is the depth map that would generate the distortion-free image gi v en the same reference image and DIBR parameters. Three distortion measurements, spatial outliers, temporal outliers and temporal inconsistency are calculated from the difference between the “ideal” depth map and the distorted depth map: S O = S T D ( 4 Z ) (7) T O = S T D ( 4 Z t +1 + 4 Z t ) (8) T I = S T D ( Z t +1 + Z t ) (9) where S O , T O and T I denote the spatial outliers, temporal outliers and temporal inconsistencies respecti v ely , S T D represents the standard de viation. 4 Z is the dif ference between the “ideal” and the distorted depth maps and t is the frame number . These three measurements are then integrated into a final quality score. Since the calculation of the 13 A P R E P R I N T “ideal” depth map is based on the assumption that the horizontal shift of the synthesized view and the original vie w is small, this metric would not work well when the baseline distance increases. Li et al. proposed a side view based FR metric for DIBR-synthesized views by measuring local geometric distortions in dis-occluded regions and global sharpness (LOGS) [ 60 ]. This metric consists of three parts. Firstly , the dis-occlusion regions are detected by using SIFT -flo w based warping. These dis-occluded regions are extracted from the absolute difference map between the synthesized view I sy n and the warped reference view I w ref followed by an additional threshold. Then, the distortion size and strength in the local dis-occlusion regions are combined to obtain the o verall local geometric distortion. The distortion size is simply measured by the number of pixels in the dis-occluded regions and the distortion strength is defined as the mean value of the dis-occluded regions in the whole difference map M . The next part is to measure the global sharpness by using a reblurring-based method. The synthesized image is firstly blurred by a Gaussian smoothing filter . Both the synthesized image and its reblurred v ersion are di vided into blocks. The sharpness of each block is calculated by its textural complexity , which is represented by its variance σ 2 . Then, the ov erall sharpness score is computed by a veraging the textural distance of all blocks. Finally , the local geometric distortion and the global sharpness are pooled to generate the final quality score. Farid et al. proposed a side view based FR metric (DSQM) for the DIBR-synthesized vie w in [ 61 ]. A block matching is firstly used to estimate the shift between the reference and synthesized image. Then the difference of Phase congruency (PC) in these two matched blocks is used to measure the quality of the block in the synthesized image, which is defined as follows: P C ( x ) = max ¯ φ ( x ) ∈ [0 , 2 π ] P n A n cos ( φ n ( x ) − ¯ φ ( x )) P n A n (10) where A n and φ n ( x ) represent the amplitude and the local phase of the n -th Fourier component at position x respecti vely . The implementation of phase congruency is based on a logarithmic Gabor wa velet method proposed in [ 96 ]. The quality score of each block is calculated as the absolute difference between the mean v alues of the phase congruency maps of the matched blocks in the synthesized and reference image: Q i = | µ ( P C si − P C ri ) | (11) where µ () represents the mean value of the corresponding phase congruenc y map, the P C si and P C ri indicate the PC map of the matched blocks in the synthesized and reference image. The final image quality is obtained by av eraging the quality score of all the blocks. Farid et al. proposed a c yclopean eye theory [ 97 ] and di visiv e normalization (DN) transform [ 98 ] based Synthesized Image Quality Ev aluator (SIQE) in [ 62 ]. The DIBR-synthesized vie w image associated with the left and right side views are firstly transformed by DN. Then, the statistical characteristics of the cyclopean image are estimated from the DN representations of the left and right side vie ws while the statistical characteristics of the synthesized image are obtained directly from itself. The similarity (Bhattacharyya coefficient [ 99 ]) between the distribution of the c yclopean and the synthesized image’ s DN representations is computed to measure the quality score of the synthesized image. The SIQE metric only considers the texture information, in [ 63 ], Farid et al. proposed an extended version of SIQM by considering both the texture and depth information. The depth distortion estimation is based on the fact that the edge regions in a depth image are more sensitiv e to noise than the flat homogeneous regions since the distorted edge in the depth map may cause very anno ying structural distortions in the synthesized image. Firstly , the pixels in the depth map with a high gradient value are extracted as noise sensitiv e pixels (NSP). Then, for each NSP , a local histogram from the distorted depth map is constructed and analysed to estimate the distortion in the depth image. The overall depth distortions are calculated by a veraging the distortions in the left and right depth image. The final quality of the synthesized view is pooled from the te xture and depth distortions. 4.3 Depth image quality metrics The quality of depth images is crucial for generating high-quality synthesized vie ws. A fe w metrics hav e been proposed to predict the depth image quality in DIBR view synthesis. Le et al. proposed a RR depth image quality metric (RR-DQM) [ 55 ] which requires a pair of color and depth images. The depth image quality is measured depending on the edge directions based on the fact that the local depth distortion and the local image characteristic are strongly correlated. A Gabor filter is applied to generate a weighting map which are then used to adaptiv ely weight the local depth distortion. Li et al. proposed a FR depth image quality metric based on weighted edge similarity [ 54 ]. Based on their observation that the distortions in the DIBR-synthesized vie ws are mainly concentrated in the edge regions of depth maps, the proposed metric is designed with emphasis on the distortions in depth edge regions. The similarity between the distorted 14 A P R E P R I N T and reference depth map is calculated in both intensity and gradient domains. Then, a weighting map is generated by combining a location prior and a depth distance measure. Finally , the edge indication is used as a guidance to pool the ov erall quality of depth map. Farid et al. proposed a blind depth quality metric (BDQM) [ 56 ] to ev aluate the compression distortions in depth images. They noticed that the compression flattens the sharp transitions of the depth image. Therefore, the shape of the histogram around the depth boundaries are used to predict the depth quality . In [ 57 ], Xiang et al. proposed a NR depth image quality metric by calculating the misalignment errors between the edges of texture and depth images. The misalignments are ev aluated from three similarities: the edge orientation similarity , the spatial similarity and the segmentation length similarity . Finally , the misalignments are used to calculate the final quality scores. Li et al. proposed a NR depth image quality inde x based on the statistics of edge profiles (SEP) [ 58 ]. The first-order and second-order statistical features are firstly extracted based on edge profiles which are the neighbouring regions around the depth edges. Then, the random forest (RF) is applied to build a quality assessment model for depth maps. The depth image quality metrics can ev aluate the quality of synthesized view before performing actual rendering and is thus more computational friendly . It can also be used in the rate distortion optimization of depth map compression. The same as the texture IQA metrics, the NR depth image quality metrics are more practical than the FR ones since the depth maps are usually acquired by depth cameras or depth estimation approaches and are not always a v ailable. 4.4 NR metrics In this part, we will revie w the NR metrics which do not need ground truth images/videos to ev aluate the quality of DIBR-synthesized views. 4.4.1 Local image description based NR metrics Due to the distorted depth map and imperfect rendering method, there exists a large number of structural and geometric distortions in the DIBR-synthesized views. As introduced in the RRLP metric [ 53 ], the structural distortions may result in local disorder in the image. Similarly , several local image description based NR metrics ha ve been proposed to ev aluate the structural distortions by measuring the local inconsistenc y via different models. Gu et al. proposed an auto-regression (AR) based model (APT) to capture the geometric distortions in the DIBR- synthesized vie ws. For each pixel, a local AR model (3 × 3) is first used to construct a relationship between this pixel and its neighbouring pixels. x i = Ω( x i ) s + d i (12) where Ω( x i ) denotes a vector which is composed of the neighbouring pixels of x i in the (3 × 3) patch, s is a vector of AR parameters and d i represents the error difference between the current pixel value and its corresponding AR prediction. The AR parameters are solved on the assumption that the 7 × 7 local patch, which consists of the current pixel and its 48 adjacent pixels, shares the same AR model. The error dif ference map between the synthesized and the reconstructed images is obtained as the distortion map. Then, a Gaussian filter and a salienc y map [ 100 ] associated with a maximum pooling are used to obtain the final image quality score. Due to its computational complexity , this method owns a high computing cost. Different from the APT metric, the OUT (outliers) metric [ 65 ] proposed by Jakhetiya et al. uses a median filter to calculate the dif ference map. Then, two thresholds are used to e xtract the structural and geometric distortion re gions. The quality score is finally obtained from the standard deviation of the structural and geometric distortion re gions. These local image description based metrics can only detect thin distortions or local noise, they do not work well on the large size distortions. 4.4.2 Morphological operation based NR metrics The morphological operations sho w their effecti veness in the FR metric MP-PSNR [ 40 ]. In [ 68 , 69 ], T ian et al. proposed two metrics NIQSV and NIQSV+ to detect the local thin structural distortions through morphological operations. These two metrics assume that the “perfect” image consists of flat areas and sharp edges, so such images are insensiti ve to the morphological operations while the local thin structural distortions can be easily detected by these morphological operations. The NIQSV metric firstly uses an opening operation to detect the thin distortions and followed by a closing operation with lar ger Structural Element (SE) to file the black holes. The NIQSV+ e xtend the NIQSV by proposing two additional measurements: black hole detection and stretching detection. The black hole distortion is estimated by 15 A P R E P R I N T counting the black hole pix els proportion in the image while the stretching distortion is e v aluated by calculating the gradient decrease of the stretching region and its adjacent non-stretching re gion. Due to the limitation of the assumption and the SE size, these two metrics do not work well on the distortions in complex te xture and the distortions with large size. 4.4.3 Sharpness detection based NR metric Sharpness detection has been widely used in 2D image quality assessment [ 101 , 102 , 103 ] and also in the side view based FR metric LOGS [ 60 ]. In this part, we will introduce its usage in NR metrics. Sharpness is one of the most important measurements in NR image quality assessment [ 104 , 105 , 106 ]. The DIBR view synthesis may introduce multiple distortions such as blur , geometric distortions around the object edges, which may significantly result in the degradation of sharpness. Nonlinear morphological wa velet decomposition can e xtract high-pass image content while preserving the unblurred geometric structures [ 40 , 39 ]. In the transform domain, geometry distorted areas introduced by DIBR-synthesis are characterized by coef ficients of higher v alue compared to the coef ficients of smooth, edge and textural areas. In [ 67 ], Sandi ´ c-Stankovi ´ c et al. proposed a wa velet-based NR metric (NR_MWT) for the DIBR-synthesized view videos. The sharpness is measured by quantifying the high frequenc y components in the image, which are represented by the high-high w av elet sub-band. The final quality is obtained from the sub-band coefficients whose value are higher than the threshold. Similar to MW -PSNR and MP-PSNR [ 40 , 39 ], the NR_MWT also has a very low computational complexity . Differently , in CLGM [ 71 ], the sharpness is measured as the distance of standard de viations between the synthesized image and its down-sampled v ersion. Besides, two additional distortions, dis-occluded regions and stretching, are also taken into consideration in CLGM. The dis-occluded regions are detected through an analysis of local image similarity . Similar to NIQSV+ [ 69 ], the stretching distortion is estimated by computing the similarity between the stretching region and its adjacent non-stretching region. In [ 72 ], W ang et al. also proposed a NR metric (GDIC) to measure the geometric distortions and image complexity . Firstly , different from the w av elet transform based metrics introduced abo ve, this GDIC metric uses the edge map of wa velet sub-bands to obtain the shape of geometric distortions. Then, the geometric distortion is measured in terms of edge similarity between the w av elet low-le vel and high-le vel sub-bands [ 107 ]. Besides, the image complexity is also an important factor in human visual perception. In order to e v aluate the image complexity of the DIBR-synthesized images, hybrid filter [ 108 , 109 ], which combines the Autoregressi ve (AR) and bilateral (BL), is used. The final image quality score is computed by normalizing the geometric distortion with image complexity . Furthermore, in [ 73 ], this metric is extended to achie ve higher performance by adding a log-ener gy based sharpness detection module. 4.4.4 Flicker r egion based video NR metrics In DIBR-synthesized videos, temporal flick er is one of the most annoying distortions. Extracting the flicker re gions may help to ev aluate the quality of DIBR-synthesized videos. In [ 75 ], Kim et al. also proposed a NR metric (CTI) to measure the temporal inconsistency and flicker regions in the DIBR-synthesized video. First, the flicker re gions are detected from the dif ference between motion-compensated consecutiv e frames. Then, the structural similarity between consecutiv e frames are calculated on the flicker re gions to measure the structural distortions in each frame. At the same time, the number of pixels in the flicker regions is used to weight the distortion of each frame. The final quality score is obtained as the weighted sum of the quality scores of all the frames in the DIBR-synthesized video. In [ 76 ], Zhou et al. proposed a NR metric FDI to measure the temporal flickering distortion in the DIBR-synthesized videos. Firstly , the gradient variations between each frame are used to extract the potential flickering regions. Follo wed by a refinement to precisely obtain the flickering regions through calculating the correlation between the candidate flickering regions and their neighbours. Then, the flickering distortion is estimated in SVD domain from the difference between the singular vectors of the flickering block and their associated block in the pre vious frame. The final video quality is computed as the av erage quality of all the frames. 4.4.5 Natural Scene Statistics based NR metrics Natural Scene Statistics (NSS) based approaches, which assume that the natural images contain certain statistics and these statistics may be changed by different distortions, hav e achie ved great success in the quality assessment of traditional 2D images [ 110 , 111 , 112 , 113 ]. Due to the big difference between the DIBR view synthesis distortions and the traditional 2D ones, these NSS based metrics do not work well on the quality assessment of DIBR-synthesized views. Recently , se veral ef forts hav e been made to fix this gap. 16 A P R E P R I N T As introduced in the pre vious Edge/Contour based FR metrics part, the edge image is significantly degraded by structural and geometric distortions in DIBR-synthesized images, and the edge based FR metrics ha ve sho wn their superiority . W ith this consideration, Zhou et al. proposed a NR metric (SET) for DIBR-synthesized images via edge statistics and texture naturalness based on Dif ference-of-Gaussian (DoG) in [ 74 ]. The orientation selectiv e statistics (similar to the metric in [ 112 ]) are extracted from DoG images at dif ferent scales while the texture naturalness features are obtained based on the Gray lev el Gradient Co-occurrence Matrix (GGCM) [ 114 ] which represents the joint distribution relation of pixel gray le vel and edge gradient. A Random Forest (RF) regression model is finally trained based on these two groups of features to predict the quality of DIBR-synthesized images. Gu et al. proposed a self-similarity and main structure consistency based Multiscale Natural Scene Statistics (MNSS) in [ 66 ]. The multiscale analysis on the DIBR-synthesized image and its associated reference image indicates that the distance (SSIM value [ 4 ]) between the synthesized and the reference image decreases significantly when the scale reduces. It is assumed that the synthesized image at a higher scale holds a better quality , which means the higher-scale images can be approximately used as references. Thus, the similarity between the lo wer scale image (first scale is used in this metric) and the higher scale images (self similarity) are used to measure the quality of DIBR-synthesized image. Besides, in the main structure, the authors use 300 natural images from the Berkeley segmentation dataset [ 115 ] to obtain the general statistical regularity of main structure in natural images. The similarity between the main structure map of the synthesized image and the obtained prior NSS vector is calculated to ev aluate the structure degradation of the DIBR-synthesized image. Finally , the statistical regularity of main structure and the structure degradation are combined to get the ov erall quality score. Shao et al. propose a NR metric (HEVSQP) for DIBR-synthesized videos based on color-depth interacti ons in [ 70 ]. Firstly , the video sequence is divided into Group of Frames (GoF). Through an analysis of color-depth interactions, more than 90 features from both texture and depth videos, including gradient magnitude, asymmetric generalized Gaussian distribution (A GGD) [ 111 ], local binary pattern (LBP), are e xtracted. Then, a principal component analysis (PCA) is applied to reduce the feature dimension. Then, two dictionaries, color dictionary and depth dictionary , are learned to establish the relationship between the features and video quality . The final quality score is pooled from the color and depth quality . In [ 77 ], Ling et al. proposed a NR learning based metric for DIBR-synthesized vie ws, which focuses on the non-uniform distortions. Firstly , a set of con volutional k ernels are learned by using the impro ved f ast con volutional sparse coding (CSC) algorithms. Then, the con v olutional sparse coding (CSC) based features of the DIBR-synthesized images are extracted, from which the final quality score is obtained via support v ector regression (SVR). Although the NSS models ha ve made great progress for the NR IQA, the hand-craft features may not be suf ficient to represent complex image textures and artef acts, there is still a lar ge gap between objecti v e quality measurement and human perception [116]. 4.4.6 Deep feature based NR metrics The deep learning techniques, especially the Con volutional Neural Networks (CNN), ha ve sho wn their great adv antages in v arious computer vision tasks [ 117 , 118 ]. They make it possible to directly learn the representati ve features from image [ 119 , 120 ]. Unfortunately , due to the limitation of the number of images in the DIBR-synthesized view datasets, there is not enough data to train the deep models straightforwardly . Howev er , it is shown in the recent published literature that the deep neural network models trained on large-scale datasets, e.g. ImageNet [ 121 ], can be used to extract ef fecti ve representati ve features of human perception. In [ 78 ], W ang et al. proposed a NR metric SIQA-CFP which uses the ResNet-50 [ 122 ] model pre-trained on ImageNet to extract multi-le vel features of DIBR-synthesized images. Then, a contextual multi-le vel feature pooling strate gy is designed to encode the high-lev el and lo w-lev el features, and finally to get the quality scores. As introduced in Section 1, v arious distortions may be introduced during the dis-occlusion region filling stage. Meanwhile, in current literature, sev eral Generati ve Adversarial Networks (GAN) [ 123 ] based models have been proposed for image in-painting. As the generator is trained to in-paint the missing part, the discriminator is supposed to hav e the capability to capture the perceptual information which reflects the in-painted image quality . Based on this assumption, Ling et al. proposed a GAN based NR metric (GANs-NRM) [ 79 ] for DIBR-synthesized images. In GANs-NRM, a generati ve adversial network for image in-painting is firstly trained on two large-scale datasets (P ASCAL [ 124 ] and Places [ 125 ]). Then, the features extracted from the pre-trained discriminator are used to learn a Bag-of-Distortion-W ord (BD W) codebook. A Support V ector Regression (SVR) is trained on the encoded information of each image to predict the final quality of DIBR-synthesized images. Instead of simply using the general models trained for other tasks, e.g. object detection, this metric is more targeted, and it also proposes a ne w way to obtain the semantic features for image quality assessment. 17 A P R E P R I N T T able 3: Performance of the DIBR dedicated metrics on DIBR-synthesized image dataset. Metric IVC image dataset IETR image dataset MCL 3D image dataset IVY dataset PLCC RMSE SROCC PLCC RMSE SROCC PLCC RMSE SROCC PLCC RMSE SR OCC FR 2D PSNR 0.4557 0.5927 0.4417 0.6012 0.1985 0.5356 0.7852 1.6112 0.7915 0.6311 19.1227 0.6668 SSIM [4] 0.4348 0.5996 0.4004 0.4016 0.2275 0.2395 0.7331 1.7693 0.7470 0.3786 22.8172 0.3742 NR 2D BIQI [127] 0.5150 0.5708 0.3248 0.4427 0.2223 0.4321 0.3347 2.4516 0.3696 0.5686 20.2791 5754 BLIINDS2 [110] 0.5709 0.5467 0.4702 0.2020 0.2428 0.1458 0.6338 2.0124 0.5893 0.3508 23.0855 0.2569 FR DIBR Bosc [35] 0.5841 0.5408 0.4903 — — — 0.4536 2.2980 0.4330 — — — 3DSwIM [37] 0.6864 0.4842 0.6125 — — — 0.6519 1.9729 0.5683 — — — VSQA [36] 0.6122 0.5265 0.6032 0.5576 0.2062 0.4719 0.5078 2.9175 0.5120 — — — ST -SIAQ [42] 0.6914 0.4812 0.6746 0.3345 0.2336 0.4232 0.7133 1.8233 0.7034 — — — EM-IQA [43] 0.7430 0.4455 0.6282 0.5627 0.2020 0.5670 — — — — — — MP-PSNR [40] 0.6729 0.4925 0.6272 0.5753 0.2032 0.5507 0.7831 1.6179 0.7899 0.5947 19.8182 0.5707 MW -PSNR [39] 0.6200 0.5224 0.5739 0.5301 0.2106 0.4845 0.7654 1.6743 0.7721 0.5373 20.7910 0.5051 SCDM [47] 0.8242 0.3771 0.7889 0.6685 0.1844 0.5903 0.7166 1.8141 0.7197 — — — SC-IQA [48] 0.8496 0.3511 0.7640 0.6856 0.1805 0.6423 0.8194 1.4913 0.8247 0.4326 22.2256 0.3135 W ang [51] 0.8512 0.3146 0.8346 0.6118 0.1961 0.6136 0.7910 1.5917 0.7929 — — — CBA [23] — — — — — — — — — 0.826 8.181 0.829 RR MP-PSNRr [52] 0.6954 0.4784 0.6606 0.6061 0.1976 0.5873 0.7740 1.6474 0.7802 0.5384 20.7733 0.5454 DIBR MW -PSNRr [52] 0.6625 0.4987 0.6232 0.5403 0.2090 0.4946 0.7579 1.7012 0.7665 0.5304 20.8993 0.5138 SV -FR DIBR SIQE [62] 0.7650 0.5382 0.4492 0.3144 0.2353 0.3418 0.6734 1.9233 0.6976 — — — LOGS [60] 0.8256 0.3601 0.7812 0.6687 0.1845 0.6683 0.7614 1.6873 0.7579 0.6442 18.8553 0.6385 DSQM [61] 0.7430 0.4455 0.7067 0.2977 0.2367 0.2369 0.6995 1.8593 0.6980 — — — NR DIBR APT [64] 0.7307 0.4546 0.7157 0.4225 0.2252 0.4187 0.6433 1.9870 0.6200 0.5156 21.1239 0.4754 OUT [65] 0.7243 0.4591 0.7010 0.2007 0.2429 0.1924 0.4208 2.3601 0.3171 0.2525 23.8530 0.2409 MNSS [66] 0.7700 0.4120 0.7850 0.3387 0.2333 0.2281 0.3766 2.4101 0.3531 0.3834 22.7681 0.2282 NR_MWT [67] 0.7343 0.4520 0.5169 0.4769 0.2179 0.4567 0.1373 2.5771 0.0110 0.4848 21.5614 0.4558 NIQSV [68] 0.6346 0.5146 0.6167 0.1759 0.2446 0.1473 0.6460 1.9820 0.5792 0.4113 22.4706 0.2717 NIQSV+ [69] 0.7114 0.4679 0.6668 0.2095 0.2429 0.2190 0.6138 2.0375 0.6213 0.2823 23.6491 0.3823 SET [74] 0.8586 0.3015 0.8109 — — — 0.9117 1.0631 0.9108 — — — GANs-NRM [79] 0.826 0.386 0.807 0.646 0.198 0.571 — — — — — — “—” : Due to the unavailability of source code or reference resources e.g. depth map and side view reference image, we just use the reported results in their corresponding publications instead, their associated results on other datasets are marked by the symbol “—” in the table. 4.5 Summary In this section, 19 FR, 3 RR, 4 SV -FR and 15 NR DIBR quality metrics have been revie wed and categorized based on their used approaches and on the amount of reference information used. As shown in T able 2, most of the metrics consist of multiple parts. It is thus dif ficult to classify them into a single specific cate gory thoroughly , that is why we just classify them into the most related one instead. Besides, there are also some other ways to do the classification. For example, if we focus on the image structural representation used in these metrics, they can be classified into lo w-le vel [ 22 ]), mid-lev el [ 42 , 43 ] and high-level [ 77 , 78 , 79 ] metrics. As introduced in [ 126 ], the low-le vel representations indicate the pixel le vel edges or contours; the mid-le v el representations mean the shapes and texture information; the high-lev el representations refer to the complex features e.g. objects, unnatural structures. Besides, there are also some hierarchical metrics which combine the above features, such as the LMS metric proposed in [ 49 ] which uses both low-le v el and mid-lev el features [42] and the metric in [50] which integrates the features on each le vel. 5 Experimental results and discussions In this section, the performances of different objecti ve quality assessment metrics are presented and analysed. Besides, some potential challenges and possible directions for future work will be discussed. 5.1 Perf ormance ev aluation methodologies The subjectiv e test results can be recognized as the ground truth visual quality since the human observer is the ultimate recei ver of image/video content. The accuracy of an objectiv e quality metric can be ev aluated based on its consistencies with the subjecti ve quality scores. In this part, we will introduce the V ideo Quality Expert Group (VQEG) [ 128 ] recommended correlation based methods and the recently proposed Krasula’ model [129] in detail. 5.1.1 Correlation coefficients based methods The reliability of objectiv e metrics can be ev aluated through their correlation with subjectiv e test scores. Three widely used criteria, Pearson Linear Correlation Coef ficients (PLCC) and Root-Mean-Square-Error (RMSE) and Spearman 18 A P R E P R I N T 20 30 40 50 60 Raw quality score 0 5 10 15 DMOS DMOS Regression function (a) Before regression 2 4 6 8 10 12 14 DMOSp 2 4 6 8 10 12 14 DMOS (b) After regression Figure 8: Example relationship between DMOS and objectiv e quality scores. This figure is from [130]. Rank-Order Correlation Coefficients (SR OCC), are recommended by VQEG to ev aluate the prediction accuracy , prediction monotonicity and prediction consistency of the objecti ve metrics respecti vely , which are defined as follows: P LC C ( X , Y ) = P n i =1 ( X i − ¯ X )( Y i − ¯ Y ) q P n i =1 ( X i − ¯ Y ) 2 q P n i =1 ( Y i − ¯ Y ) 2 (13) RM S E ( X, Y ) = v u u t 1 m m X i =1 ( X i − Y i ) 2 (14) S ROC C ( X , Y ) = 1 − 6 P d 2 i n ( n 2 − 1) (15) where d i indicates the dif ference of ranking of X and Y . Higher PLCC and SR OCC v alues indicate higher accuracy and better monotonicity respectiv ely . On the contrary , a higher RMSE v alue refers to a lower prediction accurac y . Before computing these three criteria, the objectiv e scores are recommended by VQEG to be mapped to the predicted subjecti ve score D M O S p to remove the nonlinearties due to the subjective rating processing and to facilitate comparison of the metrics in a common analysis space [ 128 ]. The nonlinear function for regression mapping is shown as follo ws: D M O S p = β 1 (0 . 5 − 1 (1 + e ( β 2 ( s − β 3 )) ) ) + β 4 s + β 5 (16) where s is the score obtained by the objecti ve metric and β 1 , β 2 , β 3 , β 4 , β 5 are the parameters of these regression functions. They are obtained through regression to minimize the difference between D M O S p and D M O S . As shown in Fig. 8, the nonlinearity has been remov ed after the regression. 5.1.2 Analysis of Krasula’ s model The above methods compare the performance of each metric by calculating their correlations with the subjective results. Howe v er they only consider the mean v alue of subjecti ve scores, the uncertainty of the subjecti ve scores are ignored. In addition, the quality scores need to be regressed by a regression function cf. Eq. 16, that is not the way they are exactly used in real scenarios. Thus, we further conduct a statistical test proposed by Krasula et al. in [ 129 ] which does not suffer from the drawbacks of the abo ve methods. The performances of objectiv e metrics are ev aluated by their classification abilities. As sho wn in Fig. 9, firstly , the tested image pairs in the dataset are divided into two groups: different and similar according to their subjectiv e scores. The cumulati ve distribution function (CDF) of the normal distribution is used to calculate the probability of image pairs. Then, we consider the pairs with a probabilty higher than the selected significance lev el 0.95 to be significantly dif ferent. The others will be recognized as similar . 19 A P R E P R I N T Figure 9: Krasula’ s model for performance e valuation of objecti v e quality metrics [129]. There are two performance analyses. The first performance analysis is conducted by by ev aluating ho w well the objectiv e metric succeeds to distinguish significantly different image pairs from non-significantly dif ferent video pairs, in a consistent way with subjecti ve e v aluation of significant dif ference. The second analysis determines whether the objectiv e metric can correctly identify the image of higher quality in the pair . Compared to simply calculating the correlation coefficients, this model considers not only the mean value of subjecti ve scores, but also their uncertainties. Besides, since no regression is used, this model less depends on the quality ranges of different datasets. Another advantage of Krasula’ s model is that it can easily combine the data from multiple datasets and ev aluate a comprehensi ve performance on multiple datasets instead of simply av eraging the results on differe nt datasets. 5.2 Perf ormance on DIBR image datasets 5.2.1 Results of PLCC, RMSE and SR OCC The obtained PLCC, RMSE and SROCC values of the objecti ve image quality assessment metrics on the DIBR- synthesized image datasets are giv en in T able 3, in which four 2D metrics [ 127 , 110 , 4 ] and 24 DIBR metrics are tested. The best three performances among the blind IQA methods are sho wn in bold. W e can easily observe that the DIBR-synthesized vie w dedicated metrics significantly outperform the traditional 2D metrics on the IVC and IETR image datasets which focus on the DIBR vie w synthesis distortions. In other words, the metrics initially designed for traditional 2D image distortions can not well ev aluate the DIBR vie w synthesis distortions. The shift compensation based FR and SV -FR metrics obtain great impro vement compared to the original 2D FR metrics, e.g. the SC-IQA compared to PSNR. One main reason is that the global object shift existing in the DIBR-synthesized images may not be perceived by human observers b ut can be easily detected by the original 2D pixel-based FR metrics. Thus this shift distortions are often ov erestimated by the 2D pixel-based FR metrics. If we focus on the wav elet transform-based metrics (NR_MWT and MW -PSNR), the NR metric (NR_MWT) performs better than the FR metric (MW -PSNR) on the IVC dataset. It is surprising that the FR metric performs even w orse than the NR metric since these metrics use similar features and the FR metric has access to the ground truth. While on the IETR dataset, the NR metric performs worse than the FR metrics. The main reason probably lies in the global shift distortion in the IVC image dataset. 20 A P R E P R I N T T able 4: Performance on the IVC DIBR image dataset excluding A1 algorithm. Metric PLCC RMSE SR OCC FR 2D PSNR 0.7519 0.4525 0.6766 SSIM 0.5956 0.5513 0.4424 FR DIBR MW -PSNR 0.8545 0.3565 0.7750 RR DIBR MW -PSNRr 0.8855 0.3188 0.8298 T o further explore the object shift ef fect, we ha ve made an additional experiment on the IVC dataset while excluding the A1 vie w synthesis algorithm [ 14 ] which causes great object shift in the synthesized vie ws. The A1 algorithm fills the black holes in the dis-occlusion regions by simply stretching the adjacent texture which may cause great global object shift in the synthesized views. The results are shown in T able 4. W e can observe that the performance of FR and RR metrics increase significantly when large global shift artef acts are excluded. The edge/contour based metrics also perform much better than the 2D pixel-based FR metrics since the edge/contour features can better represent the geometric degradations in the DIBR-synthesized images compared to simple pixel information. The NR metrics do not need any reference information to ev aluate the image quality , thus the global shift does not have effect on the NR metrics. Besides, since the real reference images at virtual viewpoints are not always a v ailable in real applications, the NR metrics are more practical and useful. From T able 3, we can easily find that the performances of the DIBR-synthesized vie w dedicated metrics decrease greatly on the IETR dataset compared to theirs on the IVC dataset. Among these metrics, the NR ones decrease the most, especially the learning based NR metrics. This is because of the f act that these NR metrics are designed for the distortions in the IVC dataset. Howe ver , in the IETR dataset, man y “old fashioned” distortions are excluded. As introduced in Section II, the MCL-3D dataset does not focus on the DIBR view synthesis distortions, but on the traditional distortion effects on the synthesized views. Thus, the performances of the tested objecti ve metrics are quite different. Some of the metrics (Bosc, VSQA and NR_MWT) that only consider the DIBR view synthesis distortions perform not as good as the traditional 2D metrics. Some 2D related FR metrics perform e ven w orse than their backbones. For instance, VSQA and 3DSwIM can not achie ve the performance of SSIM; SCDM, MP-PSNR and MW -PSNR perform worse than PSNR. Among these metrics, the feature-based FR metrics perform better than the simple edge/contour based metrics. It can be inferred that the frequency domain features can represent not only the edge/contour information, b ut also some other texture characteristics. The SET metric contains not only the DoG features for the DIBR vie w synthesis distortions, but also the GGCM based features for the texture naturalness. That may explain its good performance on both IVC and MCL-3D datasets. The IVY dataset considers not only the view synthesis distortion, but also de binocular asymmetry in synthesized stereoscopic images. The baseline distance between the virtual viewpoint and the original vie wpoint is much bigger than that in the other datasets. Thus, the metrics which do not consider the binocular asymmetry perform not well on this dataset. 5.2.2 Results of Krasula’ s model Only the IVC and IETR datasets are tested in this part since the MCL-3D and IVY datasets do not provide the standard deviation which represents the subject uncertainty . The obtained Area Under the Curves (A UC) and significant test results on IVC and IETR are shown in Fig. 10 (a) (b) (c) (d). The Fig. 10 (e) and (f) demonstrate the results on the combination of IVC and IETR datasets. A higher A UC value indicates a higher performance. In the significant test results, the white block indicates that the metric in the ro w performs significantly better that the metric in the column and vice versa for the black block. The gray block means these two metrics are statistically equi v alent. In the first different / similar analysis on the IVC dataset cf. Fig. 10 (a), none of these metrics perform well since most A UC values are below 0.7 and there e ven exist some metrics whose A UC v alues are under 0.5. Generally , the DIBR FR metrics perform better than the other metrics. In the second different / similar analysis on the IVC dataset cf. Fig. 10 (b), the DIBR-synthesized view dedicated metrics perform significantly better than the 2D metrics (first and last 2 metrics) since the DIBR metrics can achie ve higher A UC v alues. Among these metrics, the SCDM and SC-IQA metrics perform the best, they achiev e A UC values higher than 0.9. 21 A P R E P R I N T 1 2 3 4 5 6 7 8 9 10 11 12 13 14 15 Metrics (-) 0.55 0.6 0.65 0.7 0.75 AUC (-) Different/Similar Significance 1 2 3 4 5 6 7 8 9 10 11 12 13 14 15 1 2 3 4 5 6 7 8 9 10 11 12 13 14 15 (a) Different / Similar analysis on IVC image dataset 1 2 3 4 5 6 7 8 9 10 11 12 13 14 15 Metrics (-) 0.6 0.65 0.7 0.75 0.8 0.85 0.9 0.95 AUC (-) Better/Worse Significance 1 2 3 4 5 6 7 8 9 10 11 12 13 14 15 1 2 3 4 5 6 7 8 9 10 11 12 13 14 15 (b) Better / W orse analysis on IVC image dataset 1 2 3 4 5 6 7 8 9 10 11 12 13 14 15 Metrics (-) 0.45 0.5 0.55 0.6 0.65 0.7 AUC (-) Different/Similar Significance 1 2 3 4 5 6 7 8 9 10 11 12 13 14 15 1 2 3 4 5 6 7 8 9 10 11 12 13 14 15 (c) Different / Similar analysis on IETR image dataset 1 2 3 4 5 6 7 8 9 10 11 12 13 14 15 Metrics (-) 0.5 0.55 0.6 0.65 0.7 0.75 0.8 0.85 AUC (-) Better/Worse Significance 1 2 3 4 5 6 7 8 9 10 11 12 13 14 15 1 2 3 4 5 6 7 8 9 10 11 12 13 14 15 (d) Better / W orse analysis on IETR image datasets 1 2 3 4 5 6 7 8 9 10 11 12 13 14 15 Metrics (-) 0.5 0.55 0.6 0.65 AUC (-) Different/Similar Significance 1 2 3 4 5 6 7 8 9 10 11 12 13 14 15 1 2 3 4 5 6 7 8 9 10 11 12 13 14 15 (e) Different / Similar analysis combining tw o datasets 1 2 3 4 5 6 7 8 9 10 11 12 13 14 15 Metrics (-) 0.55 0.6 0.65 0.7 0.75 0.8 0.85 AUC (-) Better/Worse Significance 1 2 3 4 5 6 7 8 9 10 11 12 13 14 15 1 2 3 4 5 6 7 8 9 10 11 12 13 14 15 (f) Better / W orse analysis combining two datasets Figure 10: Performance on IVC and IETR image datasets using Krasula’ s model. The metrics 1-15 indicate PSNR, SSIM, SCDM. MP-PSNRr , MW -PSNRr , EM-IQA, SC-IQA, LOGS, NIQSV+, APT , MNSS, NR_MWT , OUT , BIQI, BLiindS2 respecti vely . In the significant test results, the white block indicates that the metric in the row performs significantly better that the metric in the column and vice versa for the black block. The gray block means these tw o metrics are statistically equiv alent. 22 A P R E P R I N T T able 5: Performance on the IVC and SIA T DIBR video dataset. Metric IVC video dataset SIA T video dataset PLCC RMSE SR OCC PLCC RMSE SR OCC FR 2D image metrics PSNR 0.5104 0.5690 0.4647 0.6525 0.0972 0.6366 SSIM [4] 0.4081 0.6041 0.3751 0.4528 0.1144 0.4550 FR 2D video metrics MO VIE [131] 0.4971 0.4903 0.3877 0.646 0.097 0.693 ST -RRED [132] 0.2025 0.6480 0.5777 0.7164 0.0895 0.6971 NR 2D video metrics SpEED [133] 0.3771 0.6128 0.5952 0.7236 0.0885 0.6987 VIIDEO [134] 0.5971 0.5308 0.5877 0.2586 0.1239 0.2535 FR DIBR image metrics Bosc [35] 0.5856 0.4602 0.2654 0.453 0.114 0.431 MP-PSNR [40] 0.5026 0.5720 0.5478 0.5681 0.1056 0.5044 MW -PSNR [40] 0.4911 0.4638 0.4558 0.5745 0.1050 0.5024 3DSwIM [37] 0.4822 0.4974 0.3320 0.5677 0.1057 0.2762 RR DIBR image metrics MP-PSNRr [52] 0.4617 0.5869 0.5307 0.5640 0.1059 0.5040 MW -PSNRr [52] 0.4802 0.5804 0.5038 0.5757 0.1049 0.5853 SV -FR DIBR image metrics SIQE [62] 0.4084 0.5138 0.0991 0.3627 0.1195 0.2586 DSQM [61] 0.5241 0.4857 0.3157 0.4001 0.1071 0.3994 NR DIBR image metrics OUT [65] 0.6762 0.4874 0.6151 0.0945 0.1277 0.0926 NR_MWT [67] 0.7530 0.4354 0.7145 0.5051 0.1107 0.3092 NIQSV [68] 0.6505 0.5025 0.5963 0.5144 0.1100 0.4562 MNSS [66] 0.5180 0.5660 0.5371 0.1591 0.1266 0.2463 FR DIBR video metrics CQM [135] 0.4102 0.5101 0.3265 0.4021 0.1070 0.4064 PSPTNR [44] 0.4321 0.5002 0.4152 0.4461 0.1069 0.4305 VQA-SIA T [22] 0.5943 0.5321 0.5879 0.8527 0.0670 0.8583 NR DIBR video metrics CTI [75] 0.6821 0.4372 0.6896 0.5736 0.1053 0.5425 FDI [76] 0.7576 0.4319 0.7162 0.5952 0.1033 0.5425 1 2 3 4 5 6 7 8 9 10 11 12 13 Metrics (-) 0.5 0.55 0.6 0.65 AUC (-) Different/Similar Significance 1 2 3 4 5 6 7 8 9 1011 1213 1 2 3 4 5 6 7 8 9 10 11 12 13 (a) Different / Similar analysis on IVC V ideo dataset 1 2 3 4 5 6 7 8 9 10 11 12 13 Metrics (-) 0.4 0.5 0.6 0.7 0.8 0.9 AUC (-) Better/Worse Significance 1 2 3 4 5 6 7 8 9 10 111213 1 2 3 4 5 6 7 8 9 10 11 12 13 (b) Better / W orse analysis on IVC V ideo dataset Figure 11: Performance on IVC video dataset using Krasula’ s model. The metrics 1-13 represent: PSNR, SSIM, SpEED, ST -RRED, VIIDEO, MP-PSNRr , MW -PSNRr , NIQSV , OUT , MNSS, NR_MWT , FDI, SIA T -VQA respecti vely . In the significant test results, the white block indicates that the metric in the row performs significantly better that the metric in the column and vice versa for the black block. The gray block means these tw o metrics are statistically equiv alent. The results on the IETR dataset cf. Fig. 10 (c) (d) and the combination of the two datasets cf. Fig. 10 (e) (f) show that most of the FR metrics outperform the NR metrics e xcept the SSIM metric. The 2D NR metrics achiev e similar results compared to their performance on IVC dataset, while the performance of the DIBR NR metrics decrease greatly compared to their performance on IVC dataset. The results of Krasula’ s model are consistent with the correlation coefficients results in the pre vious part. 5.3 Perf ormance on DIBR video datasets The DIBR-synthesized videos contain some temporal distortions, such as flickering, in addition to the spatial distortions in images. In this experiment, 12 state-of-the-art DIBR image metrics in addition to 5 DIBR video metrics are tested. 23 A P R E P R I N T T o compare the performance of DIBR metrics and traditional 2D metrics, 5 widely used 2D video metrics and 2 2D image metrics are tested. The quality scores of image metrics are obtained by av eraging the quality of all the frames. The three metrics which performance the best among the BIQA methods are marked in bold. The obtained PLCC, RMSE and SR OCC v alues on IVC video and SIA T video datasets are giv en in T able 5. Only the results of Krasula’ s model on IVC video dataset are shown in Fig. 11 since the SIA T video dataset does not provide the uncertainty of subject ratings. The IVC video dataset focuses on the DIBR view synthesis distortions while the SIA T dataset focuses on the compression effects on the synthesized vie ws. W e can easily observe that the best three metrics on IVC dataset are all DIBR metrics while the best three metrics on SIA T dataset are VQA-SIA T and tw o 2D metrics. The VQA-SIA T metric mainly focuses on the compression ef fect which may lead obvious flick er in the DIBR-synthesized views. The spatial view synthesis distortions considered in this metric are very limited. That may explain why it significantly outperforms the other metrics on SIA T dataset while it can not obtain a v ery good performance on the IVC dataset. When we focus on the IVC video dataset, none of FR metrics achie ves a high correlation with the subjecti ve results. Moreov er , there is no significant difference between the performances of DIBR FR and 2D FR metrics. Howe ver , the DIBR NR metrics perform the best compared to other metrics, also due to the global shift effect. 5.4 Discussions The e xperimental results show that although great progress has been made towards the quality assessment of synthesized views, there is still a lar ge room for improv ement. 5.4.1 Synthesized video quality assessment The DIBR-synthesized videos contain not only the compression distortions b ut also the distortions induced by DIBR. The VQA-SIA T metric works well on capturing the temporal flicker caused by video compression, but it fails to assess the DIBR vie w synthesis distortions in the synthesized video frames. In addition, the imperfect vie w synthesis algorithms may also result in great miss-match between the adjacent frames in the synthesized video, which causes very annoying temporal distortions that the 8 by 8 block matching (in VQA-SIA T) may fail to detect. Therefore, we could try to further analyse the specific spatial-temporal distortions in the synthesized videos and design a complete metric for the DIBR-synthesized videos. 5.4.2 Quality assessment of synthesized views in real applications As introduced pre viously , DIBR can be used in various applications, b ut the quality assessment for these applications are rarely researched. F or example, the free viewpoint videos (FVV) and multi-vie w videos (MVV) provide the images from multiple vie wpoints at the same time instant. The temporal distortions in FVV or MVV are mainly introduced by the changing of vie wpoints instead of timeline [ 83 , 50 ]. This type of distortions are dif ferent from that in normal DIBR-synthesized views videos. Besides, in order to provide immersiv e perception for the observer , the AR or VR applications need to generate multiple synthesized images and change the vie wpoint with the motion of the observ er . The synthesized video contains both the inter-frame and inter -vie wpoint temporal distortions, as well as the binocular asymmetric distortions which may happen in stereoscopic applications [ 23 ]. It could be interesting to try to design the metrics for these applications since they are currently rarely e xplored. 5.4.3 Deep learning appr oaches The main limitation of the usage of deep learning on the quality assessment of DIBR-synthesized vie ws is the limited size of av ailable datasets. Unlike the homogeneous distortions in the traditional 2D images, the distortions in the DIBR- synthesized vie ws mostly occur in the dis-occlusion regions. In other words, the major part of the DIBR-synthesized view holds a perfect quality . Thus we cannot split the synthesized image into sev eral patches and then directly use the quality of the whole image as the quality of the patches. Creating a very lar ge-scale dataset may significantly help to train a deep model. But unlike the datasets for other tasks , e.g. object recognition, creating an image quality dataset necessarily requires subjectiv e tests which are quite expensi v e and time-consuming. Thus, exploring how to train a comprehensive model on limited data could be more practical, maybe via one-shot learning or few-shot learning [ 136 , 137 ]. Besides, in addition to the indi vidual predicted image quality scores (precision), the ranking of the predicted scores (monotonicity) is also an important index to e v aluate the performance of an IQA metric. Therefore, learning from rankings [ 138 , 7 ] may help to solve the problem of IQA dataset size limit. Firstly , the ranked image sets can be automatically generated without subjectiv e tests [ 138 ]. W e can pre-train our model on the generated ranked image sets and then fine-tune it on the tar get IQA datasets. Secondly , a reliable ranking loss can enhance the ability of the model to rank images in terms of quality and thus help to generate more precise quality scores [ 7 ]. The fact that quality score of 24 A P R E P R I N T the whole synthesized image can not directly be distributed to all the image patches does not mean that the image can not be processed patch by patch. The main challenge is to find a proper pooling method to get the overall quality score. Although the pre-trained deep features hav e been successfully used in metrics [ 78 , 79 ], more efforts could be made to create a more general and effecti v e end-to-end deep model. 6 Conclusion In this paper , we present an up-to-date overvie w for the quality assessment methods of DIBR-synthesized views. W e firstly described the e xisting DIBR-synthesized vie w datasets. Secondly , we analysed and discussed the recently proposed state-of-the-art objectiv e quality metrics for DIBR-synthesized vie ws, and classified them into different categories based on their used approaches. Then, we conducted a reliable experiment to compare the performance of each metric, and analysed their advantages and disadv antages at the same time. Furthermore, we discussed the potential challenges and directions for future research. W e hope this overvie w can help to better understand the state-of-the-art of this research topic and provide insights to design better metrics and experiments for effecti ve DIBR-synthesized images/videos quality ev aluation. Acknowledgment The authors would lik e to thank Dr . Suiyi Ling and Dr . Y u Zhou for sharing their code. W e would also like to thank Prof. Patrick Le Callet and Dr . Lucas Krasula for their kind advices on the e xperiment. This work was supported in part by the NSFC Project under Grants 61771321 and 61872429, in part by the Guangdong Key Research Platform of Univ ersities under Grants 2018WCXTD015, in part by the Natural Science Foundation of Guangdong Province, China, under Grants 2020A1515010959, and in part by the Interdisciplinary Innov ation T eam of Shenzhen Univ ersity . References [1] C. Fehn, Depth-Image-Based Rendering (DIBR), compression, and transmission for a new approach on 3D-TV, in: Electronic Imaging 2004, International Society for Optics and Photonics, 2004, pp. 93–104. [2] W . Sun, L. Xu, O. C. Au, S. H. Chui, C. W . Kwok, An ov erview of free vie w-point depth-image-based rendering (dibr), in: APSIP A Annual Summit and Conference, 2010, pp. 1023–1030. [3] L. Jiao, H. Wu, H. W ang, R. Bie, Multi-scale semantic image inpainting with residual learning and gan, Neurocomputing 331 (2019) 199–212. [4] Z. W ang, A. C. Bovik, H. R. Sheikh, E. P . Simoncelli, Image quality assessment: from error visibility to structural similarity , IEEE Transactions on Image Processing 13 (4) (2004) 600–612. doi:10.1109/TIP.2003.819861 . [5] Z. W ang, E. P . Simoncelli, A. C. Bovik, Multiscale structural similarity for image quality assessment, in: Conference Record of the Thirty-Seventh Asilomar Conference on Signals, Systems and Computers, 2004., V ol. 2, IEEE, 2003, pp. 1398–1402. [6] L. Li, Y . Zhou, W . Lin, J. W u, X. Zhang, B. Chen, No-reference quality assessment of deblocked images, Neurocomputing 177 (2016) 572–584. [7] X. Jiang, L. Shen, L. Y u, M. Jiang, G. Feng, No-reference screen content image quality assessment based on multi-region features, Neurocomputing (2019). [8] Q. Li, W . Lin, K. Gu, Y . Zhang, Y . F ang, Blind image quality assessment based on joint log-contrast statistics, Neurocomputing 331 (2019) 189–198. [9] I. Ahn, C. Kim, A novel depth-based virtual vie w synthesis method for free viewpoint video, IEEE T ransactions on Broadcasting 59 (4) (2013) 614–626. [10] V . Jantet, C. Guillemot, L. Morin, Object-based layered depth images for improved virtual view synthesis in rate-constrained context, in: Image Processing (ICIP), 2011 18th IEEE International Conference on, IEEE, 2011, pp. 125–128. [11] M. T animoto, T . Fujii, K. Suzuki, N. Fukushima, Y . Mori, Reference softw ares for depth estimation and vie w synthesis, ISO/IEC JTC1/SC29/WG11 MPEG 20081 (2008) M15377. [12] E. Bosc, R. Pepion, P . Le Callet, M. K oppel, P . Ndjiki-Nya, M. Pressigout, L. Morin, T owards a new quality metric for 3-d synthesized vie w assessment, IEEE Journal of Selected T opics in Signal Processing 5 (7) (2011) 1332–1343. 25 A P R E P R I N T [13] A. Criminisi, P . Pérez, K. T oyama, Region filling and object removal by ex emplar-based image inpainting, IEEE T ransactions on image processing 13 (9) (2004) 1200–1212. [14] A. T elea, An image inpainting technique based on the fast marching method, Journal of graphics tools 9 (1) (2004) 23–34. [15] A. Oliv eira, G. Fickel, M. W alter , C. Jung, Selectiv e hole-filling for depth-image based rendering, in: 2015 IEEE International Conference on Acoustics, Speech and Signal Processing (ICASSP), IEEE, 2015, pp. 1186–1190. [16] S. M. Muddala, M. Sjöström, R. Olsson, V irtual view synthesis using layered depth image generation and depth-based inpainting for filling disocclusions and translucent disocclusions, Journal of V isual Communication and Image Representation 38 (2016) 351–366. [17] G. Luo, Y . Zhu, Z. Li, L. Zhang, A hole filling approach based on background reconstruction for view synthesis in 3d video, in: Proceedings of the IEEE Conference on Computer V ision and Pattern Recognition, 2016, pp. 1781–1789. [18] C. Zhu, S. Li, Depth image based vie w synthesis: New insights and perspecti ves on hole generation and filling, IEEE T ransactions on Broadcasting 62 (1) (2016) 82–93. [19] S. T ian, L. Zhang, L. Morin, O. Déforges, A benchmark of dibr synthesized vie w quality assessment metrics on a new database for immersi v e media applications, IEEE T ransactions on Multimedia 21 (5) (2019) 1235–1247. doi:10.1109/TMM.2018.2875307 . [20] R. Song, H. K o, C. K uo, Mcl-3d: A database for stereoscopic image quality assessment using 2d-image-plus- depth source, Journal of Informatin Science and Engineering 31 (5) (2015) 1593–1611. [21] E. Bosc, P . Le Callet, L. Morin, M. Pressigout, V isual quality assessment of synthesized vie ws in the context of 3d-tv , in: 3D-TV system with depth-image-based rendering, Springer , 2013, pp. 439–473. [22] X. Liu, Y . Zhang, S. Hu, S. Kwong, C.-C. J. Kuo, Q. Peng, Subjectiv e and objectiv e video quality assessment of 3d synthesized views with te xture/depth compression distortion, IEEE Transactions on Image Processing 24 (12) (2015) 4847–4861. [23] Y . J. Jung, H. G. Kim, Y . M. Ro, Critical binocular asymmetry measure for the perceptual quality assessment of synthesized stereo 3d images in vie w synthesis, IEEE T ransactions on Circuits and Systems for V ideo T echnology 26 (7) (2016) 1201–1214. [24] Y . Mori, N. Fukushima, T . Y endo, T . Fujii, M. T animoto, V ie w generation with 3d warping using depth information for ftv , Signal Processing: Image Communication 24 (1) (2009) 65–72. [25] K. Mueller , A. Smolic, K. Dix, P . Merkle, P . Kauf f, T . W iegand, V ie w synthesis for advanced 3d video systems, EURASIP Journal on Image and V ideo Processing 2008 (1) (2009) 1–11. [26] P . Ndjiki-Nya, M. Köppel, D. Doshkov , H. Lakshman, P . Merkle, K. Müller , T . W iegand, Depth image based rendering with adv anced texture synthesis, in: 2010 IEEE International Conference on Multimedia and Expo (ICME), IEEE, 2010, pp. 424–429. [27] P . Ndjiki-Nya, M. K oppel, D. Doshko v , H. Lakshman, P . Merkle, K. Muller , T . W iegand, Depth image-based rendering with advanced texture synthesis for 3-d video, IEEE T ransactions on Multimedia 13 (3) (2011) 453–465. [28] M. Köppel, P . Ndjiki-Nya, D. Doshkov , H. Lakshman, P . Merkle, K. Müller, T . W ie gand, T emporally consistent handling of disocclusions with texture synthesis for depth-image-based rendering, in: 2010 IEEE International Conference on Image Processing, IEEE, 2010, pp. 1809–1812. [29] M. Solh, G. AlRegib, Hierarchical hole-filling for depth-based view synthesis in ftv and 3d video, IEEE Journal of Selected T opics in Signal Processing 6 (5) (2012) 495–504. [30] Y . W ang, Y . Shuai, Y . Zhu, J. Zhang, P . An, Jointly learning perceptually heterogeneous features for blind 3d video quality assessment, Neurocomputing 332 (2019) 298–304. [31] J. Y ang, Y . Zhu, C. Ma, W . Lu, Q. Meng, Stereoscopic video quality assessment based on 3d con volutional neural networks, Neurocomputing 309 (2018) 83–93. [32] S. S. Y oon, H. Sohn, Y . J. Jung, Y . M. Ro, Inter-view consistent hole filling in view extrapolation for multi- view image generation, in: Image Processing (ICIP), 2014 IEEE International Conference on, IEEE, 2014, pp. 2883–2887. [33] G. J. Sulli van, J. M. Boyce, Y . Chen, J.-R. Ohm, C. A. Se gall, A. V etro, Standardized extensions of high ef ficiency video coding (hevc), IEEE Journal of selected topics in Signal Processing 7 (6) (2013) 1001–1016. 26 A P R E P R I N T [34] IVC-IRCCyN lab, IRCCyN/IVC DIBR image database, http://ivc.univ- nantes.fr/en/databases/ DIBR_Images/ , last accessed Aug. 30th 2017, [Online]. [35] E. Bosc, P . Le Callet, L. Morin, M. Pressigout, An edge-based structural distortion indicator for the quality assessment of 3d synthesized views, in: 2012 Picture Coding Symposium, IEEE, 2012, pp. 249–252. [36] P .-H. Conze, P . Robert, L. Morin, Objectiv e view synthesis quality assessment, in: IS&T/SPIE Electronic Imaging, International Society for Optics and Photonics, 2012, pp. 82881M–82881M. [37] F . Battisti, E. Bosc, M. Carli, P . Le Callet, S. Perugia, Objective image quality assessment of 3D synthesized views, Signal Processing: Image Communication 30 (2015) 78–88. [38] D. Sandi ´ c-Stankovi ´ c, F . Battisti, D. Kukolj, P . L. Callet, M. Carli, Free viewpoint video quality assessment based on morphological multiscale metrics, in: 2016 Eighth International Conference on Quality of Multimedia Experience (QoMEX), 2016, pp. 1–6. doi:10.1109/QoMEX.2016.7498949 . [39] D. Sandi ´ c-Stankovi ´ c, D. Kukolj, P . Le Callet, DIBR synthesized image quality assessment based on morphological wa velets, in: 2015 Seventh International W orkshop onQuality of Multimedia Experience (QoMEX), IEEE, 2015, pp. 1–6. [40] D. Sandi ´ c-Stankovi ´ c, D. Kukolj, P . Le Callet, Multi–scale synthesized view assessment based on morphological pyramids, Journal of Electrical Engineering 67 (1) (2016) 3–11. [41] S. Ling, P . Le Callet, G. Cheung, Quality assessment for synthesized view based on v ariable-length context tree, in: Multimedia Signal Processing (MMSP), 2017 IEEE 19th International W orkshop on, IEEE, 2017, pp. 1–6. [42] S. Ling, P . Le Callet, Image quality assessment for free viewpoint video based on mid-lev el contours feature, in: 2017 IEEE International Conference on Multimedia and Expo (ICME), 2017, pp. 79–84. doi:10.1109/ICME. 2017.8019431 . [43] S. Ling, P . Le Callet, Image quality assessment for dibr synthesized views using elastic metric, in: Proceedings of the 2017 A CM on Multimedia Conference, A CM, 2017, pp. 1157–1163. [44] Y . Zhao, L. Y u, A perceptual metric for ev aluating quality of synthesized sequences in 3dv system, in: V isual Communications and Image Processing 2010, International Society for Optics and Photonics, 2010, pp. 77440X– 77440X. [45] Y . Zhang, H. Zhang, M. Y u, S. Kwong, Y . Ho, Sparse representation-based video quality assessment for synthesized 3d videos, IEEE T ransactions on Image Processing 29 (2020) 509–524. [46] Y . Zhou, L. Li, K. Gu, Y . Fang, W . Lin, Quality assessment of 3d synthesized images via disoccluded region discov ery , in: 2016 IEEE International Conference on Image Processing (ICIP), IEEE, 2016, pp. 1012–1016. [47] S. T ian, L. Zhang, L. Morin, O. Deforges, A full-reference image quality assessment metric for 3d synthesized views, in: Image Quality and System Performance Conference, at IS&T Electronic Imaging 2018, Society for Imaging Science and T echnology , 2018. [48] S. Tian, L. Zhang, L. Morin, O. Déforges, Sc-iqa: Shift compensation based image quality assessment for dibr-synthesized vie ws, in: IEEE International Conference on V isual Communications and Image Processing, 2018. [49] Y . Zhou, L. Li, S. Ling, P . Le Callet, Quality assessment for view synthesis using lo w-le vel and mid-lev el structural representation, Signal Processing: Image Communication 74 (2019) 309–321. [50] S. Ling, J. Li, P . Le Callet, J. W ang, Perceptual representations of structural information in images: application to quality assessment of synthesized view in ftv scenario, in: 2019 IEEE International Conference on Image Processing (ICIP), IEEE, 2019, pp. 1735–1739. [51] X. W ang, F . Shao, Q. Jiang, R. Fu, Y . Ho, Quality assessment of 3d synthesized images via measuring local feature similarity and global sharpness, IEEE Access 7 (2019) 10242–10253. [52] D. Sandic-Stankovic, D. K ukolj, P . Le Callet, DIBR-synthesized image quality assessment based on morphologi- cal multi-scale approach, EURASIP Journal on Image and V ideo Processing 2017 (1) (2016) 4. [53] V . Jakhetiya, K. Gu, W . Lin, Q. Li, S. P . Jaiswal, A prediction backed model for quality asses sment of screen content and 3-d synthesized images, IEEE T ransactions on Industrial Informatics 14 (2) (2017) 652–660. [54] L. Li, X. Chen, Y . Zhou, J. W u, G. Shi, Depth image quality assessment for vie w synthesis based on weighted edge similarity ., in: CVPR W orkshops, 2019, pp. 17–25. [55] T .-H. Le, S.-W . Jung, C. S. W on, A ne w depth image quality metric using a pair of color and depth images, Multimedia T ools and Applications 76 (9) (2017) 11285–11303. 27 A P R E P R I N T [56] M. S. Farid, M. Lucenteforte, M. Grangetto, Blind depth quality assessment using histogram shape analysis, in: 2015 3DTV -Conference: The T rue V ision-Capture, Transmission and Display of 3D V ideo (3DTV -CON), IEEE, 2015, pp. 1–5. [57] S. Xiang, L. Y u, C. W . Chen, No-reference depth assessment based on edge misalignment errors for t+ d images, IEEE T ransactions on Image Processing 25 (3) (2015) 1479–1494. [58] L. Li, X. Chen, J. W u, S. W ang, G. Shi, No-reference quality index of depth images based on statistics of edge profiles for view synthesis, Information Sciences 516 (2020) 205–219. [59] M. Solh, G. AlRegib, J. M. Bauza, 3vqm: A vision-based quality measure for dibr-based 3d videos, in: 2011 IEEE International Conference on Multimedia and Expo, 2011, pp. 1–6. doi:10.1109/ICME.2011.6011992 . [60] L. Li, Y . Zhou, K. Gu, W . Lin, S. W ang, Quality assessment of dibr-synthesized images by measuring local geometric distortions and global sharpness, IEEE T ransactions on Multimedia 20 (4) (2018) 914–926. [61] M. S. Farid, M. Lucenteforte, M. Grangetto, Perceptual quality assessment of 3d synthesized images, in: Multimedia and Expo (ICME), 2017 IEEE International Conference on, IEEE, 2017, pp. 505–510. [62] M. S. Farid, M. Lucenteforte, M. Grangetto, Objectiv e quality metric for 3d virtual views, in: 2015 IEEE International Conference on Image Processing (ICIP), IEEE, 2015, pp. 3720–3724. [63] M. S. Farid, M. Lucenteforte, M. Grangetto, Ev aluating virtual image quality using the side-vie ws information fusion and depth maps, Information Fusion 43 (2018) 47–56. [64] K. Gu, V . Jakhetiya, J.-F . Qiao, X. Li, W . Lin, D. Thalmann, Model-based referenceless quality metric of 3d synthesized images using local image description, IEEE T ransactions on Image Processing (2017). [65] V . Jakhetiya, K. Gu, T . Singhal, S. C. Guntuku, Z. Xia, W . Lin, A highly efficient blind image quality assessment metric of 3d-synthesized images using outlier detection, IEEE T ransactions on Industrial Informatics (2018). [66] K. Gu, J. Qiao, S. Lee, H. Liu, W . Lin, P . Le Callet, Multiscale natural scene statistical analysis for no-reference quality ev aluation of dibr -synthesized views, IEEE T ransactions on Broadcasting (2019). [67] D. D. Sandi ´ c-Stankovi ´ c, D. D. Kukolj, P . Le Callet, Fast blind quality assessment of dibrsynthesized video based on high-high wa velet subband, IEEE T ransactions on Image Processing (2019). [68] S. T ian, L. Zhang, L. Morin, O. Déforges, NIQSV: A no reference image quality assessment metric for 3D synthesized vie ws, in: IEEE International Conference on Acoustics, Speech and Signal Processing (ICASSP), IEEE, 2017. [69] S. T ian, L. Zhang, L. Morin, O. Déforges, NIQSV+: A No-Reference Synthesized V ie w Quality Assessment Metric, IEEE T ransactions on Image Processing 27 (4) (2018) 1652–1664. [70] F . Shao, Q. Y uan, W . Lin, G. Jiang, No-reference view synthesis quality prediction for 3-d videos based on color–depth interactions, IEEE T ransactions on Multimedia 20 (3) (2017) 659–674. [71] G. Y ue, C. Hou, K. Gu, T . Zhou, G. Zhai, Combining local and global measures for dibr-synthesized image quality ev aluation, IEEE T ransactions on Image Processing 28 (4) (2018) 2075–2088. [72] G. W ang, Z. W ang, K. Gu, Z. Xia, Blind quality assessment for 3d-synthesized images by measuring geometric distortions and image complexity , in: ICASSP 2019-2019 IEEE International Conference on Acoustics, Speech and Signal Processing (ICASSP), IEEE, 2019, pp. 4040–4044. [73] G. W ang, Z. W ang, K. Gu, L. Li, Z. Xia, L. W u, Blind quality metric of dibr-synthesized images in the discrete wa velet transform domain., IEEE transactions on image processing: a publication of the IEEE Signal Processing Society (2019). [74] Y . Zhou, L. Li, S. W ang, J. W u, Y . Fang, X. Gao, No-reference quality assessment for view synthesis using dog-based edge statistics and texture naturalness, IEEE T ransactions on Image Processing (2019). [75] H. G. Kim, Y . M. Ro, Measurement of critical temporal inconsistency for quality assessment of synthesized video, in: 2016 IEEE International Conference on Image Processing (ICIP), IEEE, 2016, pp. 1027–1031. [76] Y . Zhou, L. Li, S. W ang, J. W u, Y . Zhang, No-reference quality assessment of dibr-synthesized videos by measuring temporal flickering, Journal of V isual Communication and Image Representation 55 (2018) 30–39. [77] S. Ling, P . Le Callet, How to learn the ef fect of non-uniform distortion on percei ved visual quality? case study using con volutional sparse coding for quality assessment of synthesized views, in: 2018 25th IEEE International Conference on Image Processing (ICIP), IEEE, 2018, pp. 286–290. [78] X. W ang, K. W ang, B. Y ang, F . W . B. Li, X. Liang, Deep blind synthesized image quality assessment with contextual multi-lev el feature pooling, in: 2019 IEEE International Conference on Image Processing (ICIP), 2019, pp. 435–439. doi:10.1109/ICIP.2019.8802943 . 28 A P R E P R I N T [79] S. Ling, J. Li, J. W ang, P . L. Callet, Gans-nqm: A generativ e adversarial netw orks based no reference quality assessment metric for RGB-D synthesized views, CoRR abs/1903.12088 (2019). . URL [80] J. J. Lim, C. L. Zitnick, P . Dollár, Sketch tokens: A learned mid-level representation for contour and object detection, in: 2013 IEEE Conference on Computer V ision and P attern Recognition, 2013, pp. 3158–3165. [81] P . Dollár , Z. T u, P . Perona, S. Belongie, Inte gral channel features (2009). [82] E. Shechtman, M. Irani, Matching local self-similarities across images and videos., in: CVPR, V ol. 2, Minneapolis, MN, 2007, p. 3. [83] S. Ling, J. Gutiérrez, K. Gu, P . Le Callet, Prediction of the influence of navigation scan-path on percei v ed quality of free-viewpoint videos, IEEE Journal on Emerging and Selected T opics in Circuits and Systems 9 (1) (2019) 204–216. [84] W . Mio, A. Sriv asta va, S. Joshi, On shape of plane elastic curves, International Journal of Computer V ision 73 (3) (2007) 307–324. [85] A. Sri vasta va, E. Klassen, S. H. Joshi, I. H. Jermyn, Shape analysis of elastic curves in euclidean spaces, IEEE T ransactions on Pattern Analysis and Machine Intelligence 33 (7) (2010) 1415–1428. [86] H. Freeman, Application of the generalized chain coding scheme to map data processing., T ech. rep., RENS- SELAER POL YTECHNIC INST TR O Y NY DEPT OF ELECTRICAL AND SYSTEMS ENGINEERING (1978). [87] A. Zheng, G. Cheung, D. Florencio, Context tree-based image contour coding using a geometric prior, IEEE T ransactions on Image Processing 26 (2) (2016) 574–589. [88] V . Jakhetiya, O. C. Au, S. Jaisw al, L. Jia, H. Zhang, Fast and ef ficient intra-frame deinterlacing using observ ation model based bilateral filter , in: 2014 IEEE International Conference on Acoustics, Speech and Signal Processing (ICASSP), 2014, pp. 5819–5823. doi:10.1109/ICASSP.2014.6854719 . [89] J. W u, W . Lin, G. Shi, A. Liu, Reduced-reference image quality assessment with visual information fidelity , IEEE T ransactions on Multimedia 15 (7) (2013) 1700–1705. doi:10.1109/TMM.2013.2266093 . [90] F . Battisti, 3DSwIM Source Code, http://www.comlab.uniroma3.it/3DSwIM.html , last accessed Aug. 30th 2017, [Online]. [91] H. W . Lilliefors, On the kolmogorov-smirno v test for normality with mean and variance unkno wn, Journal of the American statistical Association 62 (318) (1967) 399–402. [92] P . Maragos, R. W . Schafer , Morphological systems for multidimensional signal processing, Proceedings of the IEEE 78 (4) (1990) 690–710. [93] J. H. W esterink, K. T eunissen, Percei ved sharpness in comple x moving images, Displays 16 (2) (1995) 89–97. [94] A. K. Moorthy , A. C. Bovik, V isual importance pooling for image quality assessment, IEEE journal of selected topics in signal processing 3 (2) (2009) 193–201. [95] H. Jiang, J. W ang, Z. Y uan, Y . W u, N. Zheng, S. Li, Salient object detection: A discriminativ e regional feature integration approach, in: Computer V ision and Pattern Recognition (CVPR), 2013 IEEE Conference on, IEEE, 2013, pp. 2083–2090. [96] P . Ko vesi, et al., Image features from phase congruenc y , V idere: Journal of computer vision research 1 (3) (1999) 1–26. [97] B. Julesz, Cyclopean perception and neurophysiology , In v estigativ e Ophthalmology & V isual Science 11 (6) (1972) 540–548. [98] P . C. T eo, D. J. Heeger , Perceptual image distortion, in: Human V ision, V isual Processing, and Digital Display V , V ol. 2179, International Society for Optics and Photonics, 1994, pp. 127–141. [99] B. K. Patra, R. Launonen, V . Ollikainen, S. Nandi, A new similarity measure using bhattacharyya coefficient for collaborativ e filtering in sparse data, Kno wledge-Based Systems 82 (2015) 163–177. [100] K. Gu, G. Zhai, W . Lin, X. Y ang, W . Zhang, V isual saliency detection with free energy theory , IEEE Signal Processing Letters 22 (10) (2015) 1552–1555. [101] L. T ang, L. Li, K. Gu, X. Sun, J. Zhang, Blind quality index for camera images with natural scene statistics and patch-based sharpness assessment, Journal of V isual Communication and Image Representation 40 (2016) 335–344. 29 A P R E P R I N T [102] Y . Zhang, T . D. Phan, D. M. Chandler, Reduced-reference image quality assessment based on distortion families of local perceiv ed sharpness, Signal Processing: Image Communication 55 (2017) 130–145. [103] K. Gu, G. Zhai, W . Lin, X. Y ang, W . Zhang, No-reference image sharpness assessment in autoregressi ve parameter space, IEEE T ransactions on Image Processing 24 (10) (2015) 3218–3231. [104] K. Gu, G. Zhai, W . Lin, X. Y ang, W . Zhang, No-reference image sharpness assessment in autoregressi ve parameter space, IEEE T ransactions on Image Processing 24 (10) (2015) 3218–3231. doi:10.1109/TIP.2015.2439035 . [105] X. Min, K. Gu, G. Zhai, J. Liu, X. Y ang, C. W . Chen, Blind quality assessment based on pseudo-reference image, IEEE T ransactions on Multimedia 20 (8) (2018) 2049–2062. [106] R. Ferzli, L. J. Karam, A no-reference objecti ve image sharpness metric based on the notion of just noticeable blur (jnb), IEEE T ransactions on Image Processing 18 (4) (2009) 717–728. [107] A. Cohen, I. Daubechies, J.-C. Feauveau, Biorthogonal bases of compactly supported wa velets, Communications on pure and applied mathematics 45 (5) (1992) 485–560. [108] K. Gu, J. Zhou, J.-F . Qiao, G. Zhai, W . Lin, A. C. Bovik, No-reference quality assessment of screen content pictures, IEEE T ransactions on Image Processing 26 (8) (2017) 4005–4018. [109] K. Gu, W . Lin, G. Zhai, X. Y ang, W . Zhang, C. W . Chen, No-reference quality metric of contrast-distorted images based on information maximization, IEEE transactions on cybernetics 47 (12) (2016) 4559–4565. [110] M. A. Saad, A. C. Bovik, C. Charrier , Blind image quality assessment: A natural scene statistics approach in the dct domain, IEEE T ransactions on Image Processing 21 (8) (2012) 3339–3352. [111] M. A. Saad, A. C. Bovik, C. Charrier , DCT statistics model-based blind image quality assessment, in: 2011 18th IEEE International Conference on Image Processing (ICIP)„ IEEE, 2011, pp. 3093–3096. [112] A. K. Moorthy , A. C. Bovik, Blind image quality assessment: From natural scene statistics to perceptual quality , IEEE transactions on Image Processing 20 (12) (2011) 3350–3364. [113] L. Liu, H. Dong, H. Huang, A. C. Bovik, No-reference image quality assessment in curvelet domain, Signal Processing: Image Communication 29 (4) (2014) 494 – 505. doi:https://doi.org/10.1016/j.image. 2014.02.004 . [114] C. Li, Y . Zhang, X. W u, W . Fang, L. Mao, Blind multiply distorted image quality assessment using rele vant perceptual features, in: 2015 IEEE International Conference on Image Processing (ICIP), 2015, pp. 4883–4886. doi:10.1109/ICIP.2015.7351735 . [115] D. Martin, C. Fo wlkes, D. T al, J. Malik, A database of human segmented natural images and its application to ev al- uating segmentation algorithms and measuring ecological statistics, in: Proceedings Eighth IEEE International Conference on Computer V ision. ICCV 2001, V ol. 2, 2001, pp. 416–423 vol.2. [116] X. Y ang, F . Li, H. Liu, A surve y of dnn methods for blind image quality assessment, IEEE Access 7 (2019) 123788–123806. [117] X. Y e, X. Ji, B. Sun, S. Chen, Z. W ang, H. Li, Drm-slam: T o wards dense reconstruction of monocular slam with scene depth fusion, Neurocomputing (2020). [118] Y . Lei, W . Du, Q. Hu, Face sketch-to-photo transformation with multi-scale self-attention gan, Neurocomputing (2020). [119] J. Kim, H. Zeng, D. Ghadiyaram, S. Lee, L. Zhang, A. C. Bovik, Deep con volutional neural models for picture- quality prediction: Challenges and solutions to data-driv en image quality assessment, IEEE Signal Processing Magazine 34 (6) (2017) 130–141. [120] N. Zhuang, Q. Zhang, C. Pan, B. Ni, Y . Xu, X. Y ang, W . Zhang, Recognition oriented facial image quality assessment via deep con volutional neural netw ork, Neurocomputing 358 (2019) 109–118. [121] O. Russakovsk y , J. Deng, H. Su, J. Krause, S. Satheesh, S. Ma, Z. Huang, A. Karpathy , A. Khosla, M. Bernstein, A. C. Berg, L. Fei-Fei, ImageNet Lar ge Scale V isual Recognition Challenge, International Journal of Computer V ision (IJCV) 115 (3) (2015) 211–252. doi:10.1007/s11263- 015- 0816- y . [122] K. He, X. Zhang, S. Ren, J. Sun, Deep residual learning for image recognition, in: 2016 IEEE Conference on Computer V ision and Pattern Recognition (CVPR), 2016, pp. 770–778. doi:10.1109/CVPR.2016.90 . [123] I. Goodfellow , J. Pouget-Abadie, M. Mirza, B. Xu, D. W arde-Farle y , S. Ozair , A. Courville, Y . Bengio, Generativ e adversarial nets, in: Adv ances in neural information processing systems, 2014, pp. 2672–2680. [124] M. Everingham, S. A. Eslami, L. V an Gool, C. K. W illiams, J. W inn, A. Zisserman, The pascal visual object classes challenge: A retrospectiv e, International journal of computer vision 111 (1) (2015) 98–136. 30 A P R E P R I N T [125] B. Zhou, A. Lapedriza, A. Khosla, A. Oliva, A. T orralba, Places: A 10 million image database for scene recognition, IEEE T ransactions on P attern Analysis and Machine Intelligence 40 (6) (2018) 1452–1464. doi: 10.1109/TPAMI.2017.2723009 . [126] M. Manassi, B. Sayim, M. H. Herzog, When crowding of crowding leads to uncrowding, Journal of V ision 13 (13) (2013) 10–10. [127] A. Moorthy , A. Bovik, A modular framework for constructing blind uni versal quality indices, IEEE Signal Processing Letters 17 (2009). [128] V . Q. E. Group, Final report from the video quality experts group on the v alidation of objectiv e models of multimedia quality assessment, VQEG (March 2008). [129] L. Krasula, K. Fliegel, P . Le Callet, M. Klíma, On the accuracy of objective image and video quality models: New methodology for performance e v aluation, in: Quality of Multimedia Experience (QoMEX), 2016 Eighth International Conference on, IEEE, 2016, pp. 1–6. [130] S. Tian, Image quality assessment of 3d synthesized vie ws, Ph.D. thesis, Rennes, INSA (2019). [131] K. Seshadrinathan, A. C. Bovik, Motion tuned spatio-temporal quality assessment of natural videos, IEEE transactions on image processing 19 (2) (2009) 335–350. [132] R. Soundararajan, A. C. Bovik, V ideo quality assessment by reduced reference spatio-temporal entropic dif fer- encing, IEEE T ransactions on Circuits and Systems for V ideo T echnology 23 (4) (2012) 684–694. [133] C. G. Bampis, P . Gupta, R. Soundararajan, A. C. Bovik, Speed-qa: Spatial efficient entropic differencing for image and video quality , IEEE signal processing letters 24 (9) (2017) 1333–1337. [134] A. Mittal, M. A. Saad, A. C. Bovik, A completely blind video integrity oracle, IEEE T ransactions on Image Processing 25 (1) (2015) 289–300. [135] C. Sun, X. Liu, W . Y ang, An efficient quality metric for dibr -based 3d video, in: 2012 IEEE 14th International Conference on High Performance Computing and Communication & 2012 IEEE 9th International Conference on Embedded Software and Systems, IEEE, 2012, pp. 1391–1394. [136] L. Fei-Fei, R. Fer gus, P . Perona, One-shot learning of object categories, IEEE transactions on pattern analysis and machine intelligence 28 (4) (2006) 594–611. [137] J. Snell, K. Swersky , R. Zemel, Prototypical networks for few-shot learning, in: Advances in Neural Information Processing Systems, 2017, pp. 4077–4087. [138] X. Liu, J. v an de W eijer , A. D. Bagdanov , Rankiqa: Learning from rankings for no-reference image quality assessment, in: Proceedings of the IEEE International Conference on Computer V ision, 2017, pp. 1040–1049. 31
Original Paper
Loading high-quality paper...
Comments & Academic Discussion
Loading comments...
Leave a Comment