Phase mapping for cardiac unipolar electrograms with neural network instead of phase transformation
A phase mapping is an approach to processing signals of electrograms recorded from the surface of cardiac tissue. The main concept of phase mapping is the application of the phase transformation with the aim to obtain signals with useful properties. …
Authors: Konstantin Ushenin, Tatyana Nesterova, Dmitry Shmarko
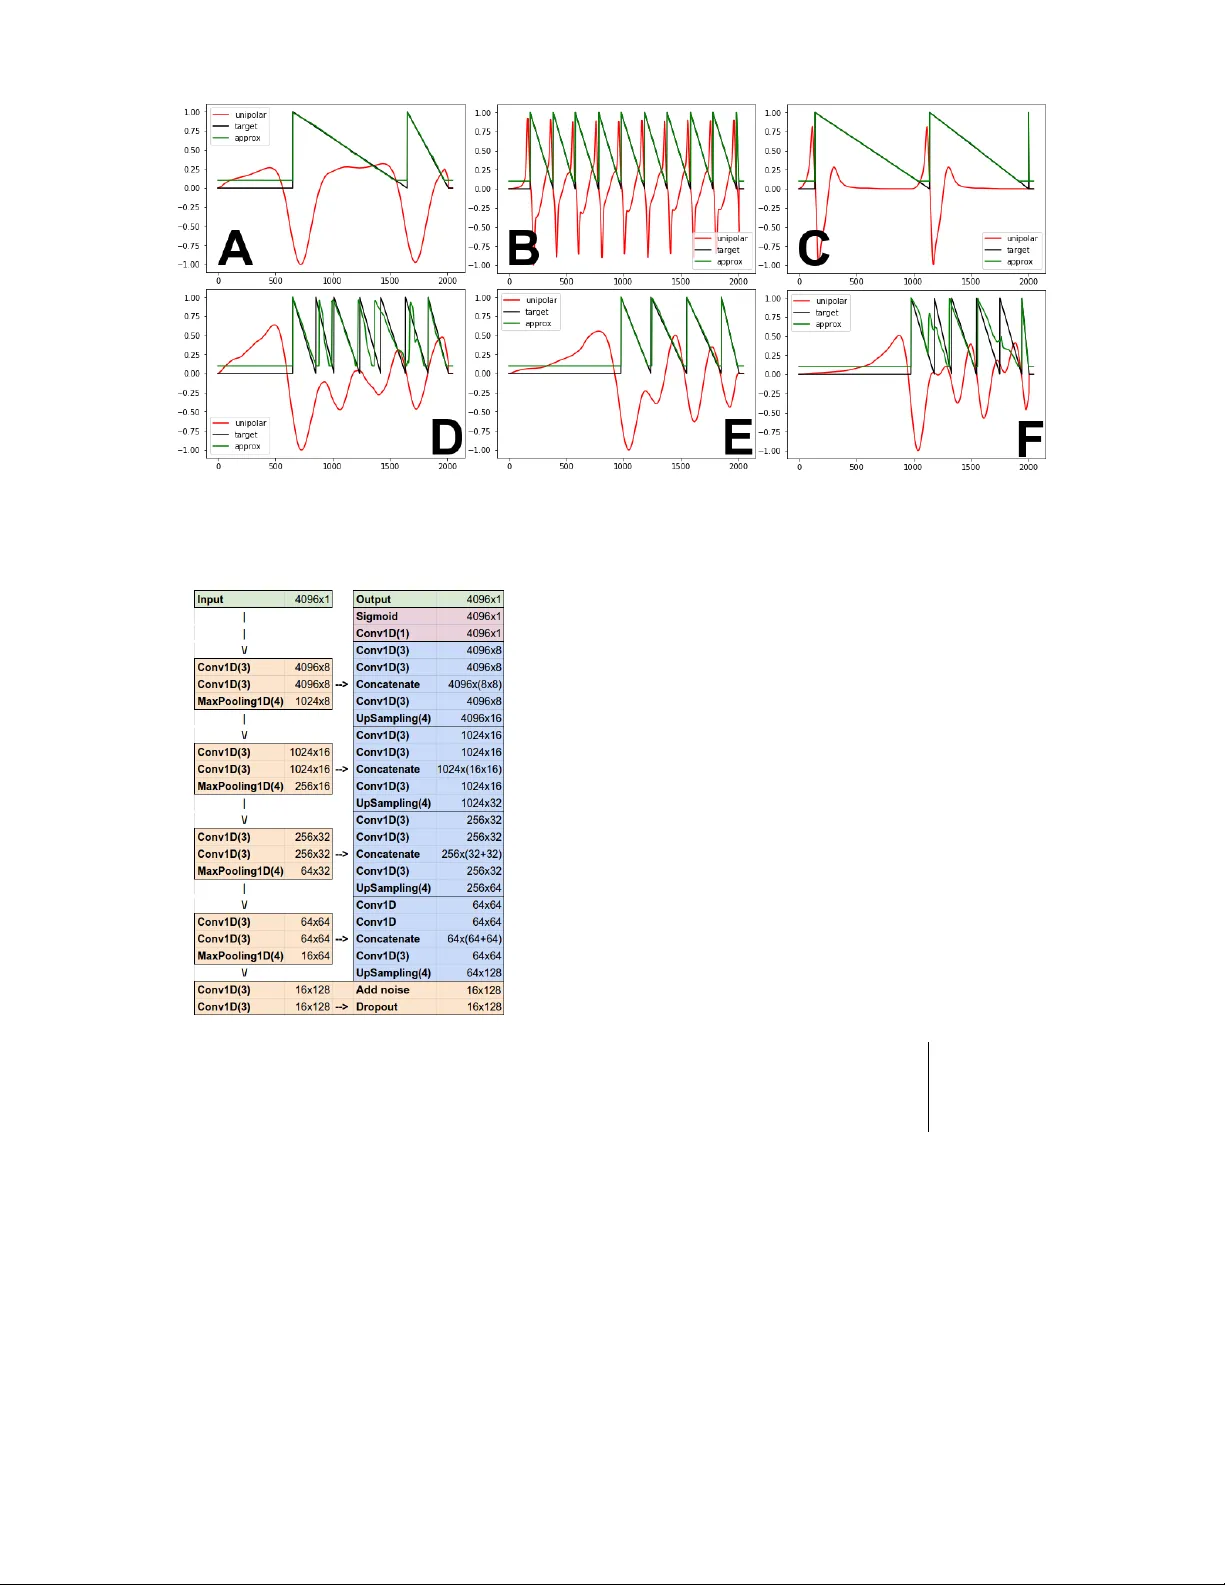
Phase Mapping for Cardiac Unipolar Electrograms with Neural Network Instead of Phase T ransformation K onstantin Ushenin Institute of Natural Sciences Ural F ederal Univer sity Ekaterinbur g, Russia konstantin.ushenin@urfu.ru T atyana Nesterov a Laboratory of Mathematical Physiology Institute of Immunology and Physiology Ekaterinbur g, Russia tatiannesterov a@gmail.com Dmitry Smarko Laboratory of Mathematical Physiology Institute of Immunology and Physiology Ekaterinbur g, Russia d.shmarko@yandex.ru Vladimir Sholokhov Institute of Natural Sciences Ural F ederal Univer sity Ekaterinbur g, Russia vdsholokhov@yande x.ru ©2020 IEEE. Personal use of this material is permitted. Permission from IEEE must be obtained for all other uses, in any current or future media, including reprinting/republishing this material for advertising or promotional purposes,creating new collectiv e works, for resale or redistribution to servers or lists, or reuse of any cop yrighted component of this work in other works. Conference: 2020 Ural Symposium on Biomedical Engineering, Radioelectronics and Information T echnology (USBEREIT). Preprint available here: https://arxiv .org/abs/1911.09731 Abstract —A phase mapping is an appr oach to processing signals of electrograms that ar e recorded from the surface of cardiac tissue. The main concept of the phase mapping is an application of the phase transf ormation with the aim to obtain signals with useful properties. In our study , we propose to use a simple sawtooth signal instead of a phase of a signal for processing of electrogram data and building of the phase maps. W e denote transformation that can provide this signal as a phase- like transf ormation (PL T). PL T defined via a con v olutional neural network that is trained on a dataset from computer models of cardiac tissue electrophysiology . The proposed approaches were validated on data from the detailed personalized model of the human torso electrophysiology . This paper includes visualization of the phase map based on PL T and shows the applicability of the proposed approaches in the analysis of the complex non- stationary periodic activity of the excitable cardiac tissue. Index T erms —digital signal processing, neural network, con vo- lutional neural network, unipolar electrogram, cardiac mapping, phase mapping, cardiology , electrophysiological study I . I N T R O D U C T I O N A unipolar electrogram is a popular method for in v asiv e electrophysiological studies in cardio-surgery [1]. Cardiac mapping is a modern extension of a unipolar electrogram analysis that presents cardiac electrophysiology in the format of maps or video maps. The most complex processing is required for the presen- tation of the periodic and non-stationary periodic activity of myocardium (cardiac muscle tissue). This activity usually observed during the ventricular tachycardia or atrial flutter . A phase mapping is the most common approach for processing of such type of data. These approaches were widely used The reported study was funded by RFBR, according to the research project No. 18-31-00401. Development of the mathematical models is supported by IIF UrB RAS theme #AAAA-A19-119070190064-4, RF Government Act #211 of March 16, 2013, the Program of the Presidium RAS. in biological in vitr o experiments [2]–[4], and lately was translated to clinical practice [5]–[7]. The phase mapping approach includes two parts. The first part is the phase transformation of the signals that are recorded from sev eral leads, and the second part is an interpolation and spatial analysis of all phase signals (see Fig. 1). The phase transformation usually based on a shift in time or Hilbert transform [7]. Also, several alternati ve approaches were proposed [5]. Here, we are aiming to replace the phase transformation on the more robust approach. W e propose to use a sawtooth signal with [0,1] range of values. These signals should have breaks that related to depolarization of transmembrane poten- tial in cardiomyocytes in point of measurements. Between two depolarizations, the signal should linearly decrease from 1 to 0 value. Fig. 2 shows the proposed signal and its relationship with the cardiomyocyte transmembrane potential. This signal should be obtained from unipolar electrogram with some transformation. W e named this transformation as the phase-like transformation (PL T). In contradiction to pre- viously proposed approaches [2]–[7] we do not define this transformation as series of mathematical operations (see Fig. 1 (B1)). W e define the PL T via training of neural network on series of simple 1D model of myocardial electrophysiology (see Fig. 1 (B2)). For proof-of-concept, we test the proposed idea with the more complex and detailed model of the human heart electro- physiology . I I . M E T H O D S In this study , a simple 1D model of the myocardium provides a series of action potentials. These action potentials con verted to unipolar signals with a simple equation. Obtained signals separated into the training and validation dataset. Then, Fig. 1. The main idea of the current paper . A phase mapping is an approach to process data from unipolar electrodes placed on the myocardium. It is shown on the top row (A, B, C). Some parts of the phase mapping require the processing of signals from each electrode (B). The signal processing pipeline here is usually a sequence of mathematical transformations (B1). W e propose to use a computer model of a 1D myocardial strand for the generation of training datasets for the neural networks (B2). The trained neural network can replace all steps of the pipeline. Abbreviations: analog-to-digital con verter (ADC), digital signal processing (DSP), Neural network (NN). the neural network is trained on these datasets. The complex and realistic model of the human torso electrophysiology provides action potentials and extracellular potential, and the last one is very close to the real unipolar signals. Extracellular potentials are processed with the neural network for build phase maps based on the PL T transformation. In the end, these maps are compared with true electrophysiological activity in the myocardium that is sho wn via a map of the action potentials from the realistic model in a fixed point in time. Idealized 1D models of myocar dial tissue were computed with the monodomain equation. The 1D strand contained 1024 points, and the activ ation point was located in 128 nodes from one side of the strands. TNNP06 [8] described electrophysio- logical activity of ventricular cardiomyocytes respectiv ely . Unipolar electr ograms from 1D strand were obtained with the following formula [9]: φ ( x 0 ) = − κ Z x ∂ V ∂ x · ∂ ∂ x 1 p ( x − x 0 ) 2 + h 2 dx, (1) where V is the transmembrane potential in point x , φ is an extracellular potential or signal from a unipolar catheter, h is the height of the catheter above the 1D strand, and x 0 is an electrode position. The coef ficient κ and a voltage in absolute physical v alues are not important for our study because we normalized results using the division of each signal to their maximal absolute amplitude. T raining and validation datasets were generated with a vari- ation of the following 1D model parameters: the stimulation frequency ( F R = { 2000 , 1000 , 500 , 300 , 200 } Hz), conduc- tion velocity ( C V = { 10 , 20 , 40 , 80 } ). Parameters of the cardiomyocytes in the 1D strand were taken from the original Fig. 2. Explanation of phase-like transformation (PL T). In phase map process- ing, the original electrogram signal (blue line; visualized after normalization) is transformed to the phase signal (orange line). W e propose to use the sawtooth signal (black line) that has basic properties of phase signal but is significantly simpler. article [8] without changes. Also, the follo wing parameters of the (1) equation were v ariated: height of electrode ov er the strand ( h = { 5 , 10 , 20 , 50 , 80 } ) and position of electrode along the strand ( x 0 = { 448 , 512 , 640 } ). As shown in Fig. 3, used ranges of parameter variation provide significantly different signals for analysis and cover all possible signal shapes, av ailable from the real recordings. PL T signals for training were generated from action po- tential using a 0 mV threshold lev el as criteria for the depolarization phase (break of the function). Examples of PTL signals are shown in Fig. 3. Thus, the full datasets of simple model results contained 300 signals with 4096 ms lengths and 1000 Hz frequency of discretization. The training and validation datasets respectiv ely contain 150 (50%) and 150 (50%) signals. The test dataset was generated by a detailed personalized finite element model of two ventricles and the torso. Model geometry was based on computed tomography data of one patient. The torso includes regions of the heart, lungs, blood in heart chambers, and spinal cord. Each torso re gion had realistic conductivity , according to [10]. The heart included realistic conduction anisotropy that was introduced with a rule-based approach and realistic heterogeneity of current transmembrane densities [11]. The TNNP06 model [8] performed a realistic simulation of cardiomyocytes electrophysiology . A bidomain model with bath described e xcitation wa ve propagation and the torso electrophysiology . W e initiate a spiral wa ve using the S1S2 protocol to provide the realistic extracellular potential for ventricular arrhythmia of the reentry type. Each point of the heart surface mesh provides one signal for the test dataset. Thus, the entire model provides 34354 signals with 4096 ms length. The described approach is one of the most realistic ways for the simulation of electrophysiology in both ventricles and the torso. In particular, this approach correctly includes the far -field effect. The used model was verified against clinical data of electrocardiography with 224 leads during activ ation of the myocardium from a point [12]. W e suppose that model complexity and a wide representation of physiological features make the model suitable for the generation of the test dataset. This dataset was used only with the neural network that is trained to process the signals from the ventricular myocardium. Con volutional neural network for pr ocessing was adapted Fig. 3. Examples of electrogram signals, target PL T signals, and PL T signals provided in the output of the neural network. The top row (A, B, C) shows a signal for periodic activation of the strand, and the bottom row (D, E, F) shows signals for strand activ ation on high frequency , which causes action potential alternations. Cases A, B, C, D, E were correctly processed by the neural network, and case F includes artifacts. Fig. 4. Architecture of the neural network. from the U-Net architecture for biomedical image segmenta- tion [13]. Fig. 4 presents our modifications. The size of all con volution kernels was replaced from 3x3 to 3x1 elements. The size of the pooling and up-sampling layers was replaced from 2x2 to 4x1 with an aim to increase the perception field of NN. The number of neurons in all layers was proportionally increased for the processing of input vectors with 4096 ele- ments. Also, we add Dropout (30%) and Gaussian noise layer (mean=0, std.=0.2) after the U-Net narrow layer for improving NN robustness. The loss function was a sum of the mean absolute error and mean squared error with equal weights. W e used the AD AM method of optimization with learning rate reduction on the plateau of validation loss. The NN process unipolar signals from windows with 4096 values and provides a PL T signal as an output with 4096 v alues. I I I . R E S U LT S The model of cardiac tissue provides a set of excitation wa ves for a normal healthy myocardium (Fig. 3 (A-B)) and additionally provide cases with alternance of action potentials (Fig. 3 (D-F)). The last ones appeared under high stimulation frequency at the 1D strand. Idealized models provide a set of unipolar electrograms with significant dif ferences between cases. The majority of signals were similar to clinically observed electrophysiological behaviour for sino-atrial rhythm (Fig. 3 (A, C), [1]), flutter or fibrillation (Fig. 3 (B, D–F), [14]). Ho we ver , some signals look atypical, and we suppose that the dataset covers both real and unobtainable cases of electrogram signals. T ABLE I M E TR I C S O F N EU R A L N E TW O R K P ER F O R MA N C E A T 1 5 0 E P OC H . M E A N A B SO L U T E ER R OR ( M AE ) , M E A N S QUA R E E R RO R ( M SE ) . Num. of cases V entricles MAE MSE T rain (1D) 150 0.0250 0.0021 V alidation (1D) 150 0.0327 0.0024 T est (3D) 34354 0.0888 0.0266 NN training requires 100+ epochs for reaching of a loss plateau. T able I sho ws the training process and the final value of the loss, respectiv ely . W e manually analyzed shapes of the sawtooth signals and counted a number of wrongly detected action potential upstrokes in the v alidation dataset. Only 10 out of 859 (1.16%) upstrokes were incorrectly identified. Qualitativ e analysis of NN outputs is presented in Fig. 3. NN perfectly processes any periodic signals and the major part of non-stationary periodic signals (see Fig. 3 (A–E)). Ho wev er , the model makes an error with some non-stationary periodic signals that contain double peaks with close placement (see Fig. 3 (F)). The model cannot reach zero lev els in zones Fig. 5. Phase maps based on PL T signals and action potential in a fixed point in time. Data were obtained in the detailed computer model of the ventricular tachycardia. without electrophysiological acti vity and in the ends of the sawtooth shapes. The result of the NN application on the realistic personal- ized model of human electrophysiology is presented in Fig. 5. As can be seen, the obtained quality of the phase map clearly rev eals the rotor core and the front of the excitation wa ves. Howe v er , the v alue of the mean absolute error metric here is at three and half times higher than the ones for 1D strand models (see T able I). I V . D I S C U S S I O N A N D C O N C L U S I O N In our study , we propose phase-like transformation (PL T) for processing unipolar electrograms and the method of its definition via the conv olutional neural network that is trained on a set of generated data from the numerical experiments. The proposed transformation provides signals with desirable properties as we planned in the beginning. It can rev eal complex non-stationary periodic beha vior in the myocardium and is applicable for the building of phase maps (see Fig. 5). Our approach to transformation definition significantly dif- fers from the method that was proposed before. It does not require a manual choice of signal transformations and filters with good basic properties. Instead of that, they require proper choice and tuning of sev eral models of the physiological process. Loss functions here are a direct way for assessment of the algorithm able to process complex data. W e suppose that the proposed approach has a wide area of application. It may be applied to the processing of unipolar electrograms from the unipolar catheter, multi-leads catheter , and balloons, microelectrode arrays, in vasi ve and non-in vasi ve systems of cardiac mapping [15], [16]. R E F E R E N C E S [1] U. B. T edro w and W . G. Ste venson, “Recording and interpreting unipolar electrograms to guide catheter ablation, ” Heart Rhythm , vol. 8, no. 5, pp. 791–796, 2011. [2] M.-A. Bray and J. P . W ikswo, “Considerations in phase plane analysis for nonstationary reentrant cardiac behavior , ” Physical Review E , vol. 65, no. 5, p. 051902, 2002. [3] M. P . Nash, A. Mourad, R. H. Clayton, P . M. Sutton, C. P . Bradley , M. Hayward, D. J. Paterson, and P . T aggart, “Evidence for multiple mechanisms in human ventricular fibrillation, ” Cir culation , vol. 114, no. 6, pp. 536–542, 2006. [4] K. Umapathy , K. Nair , S. Masse, S. Krishnan, J. Rogers, M. P . Nash, and K. Nanthakumar, “Phase mapping of cardiac fibrillation, ” Cir culation: Arrhythmia and Electrophysiolo gy , vol. 3, no. 1, pp. 105–114, 2010. [5] P . Kuklik, S. Zeemering, B. Maesen, J. Maessen, H. J. Crijns, S. V er- heule, A. N. Ganesan, and U. Schotten, “Reconstruction of instantaneous phase of unipolar atrial contact electrogram using a concept of sinusoidal recomposition and hilbert transform, ” IEEE transactions on biomedical engineering , vol. 62, no. 1, pp. 296–302, 2015. [6] R. V ijayakumar , S. K. V asireddi, P . S. Cuculich, M. N. Faddis, and Y . Rudy , “Methodology considerations in phase mapping of human cardiac arrhythmias, ” Circulation: Arrhythmia and Electr ophysiology , vol. 9, no. 11, p. e004409, 2016. [7] R. Dubois, A. Pashaei, J. Duchateau, and E. V igmond, “Electrocardio- graphic imaging and phase mapping approach for atrial fibrillation: A simulation study , ” in Computing in Cardiology Conference (CinC), 2016 . IEEE, 2016, pp. 117–120. [8] K. H. T en Tusscher and A. V . Panfilov , “ Alternans and spiral breakup in a human ventricular tissue model, ” American Journal of Physiology- Heart and Circulatory Physiology , vol. 291, no. 3, pp. H1088–H1100, 2006. [9] S. W einberg, S. Irav anian, and L. T ung, “Representation of collecti ve electrical behavior of cardiac cell sheets, ” Biophysical journal , vol. 95, no. 3, pp. 1138–1150, 2008. [10] D. U. Keller , F . M. W eber , G. Seemann, and O. Dossel, “Ranking the influence of tissue conductivities on forward-calculated ecgs, ” IEEE T ransactions on Biomedical Engineering , vol. 57, no. 7, pp. 1568–1576, 2010. [11] D. U. Keller , D. L. W eiss, O. Dossel, and G. Seemann, “Influence of i K s heterogeneities on the genesis of the t-wa ve: A computational ev aluation, ” IEEE T ransactions on Biomedical Engineering , vol. 59, no. 2, pp. 311–322, 2012. [12] K. S. Ushenin, A. Dokuchaev , S. M. Magomedova, O. V . Sopov , V . V . Kalinin, O. Solovyov a, and E. S. SA, “Role of myocardial properties and pacing lead location on ecg in personalized paced heart models, ” Age , vol. 67, p. 56, 2018. [13] O. Ronneberger , P . Fischer , and T . Brox, “U-net: Conv olutional networks for biomedical image segmentation, ” in International Confer ence on Medical image computing and computer-assisted intervention . Springer, 2015, pp. 234–241. [14] K. T . Konings, J. L. Smeets, O. C. Penn, H. J. W ellens, and M. A. Al- lessie, “Configuration of unipolar atrial electrograms during electrically induced atrial fibrillation in humans, ” Cir culation , vol. 95, no. 5, pp. 1231–1241, 1997. [15] A. Kalinin, D. Potyagaylo, and V . Kalinin, “Solving the inv erse problem of electrocardiography on the endocardium using a single layer source, ” F r ontiers in physiology , vol. 10, p. 58, 2019. [16] A. S. Revishvili, E. W issner , D. S. Lebedev , C. Lemes, S. Deiss, A. Metzner, V . V . Kalinin, O. V . Sopov , E. Z. Labartkav a, A. V . Kalinin et al. , “V alidation of the mapping accuracy of a novel non-inv asiv e epicardial and endocardial electrophysiology system, ” Eur opace , p. euu339, 2015.
Original Paper
Loading high-quality paper...
Comments & Academic Discussion
Loading comments...
Leave a Comment