Multi-scale fully convolutional neural networks for histopathology image segmentation: from nuclear aberrations to the global tissue architecture
Histopathologic diagnosis relies on simultaneous integration of information from a broad range of scales, ranging from nuclear aberrations ($\approx \mathcal{O}(0.1{\mu m})$) through cellular structures ($\approx \mathcal{O}(10{\mu m})$) to the globa…
Authors: R"udiger Schmitz, Frederic Madesta, Maximilian Nielsen
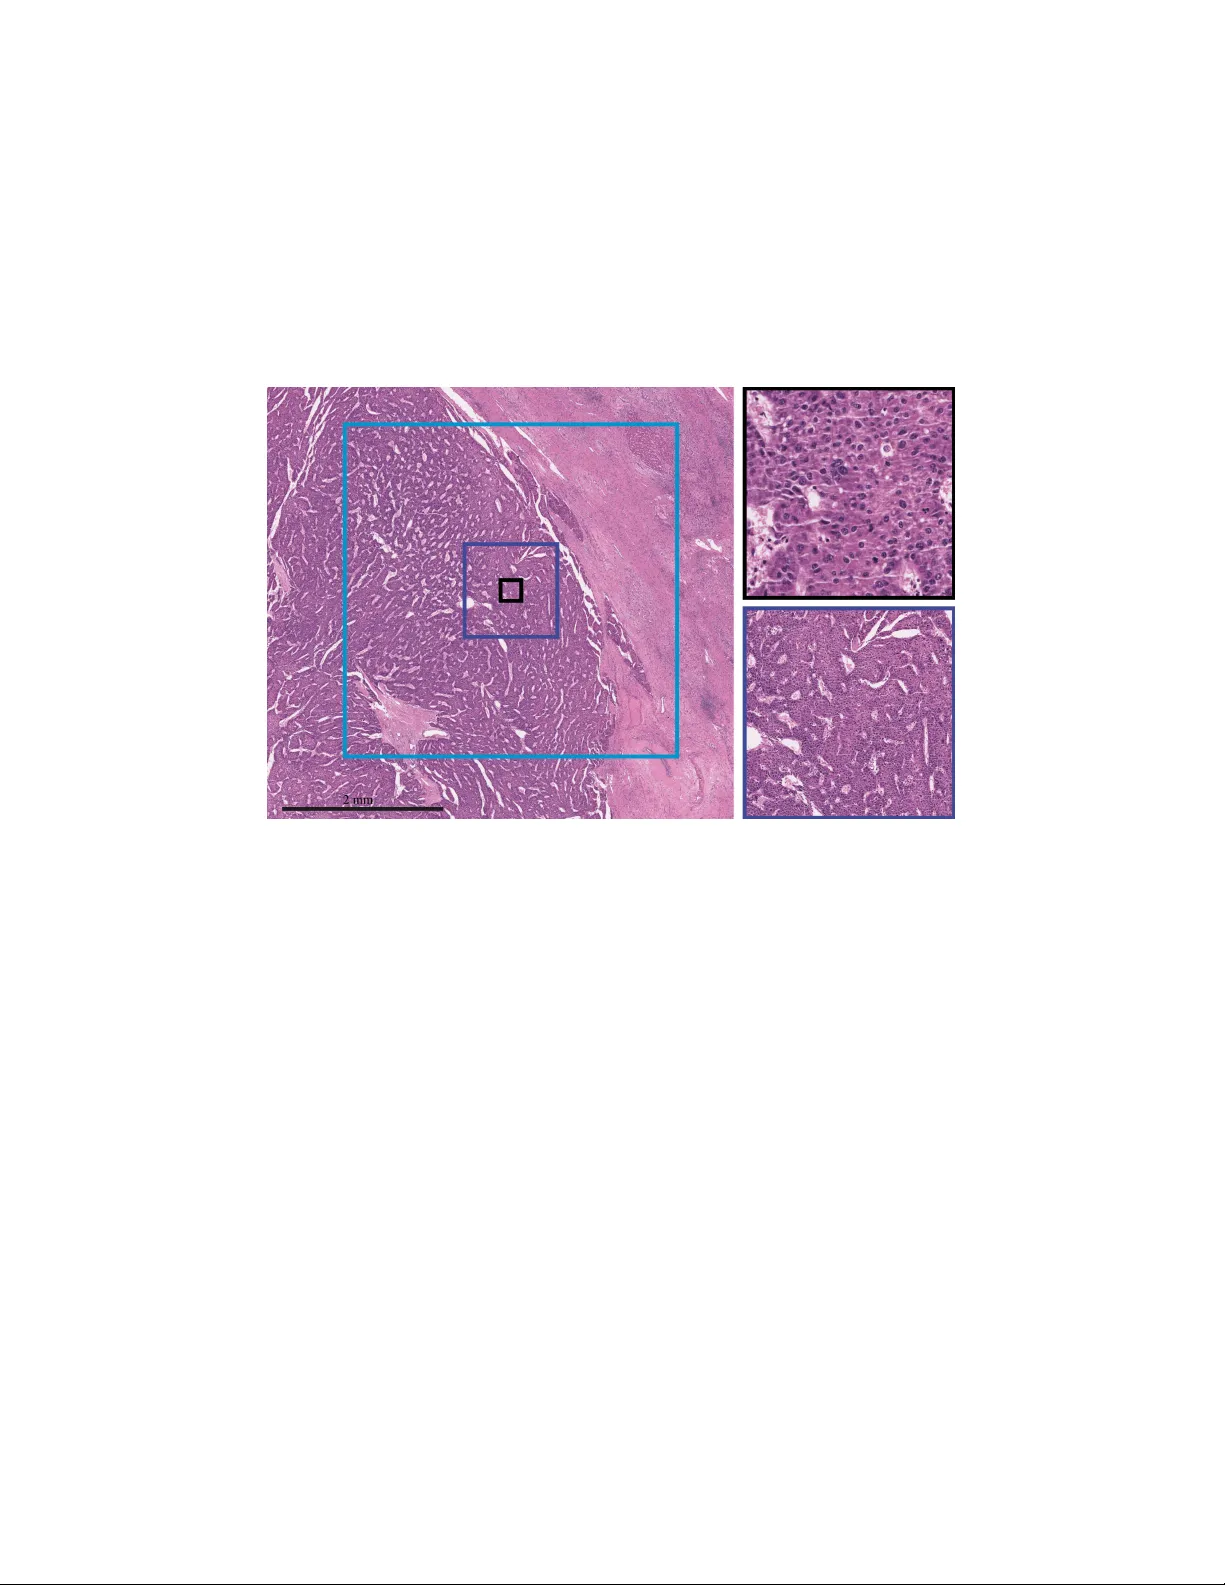
Multi-scale fully con v olutional neural networks for histopathology image segmentation: from nuclear aberrations to the global tissue architecture R ¨ udiger Schmitz a,b,c, ∗ , Frederic Madesta b,c , Maximilian Nielsen b,c , Jenny Krause d , Stefan Steurer e , Ren ´ e W erner b,c, ∗∗ , Thomas R ¨ osch a, ∗∗ a Department for Inter disciplinary Endoscopy , b Center for Biomedical Artificial Intelligence (bAIome), c Department of Computational Neur oscience, d I. Department of Internal Medicine, e Department of P athology , University Medical Center Hambur g-Eppendorf, Hambur g, Germany Abstract Histopathologic diagnosis relies on simultaneous integration of information from a broad range of scales, ranging from nuclear aberrations ( ≈ O (0 . 1 µ m)) through cellular structures ( ≈ O (10 µ m)) to the global tissue architecture ( ' O (1 mm)). T o explicitly mimic how human pathologists combine multi-scale information, we introduce a family of multi-encoder fully-con volutional neural networks with deep fu- sion. W e present a simple block for merging model paths with di ff ering spatial scales in a spatial relationship-preserving fashion, which can readily be included in standard encoder-decoder networks. Additionally , a context classification gate block is proposed as an alternativ e for the incorporation of global context. Our e xperiments were performed on three publicly av ailable whole-slide images of recent challenges (P AIP 2019: hepatocellular carcinoma segmentation; BA CH 2020: breast cancer segmentation; CAMEL YON 2016: metastasis detection in lymph nodes). The multi-scale architectures consistently outperformed the baseline single-scale U- Nets by a large margin. They benefit from local as well as global context and particu- ∗ Corresponding author: r.schmitz@uke.de . ∗∗ Equal contribution. Abbre viations : Arch. – architecture, CI – confidence interv al, Clss. – classification, Ens. – enseble, FCN – fully-conv olutional neural net, HCC – hepatocellular carcinoma, Mem. – GPU memory footprint (in GB per patch), ms – multi-scale, msM – multi-scale merge-block, pms. – parameters, SVM – support vector machine, WSI – whole-slide image. Pr eprint submitted to Elsevier F ebruary 23, 2021 larly a combination of both. If feature maps from di ff erent scales are fused, doing so in a manner preserving spatial relationships was found to be beneficial. Deep guidance by a context classification loss appeared to improve model training at low computa- tional costs. All multi-scale models had a reduced GPU memory footprint compared to ensembles of indi vidual U-Nets trained on di ff erent image scales. Additional path fusions were shown to be possible at low computational cost, opening up possibilities for further , systematic and task-specific architecture optimization. The findings demonstrate the potential of the presented family of human-inspired, end-to-end trainable, multi-scale multi-encoder fully-con volutional neural networks to improv e deep histopathologic diagnosis by extensi ve integration of largely di ff erent spatial scales. K eywor ds: Multi-scale, Computational Pathology, Histopathology, Fully-con volutional neural nets, FCN, Human-inspired computer vision 1. Introduction 1.1. Clinical r elevance and motivation If the rumor is tumor , the issue is tissue. Histopathology is the gold standard and backbone of cancer diagnosis, providing important information for v arious stages of the treatment process (Brierley et al., 2016). For instance, a fine-grained grading and staging of dysplasia and malignancy in precursor and cancer lesions, respectiv ely , un- derlies individualized treatment planning in man y tumor entities. Moreo ver , in curati ve surgery , the assessment of whether the resection specimen margins are free of tumour cells is of vital importance and a core task of clinical pathology . Human pathologists meet these challenges with the help of elaborated diagnostic criteria and grading systems for all kinds of cancer and cancer precursors. Even though their specific details vary for di ff erent kinds of cancer , many rely on a combination of features such as • Nuclear inner density , i.e. color, (Zink et al., 2004) and • Deformed and varying nuclear shapes or global alterations of the nuclei (Zink et al., 2004). 2 • Increased nucleus to stroma ratio and • Loss of nuclear polarity (e.g. nucleus not an ymore at the bottom), as observ ed in many glandular tumours. • Deformed cellular shapes and heterogeneous cell sizes, • Loss of organ- and function-defining positions on small scales (e.g., neighboring cells not in a single layer, but some stacked ov er each other) and larger scales (e.g., atypical or deformed glandular shapes), • In vasion (i.e., disrespecting global tissue order and borders between di ff erent layers). As can be seen from this (not-exhausti ve) list, diagnosis and grading of malignancy inherently in volve a range of di ff erent scales. These scales may span a factor of more than a thousand-fold, ranging from sub-nuclear features (which lie on a spatial scale of ≈ O (0 . 1 µ m)) via nuclear , cellular ( ≈ O (10 µ m)), inter-cellular ( ≈ O (100 µ m)) to glandular and other higher or ganisational features ( ' O (1 mm)). The importance of the integration of information from di ff erent scales is reflected in how human pathologists approach these tasks: Regions of interest are repeatedly viewed at sev eral di ff erent magnifications by turning the objectiv e rev olver of the microscopy back and forth. In this work, we aim to de velop a family of deep learning models that architec- turally mimic this behaviour . 1.2. Related works W ith their success in various computer vision tasks, deep learning methods have opened up a myriad of perspecti ves for computer vision and computer-aided diagnosis (CADx) in histopathology (Litjens et al., 2017). Image segmentation is a standard task in computer vision and machine learning and has a direct clinical use in the field of pathology , be it the analysis of the margin status (i.e., distance of tumor cells to resection margin), area-dependent grading systems (with the Gleason score in prostate cancer as a prominent example (Epstein et al., 2016; Karimi et al., 2020b; Nir et al., 2018)), or specific research applications, such as the analysis of 3d-tumor morphology 3 from a multiplicity of tissue sections (Schmitz et al., 2018; Segovia-Miranda et al., 2019). In medical image segmentation, standard computer vision models, including fully con volutional neural networks (FCNs, Long et al. 2015) and, most prominently , U- Net-based architectures (Ronneberger et al., 2015) ha ve successfully been applied to various scenarios and imaging modalities (Litjens et al., 2017; Isensee et al., 2018), in- cluding computational histopathology (Bulten et al., 2019; Liu et al., 2017; Campanella et al., 2019). In addition, more specialized network architectures (Bejnordi et al., 2017b; Li et al., 2018a; V u and Kwak, 2019) and training techniques (Campanella et al., 2019; W ang et al., 2019) have been proposed to address the challenges of computational histopathology . Some of these works touch upon the question on how additional con- text can be provided to the network, but are mainly confined to local, similar -scale context (Bejnordi et al., 2017b; Li et al., 2018a) and / or sliding-windo w con volutional neural network (CNN) techniques (Bejnordi et al., 2017b; W etteland et al., 2019) or classification tasks. Early on, Nir et al. (2018) described the potential of multi-scale features from more separate scales in classical, ”hand-crafted” feature-driven machine learning. By integrating the features from di ff erent scales by use of a support vector machine (SVM), they paved the way for many works to follow . Recently , the same research group advocated the use of individually trained CNNs as feature extractors whose outputs were, in an ensembling-like fashion, combined by a logistic regression model into a final Gleason grade classification in prostate cancer (Karimi et al., 2020b). Similarly , W etteland et al. (2019) suggested to train distinct CNNs as feature e xtractors and merge their information in a classification network in replacement of the original fully-connected layers, which can again be viewed as an ensembling approach. For application to breast cancer and its di ff erential diagnoses, Ning et al. (2019) proposed a similar ensembling technique, but again based on classical, hand-crafted feature ex- tractors and using an SVM for integration of multi-scale information. In 3d imaging, multi-path end-to-end trainable models have incorporated similar- scale and local context to reduce the memory footprint and alle viate the problem of the otherwise e xtremely limited input size in memory-costly 3d-nets (Kamnitsas et al., 4 2017), with remarkable success in e.g. the sub-acute stroke lesion segmentation chal- lenge ISLES 2015 (Maier et al., 2017). In histopathology , there also have been attempts tow ard end-to-end trainable multi-scale models (Gu et al., 2018; Li et al., 2018a), but which ha ve so f ar sho wn only minor benefits as compared to the aforementioned en- sembling v ariants. This observation indicates that multi-scale deep learning-based se g- mentation of histopathology data is still in its infancy and its actual potential remains to be un veiled. Introduction of additional image context has been a topic of interest also in the natu- ral image domain, resulting in prominent techniques like dilated or atrous con volutions and atrous spatial pyramid pooling (Chen et al., 2017a,b). Further , Zhang et al. (2018) proposed an FCN architecture that e xplicitly predicts ”scaling factors” for the possible classes from the bottle-neck layer , which are then used to multiply and, thus, highlight the respective feature maps at the final layer . The scaling factors can capture the ov erall image content and can be trained by use of an additional classification loss. Similarly , Zhou et al. (2019) introduced a reinforcement-based strategy in volving two sub-nets, one for encoding context and one for the actual segmentation task. By the properties of the natural image domain, namely the limited image size as compared to histopatho- logic whole-slide images (WSIs), the scales of detailed and contextual features in these works are, howe ver , much more similar than in histopathology . Congruously , the pri- mary aim of these approaches has been to ”help clarify local confusion” (Liu et al., 2015) or to make better use of what is fed into to the net anyw ays, rather than to add large and otherwise unav ailable context. For histopathology image segmentation as a specific task, ho wev er , we aim for the integration of otherwise unav ailable information from much di ff erent scales into a single, end-to-end trainable model. 1.3. Contributions There e xist plenty of highly optimized, U-Net-deri ved architectures emplo ying, for instance, elaborate skip connections (Badrinarayanan et al., 2017), dense connections (Li et al., 2018b), attention gating techniques (Oktay et al., 2018) and newer FCN architectures like DeepLab (Chen et al., 2017a). Nev ertheless, standard U-Nets have turned out to be robust work horses for many medical computer vision tasks and are 5 hard to beat by internal modifications of the base architecture (Isensee et al., 2018, 2019). Howe ver , histopathology diagnosis is, by the nature of the large whole-slide images and with closely interwov en features from very di ff erent scales, a very specific and challenging task. Therefore, drawing on the U-Net as a standard base model, this work explores whether an architectural mimicry of ho w human e xperts approach this specific task can improv e the performance of FCNs for histopathology image segmentation. The main contributions of this paper are as follo ws: W e introduce a family of U- Net-based fully con volutional deep neural nets that are specifically designed for the extensi ve integration of largely di ff erent spatial scales. First, we propose a simple building block that can fuse various encoders with di ff erent spatial scales in a manner that preserves relativ e spatial scales. As a light-weight alternativ e, we also propose the use of an independent context classification model for gating the segmentation model output. Second, we integrate these building blocks into di ff erent multi-scale FCNs and compare their segmentation performance to U-Net baseline architectures. T o il- lustrate generalizability , the ev aluation is based on three di ff erent publicly av ailable image datasets provided by recent challenges. Third, by a systematic, stepwise analy- sis, we identify rele vant aspects of the proposed multi-scale FCN f amily , including the necessity of preserving spatial relationships between di ff erent encoders, the benefits from deep guidance by an additional classification loss and possible generalizations through multiple path fusions. Based on these observations, we narro w down the pos- sible multi-scale setups and comment on how to systematically adapt the presented multi-scale FCN family to specific deep learning tasks in histopathology . T o foster reproducibility and further research, our proposed models are publicly provided as open source 1 to the community . 1 https: // github .com / ipmi-icns-uke / multiscale / . Please do not hesitate to contact the corresponding author for help with implementation and usage. 6 2. Model architectur es 2.1. Baseline ar chitectur es 2.1.1. U-Net ar chitectur e Beyond the still popular sliding-window CNN-based techniques, U-Net-based FCN architectures form the de facto standard in the medical image domain (Isensee et al., 2018), including histopathology (Litjens et al., 2017). Beating the standard U-Net by internal modifications is evidently hard (Isensee et al., 2019, 2018) and be yond the scope of this work. Rather, as outlined in the introduction, this study examined whether by designing a model of standard components but with its larger architecture mimicking human expert diagnostic procedures, further impro vement can be made. Therefore, we chose a non-modified ResNet18-based U-Net (He et al., 2015) as a common, standard U-Net variant to form the baseline for this study 2 . For a detailed description of the baseline model, the reader is referred to section S3 in the Supple- mentary Materials. In brief, the ResNet18 forms the encoder of the otherwise standard U-Net architecture (cf. figure S1), where the encoding ResNet18 has been pre-trained on the ImageNet dataset (Russakovsky et al., 2015). For our study , the baseline model was trained at full-resolution patches of 512 × 512 pixels of the WSI images. 2.1.2. Multi-scale ensembles as an upper bound for state-of-the-art performance W e additionally compared our proposed models to ensembling techniques to see if we can reach or ev en excel their performance with a single, and computationally less costly , model. Inspired by the approach of Karimi et al. (2020b) to Gleason grading, individual U-Nets were trained on the di ff erent image scales. The predicted proba- bilities were then re-sampled to the target resolution and merged by use of di ff erent ensembling techniques, namely hard majority votes, av erage ensembles (soft major- ity voting), and logistic regression ensembles. For each ensemble, the best indi vidual model per scale was selected. The logistic regression model was trained and ev alu- ated on the same train and test sets as the individual models. By this procedure, we 2 An implementation of this architecture can be found at https: // github .com / usuyama / pytorch-unet. Ac- cessed: 2019-09-19. 7 aimed to define a thorough and systematic upper bound for state-of-the-art multi-scale ensembling performance. 2.2. The msY model family: Multi-scale multi-encoder ar chitectur es T o provide the network with conte xt and architectural information (cf. figure 1 and the considerations in section 1), we constructed a family of multi-scale multi-encoder networks b uilding upon the baseline Res-U-Net architecture. In the following, we first introduce the underlying blocks for integration of multi- scale context, namely the multi-scale mer ge block and the context classification gate . Afterwards, we describe the di ff erent variants of our setup that are examined in this study . T echnically , it is worth noting that common whole-slide image (WSI) formats use so-called pyramid representations, which contain the original image in multiple, do wn- sampled versions. Therefore, multiple scales can directly be loaded from file, with no need for resampling and, hence, only a moderate ov erhead only . 2.2.1. Multi-scale mer ge block: spatial r elationship pr eserving path fusion in multi- scale multi-encoder models Figure 2a sketches the functioning of the multi-scale merge block. At the bottleneck lev el, the feature maps from both the main encoder and the side (context) encoder have sizes of 16 × 16 × 512. In order to spatially match the output of the full resolution encoder , a n 0 × n 0 center cropping ( S 16 n 0 × 16 n 0 ) of the n -times down-scaled context path is performed, followed by n × n bilinear upsampling ( U n × n ), where n 0 = 4 if n = 4 and n 0 = 8 if n = 16. For the case n 0 , n , another center cropping with 16 × 16 is conducted. Both, now spatially consistent paths are then merged by concatenation. Finally , the number of feature maps is reduced to the original number by a 1 × 1 con volution. This operation is meant to learn which of the feature maps from the two paths are relev ant and how the y need to be combined. For application to multiple context encoders, spatial alignment is ensured for an y individual context encoder in the same manner as described abo ve. The spatially- aligned feature maps from all encoders are then concatenated. Afterwards, the feature 8 map size is reduced by a 1 × 1 con volution with 512 · ( m + 1) input feature maps and 512 output feature maps, c 512 · ( m + 1) , 512 1 × 1 , where m denotes the number of side encoders. 2.2.2. Context classification gate Alternativ ely to the use of multiple encoders that are merged by multi-scale merge blocks, we examined the potential of gating the class-wise predictions from the seg- mentation network by a context classifier . The context classifier tries to predict the content of the central detail patch from the low-resolution global context patch alone (cf. figure 1). As multiple, ev en mutually exclusi ve classes can be included in the detail patch, this states a multi-label classification problem. The context classification gate is depicted in figure 2b. The classification net out- puts a probability value for each indi vidual class (illustrated by the colored boxes in the bottom left corner). These are multiplied to the probability maps of the segmentation network in a channel-wise manner (similar to how excitations in squeeze-and-excite blocks are handled, cf. (He et al., 2015)), thereby emphasizing probable classes and suppressing unlikely diagnoses. T o allow the segmentation network to either use or ig- nore this guidance, a ”leak” is constructed by concatenation of the original, un-excited feature maps to the excited ones, followed by a 1 × 1 con volution that is to learn how to combine the excited and the leaked feature maps. 2.2.3. msY -Net: Inte grating context and tissue ar chitectur e The msY -Net is provided with two patches of the scales 1 and 4 (which correspond to the inner tw o rectangles in figure 1) or 1 and 16 (inner and outer rectangle) as input. The full-resolution patch (scale 1) is fed into the standard U-Net architecture. The other is passed through a separate but analogous encoder architecture (”context encoder”) built from another ResNet18. As the skip connections in the U-Net are for helping the decoder re-localise the high-le vel features and only the full-resolution patch is the one that needs to be segmented, the context encoder does not have an y skip connections to the decoder . The two paths are merged at the bottleneck of the original U-Net by use of the multi-scale merge block (cf. section 2.2.1). The resulting architecture is sketched in 9 figure 3b. In the following, we refer to a msY -Net that uses detail patches of the scale 1 and context patches of the scale n as msY ( n ) -Net. 2.2.4. msYI-Net and msY 2 -Net: Inte gration of global and local conte xt In order to provide the model with large- and small-scale context information at the same time, we constructed two models that either use two context encoders or one context encoder plus one context classification gate. For the former variant, we added two conte xt encoders using a single multi-scale mer ge block. W e refer to this model as msY 2 -Net. For the latter variant, a context classification gate that uses the large-conte xt patch was added to an underlying msY -Net. This model is outlined in figure 3e. The I in the name msY I -Net refers to the lar ge-context classification sub-net paralleling the un- derlying msY -Net without any fusion at the bottleneck or before. This network has two outputs: the se gmentation of the full-resolution patch from its msY -Net part and the classification of the full-resolution patch content from the large-conte xt encoder, its I -part. Finally , the final logits of the two paths are combined by a context classifica- tion gate that modifies the segmentation output by the classification of its conte xt (cf. section 2.2.2). In the msY -Net and the msY 2 -Net architectures, spatial correspondence between the full resolution encoder and the context encoder(s) is enforced in the multi-scale merge block (cf. figure 2). It should be noted that for the large-conte xt encoder in the msY I -Net that ends in a classification gate instead of a multi-scale merge block, there is no such requirement. Therefore, this model can, in principle, be fed with lar ge-context patches of arbitrary scales. 2.2.5. Context classification loss Additional loss functions can improv e the training of specific parts of U-Net-based architectures and are used in various manners (Kickingereder et al., 2019; Li and Tso, 2019), including a classification loss on an additional output deri ved from the bottle- neck feature maps (Mehta et al., 2018). 10 Analogously , we computed a classification output from the feature maps of global context encoders (i.e., those with input scale 16) and used it to compute an additional classification loss. The classification loss is computed with respect to the content of the detail patch. As described in section 4, we used a binary cross entropy (BCE) loss for the classification problem and added it to the segmentation loss. By the additional classification loss, we wanted to ease gradient flo w through the deeper layers of the context encoder and to explicitly force it to focus on the content of the detail patch. 2.2.6. Early and multiple fusions by multi-scale mer ge blocks Positioning the multi-scale merge block at the bottleneck le vel is not obligatory . T echnically , a multi-scale merge block can merge any two encoders at any lev el at which the one shall influence the other (the connection is directed, not mutual). Also, usage of multiple multi-scale merge blocks is possible. V ery early merge blocks will, howe ver , not provide much context due to the small receptiv e fields of the center crop. On the other hand, earlier and in particular mul- tiple fusions may allo w for an additional processing of combined features and might facilitate modelling of complex combined features. It should be noted that these multiple merges are computationally inexpensi ve, as they only introduce additional learnable parameters through the 1 × 1 con volutions inside the merge blocks. All models are implemented using PyT orch v1.2.0 (Paszke et al., 2017). 3. Materials & methods 3.1. Datasets T o examine generalizability of our findings, e xperiments were conducted on three di ff erent datasets for di ff erent entities of cancer , collected by di ff erent centers and scanned by di ff erent scanners. T o ensure reproduciblity , we employed the following three publicly av ailable challenge datasets: 11 Figure 1: Input patches at di ff erent spatial scales, shown in an illustrativ e region of the same whole-slide image as depicted in figure 4. The innermost, black rectangle corresponds to a 512 × 512 pixel patch of the scale 1, which we refer to as the “detail patch” (zoomed view in the top right inset). The next, dark blue rectangle corresponds to a 572 × 572 pixel patch of the scale 4. It contains information on how the cells are organised in strands and ”trabeculae” – or whether the cells violate these patterns. These features are hard or impossible to deduce using the innermost patch alone. In this sense, the dark blue patch adds ”architectural” information. W e refer to it as ”local context” or the ”local context patch”. A zoomed view of it is shown in the bottom right inset. The outermost, light blue rectangle, which we call a ”global context patch”, contains information on the large-scale organization of the tissue, such as the pseudocapsule, which is typical for hepatocellular carcinoma. Whilst a standard U-Net is provided with the information from the detail patch solely , a msY -Net architecture (section 2.2.3) can integrate information from the detail patch plus either the local or the global context patch. The msY 2 - and msY I -Net architectures are two options for integration of all three scales. The scale bar is 2 mm. (a) Multi-scale merge block (b) Context classification gate block Figure 2: Schematic illustration of the multi-scale merge block (a) and the context classification gate block (b). E , D are the encoder and decoder path of the network (cf. figure 3b), respectiv ely . The blue upward boxes are the feature maps with their respecti ve sizes printed inside. ⊕ denotes concatenation and ⊗ channel- wise multiplication. The ”leak” connection is a copy , followed by concatenation. S x × y stands for the central cropping of the size x × y in the spatial dimensions and U a × b the bilinear upsampling by factors of a and b in the dimensions 1 and 2. w and h denote the spatial width and height, n the number of classes. C a , b n 1 , n 2 means n 1 × n 2 con volution with a input feature maps and b output features maps (where a may be omitted if the size of its input is explicitly gi ven), follo wed by ReLU activation. 13 (a) U-Net (baseline) (b) msY -Net (c) msY 2 -Net (d) msU I -Net (e) msY I -Net Figure 3: Schematic illustration of the main architectures studied in this paper . All main and side encoders use an ImageNet-pretrained ResNet-18. The skip connections and the decoder are the same throughout all of our mod- els (see section S1 for details). The multi-scale merge (msM) and context classification gate (ccG) blocks are described in sections 2.2.1 and 2.2.2 and sketched in fig- ure 2. Ad A vg Pool denotes adaptive average pooling, FC a fully-connected layer and Act the activ ation function. 14 3.1.1. P AIP 2019 The P AIP (Pathology Artificial Intelligence Platform) 2019 challenge (part of the MICCAI 2019 Grand Challenge for Pathology) dataset comprises 50 de-identified whole-slide histopathology images from 50 patients that underwent resection for hep- atocellular carcinoma (HCC) in three Korean hospitals (SNUH, SNUBH, SMG-SNU BMC) from 2005 to June 2018 (Kim et al., 2021). The slides have been stained by hematoxylin and eosin and digitalized using an Aperio A T2 whole-slide scanner at × 20 power and 0 . 5021 µ m / px resolution, resulting in image sizes between 35 , 855 × 39 , 407 and 64 , 768 × 47 , 009 pixels (1.399 to 3.044 gigapix els). Regions of viable cancer cells as well as whole cancer re gions (additionally includ- ing stroma cells and so forth) have been annotated manually . As described in (Kim et al., 2021), one pathologist with 11 years of experience in li ver histopathology dre w the initial annotations that were then re viewed by another e xpert pathologist. All cases of the giv en dataset include cancer regions. W ith respect to the Edmonson-Steiner grading system (Edmondson and Steiner, 1954), their distribution is as follo ws: N = 7 cases of grade 1, N = 23 grade 2 tumors, and N = 20 grade 3 samples. All de-identified pathology images and annotations were prepared and pro vided by the Seoul National Univ ersity Hospital under a grant from the Korea Health T echnol- ogy R&D Project through the K orea Health Industry De velopment Institute (KHIDI), funded by the Ministry of Health & W elfare, Republic of K orea (grant HI18C0316). Figure 4 (A) shows an e xemplary whole-slide image from the dataset. It illustrates why hepatocellular carcinoma (HCC) is a prominent example of a cancer that is char- acterized not only by nuclear abberations, but also by local tissue abnormalities and large-scale features such as a so-called pseudocapsule (as illustrated in the figure). In fact, (lo w-grade) HCC is challenging to diagnose, as it is often identifiable only by ab- berations of the long-range tissue architecture with only minor nuclear abnormalities, if any (Bosman et al., 2010). This makes the dataset well-suited for demonstration of the importance of multi- and particularly large-scale conte xt features. 15 3.1.2. B A CH 2018 The B A CH (BreAst Cancer Histology) 2018 challenge (Aresta et al., 2019) in- cluded the classification of small (2 . 048 × 1 . 536) image patches as one task, and the segmentation of WSIs of breast biopsies as another . For the latter task, 10 pix el-wise annotated WSIs were pro vided for training. T wo medical e xperts performed the image segmentation using the following four labels: (1) normal, (2) benign, (3) in situ and (4) in vasi ve breast carcinoma. WSIs were acquired by a Leica SCN400 ( × 20 power , pixel scale: 0 . 467 µ m / px) in the period from 2013 to 2015 at the Centro Hospitalar Cova da Beira. The image sizes range from 50 , 529 × 36 , 833 to 64 , 703 × 45 , 808 pixels (1.861 to 2.964 gigapixels). Di ff erential diagnosis in suspected breast cancer is kno wn as a challenging task to human pathologists, and also to machine learning approaches. This is reflected in the results of the top-performing teams, reaching only moderate scores of 0 . 50 to 0 . 69 with respect to the custom challenge metric (Aresta et al., 2019). Figure 4 (B) illustrates how close the di ff erent diagnoses can be interwoven, with in vasi ve and in situ parts of the carcinoma directly neighboring each other . 3.1.3. CAMELY ON 2016 / MM subset For the original CAMEL Y ON (Cancer Metastases in L ymph Nodes) 2016 chal- lenge (Bejnordi et al., 2017a), 399 WSIs of lymph nodes from women with con- firmed breast cancer were gathered from two di ff erent centers (Radboud UMC and UMC Utrecht) during the first half of 2015. 240 of the 399 slides contained one or more nodal metastases. The images were scanned by a Pannoramic 250 Flash II ( × 20, pixel scale: 0 . 243 µ m / px) and a NanoZoomer-XR Digital slide scanner C12000-01 ( × 40, pixel scale: 0 . 226 µ m / px), respectively . Image sizes are 61 , 440 × 53 , 760 to 217 , 088 × 103 , 936 pixels (3.303 to 22.563 gigapix els). Initial annotations of lymph node metastases were drawn by medical students and then revie wed and corrected by two expert pathologists, as detailed in (Bejnordi et al., 2017a). This procedure fits the clinical observ ation that the detection of lymph node metastasis is a much easier task to human pathologists than diagnosis of HCC and pathologies of the breast. The original dataset contains macrometastases (tumor cell 16 clusters with a diameter ≥ 2 mm), micrometastases (0 . 2 mm ≤ diameter < 2 mm) as well as yet smaller clusters do wn to isolated tumor cells. Whilst these are all clinically relev ant, isolated tumor cells and v ery small clusters do not infer with the global lymph node architecture (Lakhani et al., 2012). For our experiments, we therefore created a subset of the CAMEL Y ON 2016 dataset, consisting of 20 WSIs with at least one macrometastasis. W e refer to this subset as CAMEL YON 2016 / MM, with MM for macrometastasis. The procedure for the estab- lishment of the CAMEL Y ON 16 / MM subset is detailed in section S2. Figure 4 (C) provides a typical example of the CAMEL Y ON 2016 / MM dataset. As illustrated in figure 4 (C), this dataset still contains isolated tumor cells (triangle) and micrometas- tases along with the macrometastases (arrows), b ut with a higher weight put to the macrometastases and the larger length scales as compared to the original CAMEL Y ON 2016 dataset. Howe ver , it should be noted that this task still di ff ers from the other two, namely diagnosis of HCC and pathologies of the breast. Whilst macrometastases infer with the global architecture of the lymph node, the y can still be diagnosed at the single- or few-cell le vel, by virtue of the di ff erences of individual tumor and autochthonous cells. Therefore, ev en though larger scales certainly help the human pathologist with the diagnosis of macrometastases, the consideration of larger scales and the inte gration of multi-scale information is of lesser importance. 3.2. Pr eprocessing WSI data preprocessing was similarly performed for all three datasets. Compared to the annotations originally provided for the respectiv e challenges, we automatically generated annotations for an ”ov erall tissue” as an additional class. This was achie ved by thresholding of the original images with [R, G, B] ≤ [235, 210, 235], followed by binary morphological opening and closing operations. The rationale for introducing the additional class was threefold: First, it makes the ”background” class, that would other- wise include not only all-white background but also healthy tissue, much less heteroge- neous. Second, it facilitates sampling of healthy tissue patches as meaningful negativ e examples (cf. section 4). Third, the automatically generated ”ov erall tissue” annota- tions let us generalize the Reinhard color normalization (Reinhard et al., 2001) to our 17 application. Reinhard color normalization, as originally introduced, implicitly assumes the color statistics to be computed from meaningful image areas. In contrast, when di- rectly applied to a WSI image, the fraction of all-white background would determine the color statistics and hence a color normalization, which is undesired. T o av oid this, images were standardized by Reinhard colour normalization (Reinhard et al., 2001) with respect to the ”ov erall tissue” regions only , and then normalized to channel-wise zero av erage and unit variance, again in the tissue regions only . 3.3. Evaluation metrics The primary outcome parameter for all experiments was the Jaccard index with the classes weighted as detailed in section 4. Secondary , for experiments on the B ACH challenge data, we additionally report the custom metric used in that specific challenge (Aresta et al., 2019). Simply put, the metric is based on a pix el-wise accuracy measure that penalizes predictions that are farther from the giv en ground truth segmentation class. This is possible since the segmentation classes can be ordered according to their malignancy . W e refer to that metric as the “BA CH metric”. For each dataset, we employed a 5-fold cross v alidation (CV) strategy with the split conducted at the lev el of the entire WSIs. Splitting is performed such that all classes were present in the validation set. The splits were computed once and then kept fixed throughout all e xperiments. The number of WSIs in the validation set was 10 for P AIP 2019, 2 for B ACH 2018 and 4 for CAMEL YON 2016 / MM. V alidation was performed after the following epochs (number of iterations): 1 (1 , 920), 3 (5 , 760), 5 (9 , 600), 8 (15 , 360), 11 (21 , 120), 16 (30 , 720), 21 (40 , 320), and then ev ery 10 epochs (19 , 200 iterations). At each v alidation step, a fixed number of 3 , 072 × 3 , 072 pixel-sized sub- images per image was e v aluated. W e ev aluated four such sub-images per validation WSI for P AIP , ten for BA CH and six for CAMEL YON 2016 / MM, resulting in 40, 40 and 24 of these per spilt for P AIP , B ACH and CAMEL YON 2016 / MM, respectiv ely . The positions of the sub-images were randomly sampled with the condition that, for any WSI, all av ailable classes shall be represented in at least N I / N c of the sub-images. Here, N I denotes the number of v alidation sub-images from that WSI and N c is the number of a v ailable classes. Sampling of the sub-image positions was done once, 18 before the first experiment, and then kept fixed throughout all experiments. This means that all models for a giv en split are e valuated with respect to the exact same sub-images at all validation steps. 3.4. Statistical analysis For a given model, performance scores were ev aluated per split, from which the mean and 95%-confidence interval (CI) across the fiv e splits were computed. T o set a robust baseline for the experiments in section 5.1, the experiments for the baseline, single-scale U-Net were repeated three times and a veraged, corresponding to a conser- vati ve estimate (over clustered experiments). The results for the individual runs of the baseline U-Net are provided in the section S3. As detailed in section S4, we applied a corrected t-test for use in cross-v alidation settings (Nadeau and Bengio, 2000; Bouckaert and Frank, 2004) to test for statistical significance of the di ff erences between the multi-scale models and the baseline U-Net. As further described in the same section, our study is underpo wered for e xamining dif- ferences between di ff erent multi-scale models for significance. Therefore, we restricted the tests to comparisons between multi-scale architectures and the baseline U-Net. All statistical analyses were performed using R v4.0.0 (R Core T eam, 2013). 4. Experiments Our experiments were designed as follo ws: First, we explored the behaviour of the msY -family on the P AIP 2019 dataset. Second, to examine generalizability of our find- ings, we e valuated the performance of the best perform ing architectures on the BA CH 2018 and the CAMEL YON 2016 / MM dataset. Third, to aetiologically understand the behaviour of the msY -models and to narrow down the possible design variants, we conducted further experiments with selected variants of that models on the P AIP 2019 dataset. The training strategy and all hyperparameters were manually optimized for train- ing of the baseline Res18-Unet on P AIP 2019 before the experiments and then kept fixed for all models and throughout all experiments. W e aimed to reproduce a stan- dard and widely used setup as much as possible, including the use of a common model 19 as the baseline. For the same reason, we chose the binary cross entropy (BCE) loss as a common and widely used loss function (see, e.g., Heller et al. 2019). BCE was used as a loss function for both classification (if the model has an additional classifi- cation output, cf. section 2.2.2) and segmentation. The training process was split into (short pseudo-)epochs of 1 , 920 patches each, with all patches re-sampled after each individual ”epoch”. Compared to the use of a fixed number of pre-selected patches, this reduces overfitting giv en the limited memory resources and the large whole-slide images. F or each pseudo-epoch, the patches were balanced with respect to both the in- dividual cases in the training set and the av ailable classes. Optimization was performed using Adam (Kingma and Ba, 2014) employing a learning rate of 10 − 3 and a learning rate decay with γ = 0 . 5 every 30 epochs (57,600 iterations). During training, we em- ployed online data augmentation including the following standard operations: rotation, flip along the horizontal axis, saturation and brightness transformation. 4.1. Comparison of msY -family and baseline models 4.1.1. P AIP 2019 The clinical scenario in our P AIP 2019 experiments is the segmentation of hepato- cellular carcinoma for ev aluation of tumor extent and margin status after the resection of hepatocellular carcinoma. The comparison of all multi-scale models (including the msY -family and the multi- scale ensembling variants) to the baseline U-Net resulted in a total of N = 9 pairwise model comparisons. The e valuation of the corresponding results were the primary focus of the P AIP 2019 experiments. In addition, we also compared the di ff erent multi- scale architectures amongst each other and to multi-scale ensembles. Howe ver , as our study is underpo wered for finding statistically significant results in between di ff erent multi-scale models (cf. section S4), we only descriptiv ely present the corresponding results. For the P AIP 2019 experiments, all models were trained for at least 120 pseudo- epochs (230 , 400 iterations) or until con ver gence of the v alidation loss was reached. According to the clinical scenario and due to the fact that the localisation of viable tumor cells with respect to the resection margins determines the resection status, we 20 put additional weight to the viable tumor class as compared to the whole tumor class and weight the loss by [0, 1, 2, 6] for background, ov erall tissue, whole tumour and viable tumor classes, respectiv ely . Segmentation performance as the primary outcome parameter was measured by the weighted a verage Jaccard index in the classes of interest, i.e., “whole tumor” and “viable tumor”, where the weights are the same as abov e. As a secondary outcome, we furthermore examined the resource requirements of the models. W e report the number of trainable parameters and measured the GPU memory footprint. For the latter , we observed the GPU memory usage of the train- ing process, including forward and backward pass, at di ff erent batch sizes using the NVIDIA System Management Interface. The memory footprint of the model without system ov erhead was then deduced by linear regression and reported as gigabytes per patch in batch. The detailed measurements are reported in section S5. For multi-scale models, the term “patch” is meant as a multi-scale patch, i.e., including the image patches for all individual scales. The input patch sizes in all models and for all scales are 512 × 512 pixels, except at scale 4 (576 × 576 for the U-Net in the ensembles, 572 × 572 for the msY -family models). 4.1.2. B A CH 2018 As described in section 3.1.2, the BA CH 2018 dataset allows us to ev aluate the models with respect to their capability in the di ff erential diagnoses of breast lesions, which represents the clinical scenario for this experiment. W e started from the models from the P AIP 2019 experiments and, after replace- ment of the output layers, fine-tuned them on the BA CH 2018 dataset. W ithout loss of generality , we fine-tuned the models from the split i ( i ∈ [0 , 1 , 2 , 3 , 4]) of the P AIP dataset on the split with the same index i ( i ∈ [0 , 1 , 2 , 3 , 4]) of the BA CH 2018 dataset. T raining was performed e xactly as described in section 4.1.1, with the following di ff er- ences: First, for the first 10 pseudo-epochs (19 , 200 iterations), only the output layers were trained and the other weights were k ept fixed. Fine-tuning of all weights was then continued for another 70 pseudo-epochs (134 , 400 iterations). Second, in line with the clinical scenario of breast lesion di ff erential diagnosis, we put equal weights to all 21 classes of interest, i.e., “normal”, “benign”, “in situ” and “in vasi ve carcinoma”, both for the computation of the loss function and the weighted-average Jaccard inde x. In or - der to examine whether our models are on par with state-of-the-art results on this task, we additionally e valuated the scores from the custom B A CH 2018 metric as introduced in (Aresta et al., 2019). 4.1.3. CAMELY ON 2016 / MM For our CAMEL YON 2016 / MM experiments, we again started using the models from the P AIP 2019 experiments and, after replacement of the output layers, fine- tuned them on the new dataset. Training was again performed as described in section 4.1.1 except that for the 10 pseudo-epochs (19 , 200 iterations) only the output lay- ers were trained and the other weights were kept fixed. For CAMEL YON 2016 / MM dataset, we fine-tuned for at least 60 pseudo-epochs (115 , 200 iterations) or until con- ver gence. Again, without loss of generality , we fine-tuned the models from the split i ( i ∈ [0 , 1 , 2 , 3 , 4]) of the P AIP 2019 dataset on the split with the same index i ( i ∈ [0 , 1 , 2 , 3 , 4]) of the CAMEL Y ON 2016 / MM dataset. 4.2. Context classification loss W e hypothesized that when using a global-scale encoder , introduction of an addi- tional context classification loss as a means of ”guidance” may benefit the model (cf. section 2.2.5). In order to examine whether this is consistently the case, we trained the follo wing models with and without context classification loss on the P AIP 2019 dataset: msY (16) , msY 2 , msY (16) , MM . 4.3. Spatial alignment in multi-scale mer ge blocks W e hypothesized that spatial matching is an essential step in the multi-scale merge block. T o test this hypothesis, we compared a msY 2 -Net, as an example where three di ff erent scales are merged, to a variant of the same model but with the multi-scale merge block replaced by a pure concatenation follo wed by a 1 × 1 con volution. This corresponds to a multi-scale merge block but without alignment of the spatial scales and without preserving spatial relationships. The rest of the spatially non-aligned msY 2 - Net variant remained unchanged. 22 If, in line with the hypothesis, the spatially non-aligned msY 2 -Net performs worse than its standard variant with the correct multi-scale mer ge block, it remains to be examined whether this is ”only” due to the clumsy initialization and can potentially be ov ercome without spatial merging. One might hypothesize that the deficit is not architecturally , but due to the introduction of new , untrained con volutions in the middle of the otherwise pretrained encoder . Therefore, we examined two di ff erent variants of the non-aligned model: one v ariant with randomly initialized weights and another variant where the 1 × 1 con volution w as initialized with the unit matrix at the channels belonging to the main encoder and with 0’ s everywhere else, both superimposed with random noise (normal distribution with standard deviation 10 − 4 ). In the latter variant, the main encoder corresponded to the unperturbed, pretrained model at the beginning of the training process, up to noise. 4.4. Multiple mer ging The multi-scale merge block as presented in section 2a can be introduced at any lev el of the encoders. Therefore, it also allo ws for earlier or multiple fusions, which may allow for the additional processing of combined features. V ery early merge blocks, howe ver , do not provide much additional context, due to the cropping step inside the multi-scale merge block. Therefore, it is not a priori clear , at which lev el the merge connection shall be established or if multiple path merges can further benefit the model. In order to study whether models with multiple mer ges can be trained robustly and whether an e ff ect through multiple merges can be found, we compared the segmen- tation performance of a msY (16) -, a msY 2 - and a msY I -Net to the analogues of them with multi-scale merge blocks at all encoder le vels. In this e xperiment, to examine a ”maximum” msY -family variant trainable on our hardware, we used ResNet34 instead of a ResNet18 for the global context encoder of the msY 2 -model. All other models and encoders were ResNet 18-based, as by our standard. Additionally , we e xamined to which extent the introduction of multiple mer ges increases the GPU memory footprint of the models. 23 5. Results 5.1. Multi-scale multi-encoder models impr ove histopathology imag e se gmentation T able 1 reports the weighted a verage Jaccard inde x for the two non-tri vial classes of the P AIP 2019 dataset, viable tumor and whole tumor (including stroma etc.). Ac- cording to the clinical scenario of ev aluating tumor extent and resection margin status in hepatocelullar carcinoma, 3x more weight is put onto the viable tumor class than on the whole tumor class (cf. section 4.1.1 for details). The first experiment shows a number of aspects: First and most importantly , there is a considerable improvement ov er the baseline U-Net by adding multi-scale input, either through ensembling or by multiple encoders as in the msY -family . The e ff ect is found to be statistically significant in our e xperiments, even when tested only for fi ve CV folds and ev en with a conservati ve correction for both the multiplicity of the pair- wise comparisons and the violation of the independent samples-assumption underlying standard t-statistics. The proposed multi-scale multi-encoder models reach the same segmentation per- formance as our best multi-scale ensemble, b ut as individual end-to-end trainable mod- els and with much lower resource requirements. T aking m sY 2 -Net as an example, it has only 76 . 3% of the parameters of a the corresponding ensemble of three U-Nets and comes with a GPU footprint reduced by 54 . 5% (if trained in parallel). Concerning the pairwise comparisons between di ff erent msY family architectures, our data suggest that, for the P AIP 2019 dataset, the global context patch provides more valuable infor- mation than the local context patch. Ho wever , the combination of both local and global context appears to lead to a further impro vement, as the msY 2 - and the msY I -Net mod- els are consistently found amongst the top performing approaches, b ut this e ff ect seems marginal and cannot be reliably detected through this study . W e next examined whether the superior performance of the multi-scale architec- tures translates to other datasets, tumor entities and tasks. For the task of breast lesion segmentation and di ff erential diagnosis, the class-wise mean Jaccard indices are re- ported in table 2. The results are in line with our findings on the P AIP 2019 dataset. Notably , the Jaccard indices on the BA CH 2018 dataset are globally lo wer than on the 24 T able 1: Di ff erent models from the proposed multi-scale multi-encoder family and multi-scale ensembles versus the baseline U-Net. The figures in the table depict the class-weighted Jaccard index for whole and viable tumor classes on the P AIP 2019 dataset. A ? denotes statistical significance at the level of 0 . 05 when compared to the scale 1-U-Net. For a quick overvie w , the best results per split and overall are marked in bold, ignoring di ff erences < 0 . 005. Arch. Scales # pms. † Mem. ‡ W eighted Jaccard Per CV f old Mean (95% CI) U-Net 1 17.804 1.066 0.814 0.754 0.686 0.735 0.729 0.744 (0.707, 0.780) A vg. Ens. 1, 4, 16 53.412 § 3.506 § 0.890 0.853 0.836 0.900 0.835 0.863 (0.839, 0.887) ? Log. Ens. 1, 4, 16 53.412 § 3.506 § 0.859 0.814 0.802 0.915 0.818 0.842 (0.805, 0.878) ? Maj. Ens. 1, 4, 16 53.412 § 3.506 § 0.883 0.838 0.770 0.875 0.816 0.836 (0.800, 0.873) ? msY -Net 1, 4 29.282 1.422 0.902 0.800 0.712 0.796 0.794 0.801 (0.748, 0.854) ? 1, 16 29.284 1.175 0.861 0.872 0.789 0.873 0.889 0.857 (0.826, 0.887) ? msU I -Net 1, 4 28.983 1.389 0.833 0.811 0.779 0.858 0.898 0.836 (0.800, 0.871) ? 1, 16 28.983 1.355 0.864 0.841 0.785 0.896 0.889 0.855 (0.820, 0.890) ? msY I -Net 1, 4, 16 40.460 1.398 0.847 0.871 0.804 0.895 0.910 0.865 (0.833, 0.898) ? msY 2 -Net 1, 4, 16 40.761 1.561 0.847 0.873 0.795 0.934 0.876 0.865 (0.825, 0.905) ? § sum of three individual U-Nets (scales: 1, 4, 16) † in units of one million parameters ‡ GPU memory footprint giv en in gigabytes per image patch in batch 25 T able 2: The best performing multi-scale architectures versus the baseline U-Net on the B ACH 2018 dataset. The figures in the table depict the class-av erage of the Jaccard index for normal tissue, benign lesions and in situ and inv asiv e carcinoma. A ? denotes statistical significance at the level of 0 . 05 when compared to the scale 1-U-Net. The best results per split and overall are mark ed in bold, ignoring di ff erences < 0 . 005. Arch. Scales # pms. † Mem. ‡ W eighted Jaccard Per CV f old Mean (95% CI) U-Net 1 17.804 1.066 0.523 0.476 0.478 0.510 0.501 0.498 (0.482, 0.514) A vg. Ens. 1, 4, 16 53.412 § 3.506 § 0.593 0.540 0.518 0.581 0.622 0.571 (0.538, 0.603) ? msY I -Net 1, 4, 16 40.460 1.398 0.629 0.569 0.488 0.633 0.553 0.574 (0.527, 0.621) ? msY 2 -Net 1, 4, 16 40.761 1.561 0.578 0.594 0.536 0.662 0.524 0.579 (0.536, 0.622) ? § sum of three individual U-Nets (scales: 1, 4, 16) † in units of one million parameters ‡ GPU memory footprint giv en in gigabytes per image patch in batch T able 3: The best performing multi-scale architectures versus the baseline U-Net on the CAMEL YON 2016 / MM dataset. A ( ? ) denotes statistical significance at the level of 0 . 05 when individually compared to the scale 1-U-Net (not correcting for multiple testing). For the comparisons of other models to the base- line U-Net, the null hypothesis cannot be rejected at 0 . 05. The best results per split and overall are marked in bold, ignoring di ff erences < 0 . 005. Arch. Scales # pms. † Mem. ‡ Jaccard (lymph node metastases) Per CV f old Mean (95% CI) U-Net 1 17.804 1.066 0.696 0.770 0.805 0.903 0.803 0.796 (0.737, 0.854) A vg. Ens. 1, 4, 16 53.412 § 3.506 § 0.748 0.944 0.798 0.923 0.883 0.859 (0.794, 0.924) msY I -Net 1, 4, 16 40.460 1.398 0.710 0.756 0.822 0.874 0.859 0.804 (0.750, 0.859) msY 2 -Net 1, 4, 16 40.761 1.561 0.775 0.804 0.865 0.918 0.889 0.850 (0.804, 0.897) ( ? ) § sum of three individual U-Nets (scales: 1, 4, 16) † in units of one million parameters ‡ GPU memory footprint giv en in gigabytes per image patch in batch 26 P AIP 2019 dataset for all architectures. This observation fits the considerations in sec- tion 3.1.2 that this is a particularly challenging task, also for the human pathologist. In addition, table S3 reports the performances of the same architectures as ev aluated by the custom Bach metric used in the original challenge (cf. (Aresta et al., 2019) for details). The metric v alues for all architectures discussed in this section are in the range of the challenge results, with the multi-scale architectures, including the msY -family models and the multi-scale ensembles, reaching top performance. Finally , table 3 shows the performance of corresponding models applied to lymph node metastases segmentation. The results are again in line with the findings on P AIP 2019 and B A CH 2018 data. Ho wever , the performance increase through the use of multiple scales is smaller in CAMEL Y ON 2016 / MM (6.8% as compared to 16.3% for both P AIP 2019 and BA CH 2018), which fits our considerations on the di ff erent nature and di ffi culty of these tasks (cf. section 3.1.3). W ith respect to the generalizability of these results, we further note that, later, an in- dependent group has been able to present additional evidence in fav or of these findings on yet other data (v an Rijtho ven et al., 2020). The group used a related but di ff erent end-to-end-trainable multi-scale model that confirms the benefit from the introduction of a context-encoder , though they train their context-encoder using an additional de- coder that makes the model much heavier in terms of trainable parameters and GPU usage and voids the resource impro vements as compared to multi-scale ensembles. 5.2. Context classification loss-based deep guidance for conte xt encoder training In order to examine whether the additional classification loss is indeed helpful for “guidance” of the global context encoder during training, we re-examined the msY 2 -, the msY (16) - and the msY I -Net models on the P AIP 2019 dataset when trained with or without the additional classification loss. From the results in table 4, it appears that the additional use of the classification loss consistently improves the model training. Recalling that the relativ e sizes of the detail and the global context encoder input patches (cf. figure 1) translate to a corresponding center-crop operation on the conte xt encoder feature maps (as part of the multi-scale merge block, cf. figure 2a), this beha viour might be understood intuitiv ely as the the 27 T able 4: Context classification loss guidance for training of the global context encoder . Numbers are the class-weighted Jaccard indices for the P AIP 2019 dataset. The best results per pairwise comparison and split are marked in bold, where di ff erences < 0 . 005 are ignored. Arch. Clss. loss # pms. † Mem. ‡ W eighted Jaccard Per CV f old Mean (95% CI) msY 2 -Net with 40.761 1.561 0.847 0.873 0.795 0.934 0.876 0.865 (0.825, 0.905) without 40.759 1.436 0.903 0.851 0.737 0.826 0.779 0.819 (0.769, 0.869) msY 16 -Net with 29.284 1.281 0.861 0.872 0.789 0.873 0.889 0.857 (0.826, 0.887) without 29.282 1.175 0.883 0.847 0.713 0.715 0.764 0.785 (0.724, 0.845) † in units of one million parameters ‡ GPU memory footprint giv en in gigabytes per image patch in batch classification loss helping the context encoder acquire additional gradients for training. Importantly , this technique comes with a very moderate overhead both in terms of the number of additional parameters and the e ff ectiv e GPU memory footprint. 5.3. Necessity for spatial alignment in multi-scale mer ge blocks Drawing on theoretical considerations, we hav e constructed the multi-scale merge blocks such that spatial relationships between the di ff erent paths are preserved upon fusion. T able 5 repeats the results for the msY 2 -Net and compares them to those of two variants of the same architecture which both do not adhere to this condition. These are constructed by concatenating the bottleneck feature maps from the di ff erent paths without any spatial alignment as part of the multi-scale merge block, where the two variants di ff er in that the merging 1 × 1 conv olution is either initialized randomly or with pre-defined weights lea ving the main path unperturbed at training startup (cf. section 4.2 for details). It can be seen that both these v ariants perform consistently worse than the proposed msY 2 -Net with correct spatial alignment in the multi-scale merge block. This is irre- spectiv e of whether the weights of the 1 × 1 conv olution are randomly initialized or 28 T able 5: Spatial alignment at multi-scale path fusion. Numbers are the class-weighted Jaccard indices for the P AIP 2019 dataset. All models are variants of the msY 2 architecture, either with spatial alignment at the multi-scale merge block (1, as per default) or without (2, 3). The best results per pairwise comparison and split are marked in bold, where di ff erences < 0 . 005 are ignored. msY 2 -Net variant W eighted Jaccard Per CV f old Mean (95% CI) spatially aligned 1 0.870 0.835 0.796 0.902 0.865 0.854 (0.822, 0.885) non-aligned, init 2 0.872 0.814 0.725 0.822 0.827 0.812 (0.770, 0.854) non-aligned, random 3 0.875 0.787 0.777 0.808 0.832 0.816 (0.785, 0.847) whether they are initialized such that the ResNet18 encoder of the underlying U-Net is left untouched by the un-aligned mer ge connections. This suggests that the deficit through the missing alignment step may be architectural rather than only a disturbance of the pretrained encoder by the additional 1 × 1 conv olution. W e therefore conclude that, when merging paths at the bottleneck level in a manner as done by the multi-scale merge block, spatial matching is a necessary step. 5.4. Additional path fusions can be added by intr oduction of multiple multi-scale mer ge blocks T able 6 compares the standard msY 2 -, the msY (16) - and the msY I -Net with multi- scale merge blocks only at the bottleneck to their respecti ve analogues with multi-scale merge connections at e very le vel of the encoder . Our study cannot find relev ant di ff erences between single-merge and multiple- merge setups. Howe ver , the additional merge connections did at least not lead to any instability in model training. Moreover , they come with a moderate increase in the number of trainable parameters and GPU memory requirements only . Therefore, mul- tiple path fusions can be readily included in msY family models and can be used for further optimization, e.g. by systematic neural architecture searches. 29 T able 6: Multi-lev el multi-scale merging: For three di ff erent multi-scale architectures, the standard variant with multi-scale fusion by a single multi-scale merge block only at the bottleneck (”bottleneck”) is compared to an analogous architecture, but with multi-scale merge blocks at each individual encoder lev el (”multiple”). Numbers are the class-weighted Jaccard indices at the P AIP 2019 dataset. The best results per pairwise comparison and split are marked in bold, where di ff erences < 0 . 005 are ignored. msY 2 -Net variant Merge block(s) # pms. † Mem. ‡ W eighted Jaccard Per CV f old Mean (95% CI) msY (16) -Net bottleneck 29.284 1.175 0.861 0.872 0.789 0.873 0.889 0.857 (0.826, 0.887) multiple 29.464 1.281 0.854 0.848 0.769 0.881 0.903 0.851 (0.811, 0.891) msY I -Net bottleneck 40.460 1.398 0.847 0.871 0.804 0.895 0.910 0.865 (0.833, 0.898) multiple 41.032 1.556 0.859 0.872 0.805 0.911 0.897 0.869 (0.836, 0.901) msY 2 (Res34) -Net bottleneck 50.869 1.516 0.870 0.835 0.796 0.902 0.865 0.854 (0.822, 0.885) multiple 51.140 1.608 0.876 0.879 0.802 0.863 0.915 0.867 (0.835, 0.899) † in units of one million parameters ‡ GPU memory footprint giv en in gigabytes per image patch in batch 30 6. Discussion and Conclusions Using the segmentation of carcinoma in hematoxylin-eosin (H&E) stained whole- slide images as an example task, our results sho w that the extensi ve integration of widely di ff erent spatial scales, as a “mimicry” of how humans approach analogous tasks, o ff ers significant and rele vant improvements over baseline single-scale U-Nets as the de facto standard in histopathology image segmentation. The improvement has been consistently shown for three di ff erent datasets, clinical scenarios and tumor enti- ties. From a methodical and architectural perspective, our study presents a family of models that can integrate context from multiple scales and at various lev els. As an ov erarching e ff ect, it shows that when fusing encoder paths from di ff erent scales, spa- tial alignment and the preservation of spatial relationships is necessary . The proposed multi-scale merge block fulfils this requirement. The performance of the proposed ar- chitectures in terms of segmentation accuracy was further shown to be (at least) on par with ensembles of U-Nets, where the proposed multi-scale models models are end- to-end trainable systems with a reduced number of parameters and smaller memory footprint. It should, howe ver , be noted that only common ensembling techniques have been studied, and more sophisticated techniques could potentially lead to further im- prov ement. Moreover , di ff erent to Karimi et al. (2020b), the logistic regression-based ensembling did not lead to better performance than standard av eraging of the class probabilities of the U-Net trained for the di ff erent scales. The reason remains so far unclear; potential explanations could be the di ff erent application addressed (Gleason scoring vs. tumor se gmentation) and di ff erences in implementation. It goes without saying that future research is also lik ely to optimize the multi-scale models presented herein much further . As the detailed structure of encoder , decoder and possible skip connections are left entirely untouched, the proposed multi-scale architectures can seamlessly be adopted to various encoder-decoder models. In par- ticular , increased receptive fields in the individual encoders may benefit msY family models, as these would allow the center-crop of multi-scale merge block to acquire high-lev el features from a larger region. Therefore, the use of dilated or atrous con vo- 31 lutions and atrous spatial pyramid pooling (Chen et al., 2017a,b) in the context encoders might considerably benefit the models of the proposed multi-scale architecture family . Continuing with potential for improv ement, we note that – as a straightforward exten- sion of standard single scale CNN-based segmentation – we trained our networks and encoders on the original ”raw” image information. This approach neglects classical work on multi-resolution image representation, which could also be advantageous in the gi ven application context. Moreover , adding multi-level wav elet transforms to the CNN architecture has recently be sho wn as a very promising means to enlarge percep- tiv e fields (Liu et al., 2018; Savareh et al., 2019), which, as said, can be particularly beneficial when implemented in the context encoders. W e hav e sho wn how the proposed building blocks and the underlying intuition can be extended to any number of arbitrarily sized spatial scales, as relev ant for the partic- ular organ and disease of interest. Moreover , additional and early merge connections may o ff er the possibility to model more complex relations between the di ff erent scales. W e ha ve shown that the proposed multi-scale merge block can be flexibly used at many lev els, and that ev en msY family models with path fusions at all possible encoder lev els can be trained robustly and with minor GPU memory ov erhead. As both the relev ant spatial scales as well as the complexity of the tasks vary between applications, we fi- nally envision that the msY family architectures with multiple merges open up a rich en vironment and search space also for neural architecture searches. Apart from the pure network architecture perspecti ve, we used binary cross entrop y as a very common, widely used and accepted loss function for the current study . The results, howe ver , already reveal that the integration of an additional context content loss (although again implemented as cross entropy) improves performance. This suggests that the application- and / or architecture-specific loss function design bears the poten- tial for a further improvement of WSI segmentation performance. Furthermore, we directly made use of the labels and annotations as pro vided by the respectiv e challenge organizers for our experiments. It is, howe ver , well known that the annotation of WSI slides is prone to errors and inter-observer v ariability . Over the past years, handling of label noise and uncertain annotation has attracted increasing interest and attention in the medical image analysis domain and in computational pathology , where, again, de- 32 sign of specific loss functions provides a promising approach (see Karimi et al. (2020a) for a recent revie w). Concerning the limitations of this study , the results are so far based on three pub- licly av ailable H&E stained WSI image datasets; it remains to be seen in future work whether the results generalize to di ff erent image data, other tasks, including tumor grading and regression tasks (e.g. for surviv al prediction), and other diseases. Further- more, our analysis was built on a cross validation strategy; therefore, confirmation of our findings on separate independent test databases would clearly be desirable. Finally , whilst superior performance was consistently found for the three independent datasets, there still is a dataset dependency . In line with the underlying motiv ation of a human pathologist’ s mimicry , the data suggest that the performance increase is larger on tasks that require the human pathologist to integrate information from di ff erent scales (P AIP 2019, B ACH 2018) and smaller on simpler tasks with more focus on individual cells (CAMEL YON 2016 / MM). Despite the remaining limitations and potential for future work, the presented study provides clear evidence that a mimicry of how human experts approach a specific task can be successfully used to develop specialized machine learning architectures. It ad- vocates the integration of extensi ve multi-scale conte xt into deep learning models for complex tasks in computational histopathology . Acknowledgments This study was partially supported by an unrestricted grant from Olympus Co Hambur g, Germany , and by the Forschungszentrum Medizintechnik Hambur g (grant 02fmthh2017), Hambur g, Germany . RS gratefully acknowledges funding by the Studienstiftung des deutschen V olkes and the G ¨ unther Elin Krempel foundation. TR recei ves study support for v arious projects from Olympus Co Hamburg, Germany , but declares that there is no conflict to disclose with regards to this project. R W receiv es funding from Siemens Health- care, Erlangen, Germany , b ut declares that there is no conflict to disclose re garding this project. 33 The authors would like to thank NVIDIA for the donation of a graphics card under the GPU Grant Program. In addition, the authors are grateful to ward Hinnerk St ¨ uben for his excellent technical support and to ward Claus Hilgetag for proofreading and valuable discussions. References Aresta, G., Ara ´ ujo, T ., Kwok, S., Chennamsetty , S.S., Safwan, M., Alex, V ., Marami, B., Prastawa, M., Chan, M., Donovan, M., Fernandez, G., Zeineh, J., Kohl, M., W alz, C., Ludwig, F ., Braunewell, S., Baust, M., V u, Q.D., T o, M.N.N., Kim, E., Kwak, J.T ., Galal, S., Sanchez-Freire, V ., Brancati, N., Frucci, M., Riccio, D., W ang, Y ., Sun, L., Ma, K., Fang, J., Kone, I., Boulmane, L., Campilho, A., Eloy , C., Pol ´ onia, A., Aguiar , P ., 2019. B A CH: Grand challenge on breast cancer histology images. Medical Image Analysis 56, 122–139. doi: 10.1016/j.media.2019.05.010 . Badrinarayanan, V ., K endall, A., Cipolla, R., 2017. SegNet: A Deep Con volutional Encoder-Decoder Architecture for Image Se gmentation. IEEE Transactions on Pattern Analysis and Machine Intelligence 39, 2481–2495. doi: 10.1109/TPAMI. 2016.2644615 . Bejnordi, B.E., V eta, M., v an Diest, P .J., van Ginneken, B., Karssemeijer , N., Litjens, G., van der Laak, J.A.W .M., Hermsen, M., Manson, Q.F ., Balkenhol, M., Geessink, O., Stathonikos, N., van Dijk, M.C., Bult, P ., Beca, F ., Beck, A.H., W ang, D., Khosla, A., Gargeya, R., Irshad, H., Zhong, A., Dou, Q., Li, Q., Chen, H., Lin, H.J., Heng, P .A., Haß, C., Bruni, E., W ong, Q., Halici, U., ¨ Umit ¨ Oner , M., Cetin-Atalay , R., Berseth, M., Khvatko v , V ., Vylegzhanin, A., Kraus, O., Shaban, M., Rajpoot, N., A wan, R., Sirinukunwattana, K., Qaiser, T ., Tsang, Y .W ., T ellez, D., Annuscheit, J., Hufnagl, P ., V alkonen, M., Kartasalo, K., Latonen, L., Ruusuvuori, P ., Liimatainen, K., Albarqouni, S., Mungal, B., George, A., Demirci, S., Nav ab, N., W atanabe, S., Seno, S., T akenaka, Y ., Matsuda, H., Phoulady , H.A., K ovale v , V ., Kalinovsky , A., Liauchuk, V ., Bueno, G., Fernandez-Carrobles, M.M., Serrano, I., Deniz, O., Racoceanu, D., and, R.V ., 2017a. Diagnostic assessment of deep learning algorithms 34 for detection of lymph node metastases in women with breast cancer . J AMA 318, 2199. doi: 10.1001/jama.2017.14585 . Bejnordi, B.E., Zuidhof, G., Balkenhol, M., Hermsen, M., Bult, P ., v an Ginneken, B., Karssemeijer, N., Litjens, G., van der Laak, J., 2017b . Context-aware stacked con volutional neural networks for classification of breast carcinomas in whole-slide histopathology images. Journal of Medical Imaging 4, 1. doi: 10.1117/1.JMI.4. 4.044504 . Bosman, F .T ., Carneiro, F ., Hruban, R.H., Theise, N.D. (Eds.), 2010. WHO Classifica- tion of T umours of the Digestiv e System. volume 3. 4 ed. p. 209. Bouckaert, R.R., Frank, E., 2004. Evaluating the Replicability of Significance T ests for Comparing Learning Algorithms, in: Kanade, T ., Kittler, J., Kleinberg, J.M., Mattern, F ., Mitchell, J.C., Nierstrasz, O., Pandu Rangan, C., Ste ff en, B., Sudan, M., T erzopoulos, D., T ygar , D., V ardi, M.Y ., W eikum, G., Dai, H., Srikant, R., Zhang, C. (Eds.), Advances in Knowledge Discov ery and Data Mining. Springer , Berlin, Heidelberg. v olume 3056, pp. 3–12. doi: 10.1007/978- 3- 540- 24775- 3_3 . Brierley , J.D., Gospodarowicz, M.K., W ittekind, C. (Eds.), 2016. TNM Classification of Malignant T umours, 8th Edition. UICC, Wile y-Blackwell. Bulten, W ., B ´ andi, P ., Hoven, J., Loo, R.v .d., Lotz, J., W eiss, N., Laak, J.v .d., Ginneken, B.v ., Hulsbergen-v an de Kaa, C., Litjens, G., 2019. Epithelium seg- mentation using deep learning in H&E-stained prostate specimens with immuno- histochemistry as reference standard. Scientific Reports 9, 864. doi: 10.1038/ s41598- 018- 37257- 4 . Campanella, G., Hanna, M.G., Geneslaw , L., Miraflor , A., W erneck Krauss Silv a, V ., Busam, K.J., Brogi, E., Reuter , V .E., Klimstra, D.S., Fuchs, T .J., 2019. Clinical-grade computational pathology using weakly supervised deep learning on whole slide images. Nature Medicine 25, 1301–1309. doi: 10.1038/ s41591- 019- 0508- 1 . 35 Chen, L.C., Papandreou, G., K okkinos, I., Murphy , K., Y uille, A.L., 2017a. DeepLab: Semantic Image Segmentation with Deep Con volutional Nets, Atrous Con volution, and Fully Connected CRFs. arXiv:1606.00915 [cs] . Chen, L.C., Papandreou, G., Schro ff , F ., Adam, H., 2017b. Rethinking Atrous Conv o- lution for Semantic Image Segmentation. arXiv:1706.05587 [cs] . Edmondson, H.A., Steiner, P .E., 1954. Primary carcinoma of the li ver . a study of 100 cases among 48,900 necropsies. Cancer 7, 462–503. doi: 10.1002/ 1097- 0142(195405)7:3< 462::aid- cncr2820070308> 3.0.co;2- e . Epstein, J.I., Egev ad, L., Srigley , J.R., Humphrey , P .A., 2016. The 2014 International Society of Urological Pathology (ISUP) Consensus Conference on Gleason Grading of Prostatic Carcinoma. Am J Surg P athol 40, 9. Gu, F ., Burlutskiy , N., Andersson, M., Wil ´ en, L.K., 2018. Multi-resolution Networks for Semantic Segmentation in Whole Slide Images, in: Stoyanov , D., T aylor , Z., Ciompi, F ., Xu, Y ., Martel, A., Maier -Hein, L., Rajpoot, N., v an der Laak, J., V eta, M., McKenna, S., Snead, D., T rucco, E., Garvin, M.K., Chen, X.J., Bogunovic, H. (Eds.), Computational P athology and Ophthalmic Medical Image Analysis, Springer International Publishing, Cham. pp. 11–18. doi: 10.1007/978- 3- 030- 00949- 6_2 . He, K., Zhang, X., Ren, S., Sun, J., 2015. Deep Residual Learning for Image Recogni- tion. arXiv:1512.03385 [cs] . Heller , N., Isensee, F ., Maier-Hein, K.H., Hou, X., Xie, C., Li, F ., Nan, Y ., Mu, G., Lin, Z., Han, M., Y ao, G., Gao, Y ., Zhang, Y ., W ang, Y ., Hou, F ., Y ang, J., Xiong, G., T ian, J., Zhong, C., Ma, J., Rickman, J., Dean, J., Stai, B., T ejpaul, R., Oestreich, M., Blake, P ., Kaluzniak, H., Raza, S., Rosenberg, J., Moore, K., W alczak, E., Rengel, Z., Edgerton, Z., V asde v , R., Peterson, M., McSweeney , S., Peterson, S., Kalapara, A., Sathianathen, N., Papanikolopoulos, N., W eight, C., 2019. The state of the art in kidney and kidney tumor segmentation in contrast-enhanced ct imaging: Results of the kits19 challenge. arXiv:1912.01054 . 36 Isensee, F ., Petersen, J., Klein, A., Zimmerer, D., Jaeger , P .F ., Kohl, S., W asserthal, J., K oehler, G., Norajitra, T ., W irkert, S., Maier-Hein, K.H., 2018. nnU- Net: Self-adapting Framew ork for U-Net-Based Medical Image Segmentation. arXiv:1809.10486 [cs] . Isensee, F ., Petersen, J., K ohl, S.A.A., J ¨ ager , P .F ., Maier-Hein, K.H., 2019. nnU-Net: Breaking the Spell on Successful Medical Image Se gmentation. arXi v:1904.08128 [cs] . Kamnitsas, K., Ledig, C., Ne wcombe, V .F ., Simpson, J.P ., Kane, A.D., Menon, D.K., Rueckert, D., Glocker , B., 2017. E ffi cient multi-scale 3d CNN with fully connected CRF for accurate brain lesion segmentation. Medical Image Analysis 36, 61–78. doi: 10.1016/j.media.2016.10.004 . Karimi, D., Dou, H., W arfield, S.K., Gholipour , A., 2020a. Deep learning with noisy labels: Exploring techniques and remedies in medical image analysis. Medical Im- age Analysis 65, 101759. doi: 10.1016/j.media.2020.101759 . Karimi, D., Nir , G., Fazli, L., Black, P .C., Goldenber g, L., Salcudean, S.E., 2020b . Deep Learning-Based Gleason Grading of Prostate Cancer From Histopathology Images—Role of Multiscale Decision Aggregation and Data Augmentation. IEEE Journal of Biomedical and Health Informatics 24, 1413–1426. doi: 10.1109/JBHI. 2019.2944643 . Kickingereder , P ., Isensee, F ., T ursunov a, I., Petersen, J., Neuberger , U., Bonekamp, D., Brugnara, G., Schell, M., Kessler , T ., Foltyn, M., Harting, I., Sahm, F ., Prager , M., No wosielski, M., W ick, A., Nolden, M., Radbruch, A., Debus, J., Schlemmer, H.P ., Heiland, S., Platten, M., von Deimling, A., v an den Bent, M.J., Gorlia, T ., W ick, W ., Bendszus, M., Maier-Hein, K.H., 2019. Automated quantitative tumour response assessment of MRI in neuro-oncology with artificial neural networks: a multicentre, retrospectiv e study . The Lancet Oncology 20, 728–740. doi: 10.1016/ S1470- 2045(19)30098- 1 . Kim, Y .J., Jang, H., Lee, K., Park, S., Min, S.G., Hong, C., P ark, J.H., Lee, K., Kim, J., Hong, W ., Jung, H., Liu, Y ., Rajkumar , H., Khened, M., Krishnamurthi, G., Y ang, 37 S., W ang, X., Han, C.H., Kwak, J.T ., Ma, J., T ang, Z., Marami, B., Zeineh, J., Zhao, Z., Heng, P .A., Schmitz, R., Madesta, F ., R ¨ osch, T ., W erner , R., Tian, J., Puybareau, E., Bovio, M., Zhang, X., Zhu, Y ., Chun, S.Y ., Jeong, W .K., Park, P ., Choi, J., 2021. Paip 2019: Li ver cancer segmentation challenge. Medical Image Analysis 67, 101854. doi: 10.1016/j.media.2020.101854 . Kingma, D.P ., Ba, J., 2014. Adam: A method for stochastic optimization. arXiv:1412.6980 . Lakhani, S., Ellis, I., Schnitt, S., T an, P ., van de V ijver , M. (Eds.), 2012. WHO Classi- fication of T umours of the Brest. volume 4. 4 ed. Li, J., Sarma, K.V ., Chung Ho, K., Gertych, A., Knudsen, B.S., Arnold, C.W ., 2018a. A Multi-scale U-Net for Semantic Segmentation of Histological Images from Radical Prostatectomies. AMIA Annual Symposium Proceedings 2017, 1140–1148. Li, S., Tso, G.K.F ., 2019. Bottleneck Supervised U-Net for Pixel-wise Liver and T umor Segmentation. arXiv:1810.10331 [cs] . Li, X., Chen, H., Qi, X., Dou, Q., Fu, C.W ., Heng, P .A., 2018b . H-DenseUNet: Hybrid Densely Connected UNet for Liv er and T umor Segmentation from CT V olumes. arXiv:1709.07330 [cs] . Litjens, G., Kooi, T ., Bejnordi, B.E., Setio, A.A.A., Ciompi, F ., Ghafoorian, M., van der Laak, J.A.W .M., van Ginneken, B., S ´ anchez, C.I., 2017. A surve y on deep learning in medical image analysis. Medical Image Analysis 42, 60–88. doi: 10.1016/j. media.2017.07.005 . Liu, P ., Zhang, H., Zhang, K., Lin, L., Zuo, W ., 2018. Multi-level W avelet-CNN for Image Restoration, in: 2018 IEEE / CVF Conference on Computer V ision and Pat- tern Recognition W orkshops (CVPR W), IEEE, Salt Lake City , UT . pp. 886–88609. doi: 10.1109/CVPRW.2018.00121 . Liu, W ., Rabinovich, A., Berg, A.C., 2015. ParseNet: Looking W ider to See Better. arXiv:1506.04579 [cs] . 38 Liu, Y ., Gadepalli, K., Norouzi, M., Dahl, G.E., Kohlber ger, T ., Boyk o, A., V enu- gopalan, S., Timofee v , A., Nelson, P .Q., Corrado, G.S., Hipp, J.D., Peng, L., Stumpe, M.C., 2017. Detecting Cancer Metastases on Gigapixel P athology Images. arXiv:1703.02442 , 13. Long, J., Shelhamer , E., Darrell, T ., 2015. Fully Con volutional Networks for Semantic Segmentation. Proceedings of the IEEE Conference on Computer V ision and Pattern Recognition , 3431–3440. Maier , O., Menze, B.H., von der Gablentz, J., H ¨ ani, L., Heinrich, M.P ., Liebrand, M., W inzeck, S., Basit, A., Bentley , P ., Chen, L., Christiaens, D., Dutil, F ., Eg- ger , K., Feng, C., Glocker , B., G ¨ otz, M., Haeck, T ., Halme, H.L., Hav aei, M., Iftekharuddin, K.M., Jodoin, P .M., Kamnitsas, K., K ellner , E., Korv enoja, A., Larochelle, H., Ledig, C., Lee, J.H., Maes, F ., Mahmood, Q., Maier-Hein, K.H., McKinley , R., Muschelli, J., Pal, C., Pei, L., Rangarajan, J.R., Reza, S.M., Robben, D., Rueckert, D., Salli, E., Suetens, P ., W ang, C.W ., W ilms, M., Kirschke, J.S., Kr ¨ amer , U.M., M ¨ unte, T .F ., Schramm, P ., Wiest, R., Handels, H., Reyes, M., 2017. ISLES 2015 - A public e valuation benchmark for ischemic stroke lesion segmentation from multispectral MRI. Medical Image Analysis 35, 250–269. doi: 10.1016/j.media.2016.07.009 . Mehta, S., Mercan, E., Bartlett, J., W eav er, D., Elmore, J.G., Shapiro, L., 2018. Y - Net: Joint Se gmentation and Classification for Diagnosis of Breast Biopsy Images, in: Frangi, A.F ., Schnabel, J.A., Da vatzik os, C., Alberola-L ´ opez, C., Fichtinger , G. (Eds.), Medical Image Computing and Computer Assisted Intervention – MIC- CAI 2018. Springer International Publishing, Cham. volume 11071, pp. 893–901. doi: 10.1007/978- 3- 030- 00934- 2_99 . Nadeau, C., Bengio, Y ., 2000. Inference for the Generalization Error. Adv ances in neural information processing systems 12, 307–313. Ning, Z., Zhang, X., T u, C., Feng, Q., Zhang, Y ., 2019. Multiscale Context-Cascaded Ensemble Framew ork (MsC2EF): Application to Breast Histopathological Image. IEEE Access 7, 150910–150923. 39 Nir , G., Hor , S., Karimi, D., Fazli, L., Skinnider, B.F ., T avassoli, P ., T urbin, D., V il- lamil, C.F ., W ang, G., W ilson, R.S., Iczko wski, K.A., Lucia, M.S., Black, P .C., Abolmaesumi, P ., Goldenberg, S.L., Salcudean, S.E., 2018. Automatic grading of prostate cancer in digitized histopathology images: Learning from multiple experts. Medical Image Analysis 50, 167–180. doi: 10.1016/j.media.2018.09.005 . Oktay , O., Schlemper , J., Folgoc, L.L., Lee, M., Heinrich, M., Misawa, K., Mori, K., McDonagh, S., Hammerla, N.Y ., Kainz, B., Glocker , B., Rueck ert, D., 2018. Attention U-Net: Learning Where to Look for the P ancreas. Paszke, A., Gross, S., Chintala, S., Chanan, G., Y ang, E., DeV ito, Z., Lin, Z., Des- maison, A., Antiga, L., Lerer , A., 2017. Automatic di ff erentiation in pytorch. NIPS 2017 workshop . R Core T eam, 2013. R: A Language and En vironment for Statistical Computing. R Foundation for Statistical Computing, V ienna, Austria. URL: http://www. R- project.org/ . Reinhard, E., Adhikhmin, M., Gooch, B., Shirley, P ., 2001. Color transfer between images. IEEE Computer Graphics and Applications 21, 34–41. doi: 10.1109/38. 946629 . van Rijthov en, M., Balkenhol, M., Silin ¸ a, K., van der Laak, J., Ciompi, F ., 2020. HookNet: multi-resolution con volutional neural networks for semantic segmenta- tion in histopathology whole-slide images. arXiv:2006.12230 [cs, eess] . Ronneberger , O., Fischer , P ., Brox, T ., 2015. U-Net: Con volutional Networks for Biomedical Image Segmentation. Medical Image Computing and Computer- Assisted Intervention – MICCAI 2015 9351, 234–241. Russakovsk y , O., Deng, J., Su, H., Krause, J., Satheesh, S., Ma, S., Huang, Z., Karpa- thy , A., Khosla, A., Bernstein, M., Berg, A.C., Fei-Fei, L., 2015. ImageNet Lar ge Scale V isual Recognition Challenge. International Journal of Computer V ision 115, 211–252. doi: 10.1007/s11263- 015- 0816- y . 40 Sav areh, B.A., Emami, H., Hajiabadi, M., Azimi, S.M., Ghafoori, M., 2019. W av elet- enhanced con volutional neural network: a new idea in a deep learning paradigm. Biomedical Engineering / Biomedizinische T echnik 64, 195–205. doi: 10.1515/ bmt- 2017- 0178 . Schmitz, R., Krause, J., Krech, T ., R ¨ osch, T ., 2018. V irtual Endoscopy Based on 3- Dimensional Reconstruction of Histopathology Features of Endoscopic Resection Specimens. Gastroenterology 154, 1234–1236.e4. doi: 10.1053/j.gastro.2017. 11.291 . Sego via-Miranda, F ., Morales-Navarrete, H., K ¨ ucken, M., Moser , V ., Seifert, S., Rep- nik, U., Rost, F ., Brosch, M., Hendricks, A., Hinz, S., R ¨ ocken, C., L ¨ utjohann, D., Kalaidzidis, Y ., Schafmayer , C., Brusch, L., Hampe, J., Zerial, M., 2019. Three- dimensional spatially resolved geometrical and functional models of human liv er tissue rev eal new aspects of NAFLD progression. Nature Medicine 25, 1885–1893. doi: 10.1038/s41591- 019- 0660- 7 . V u, Q.D., Kwak, J.T ., 2019. A Dense Multi-Path Decoder for T issue Segmentation in Histopathology Images. Computer Methods and Programs in Biomedicine doi: 10. 1016/j.cmpb.2019.03.007 . W ang, S., Zhu, Y ., Y u, L., Chen, H., Lin, H., W an, X., Fan, X., Heng, P .A., 2019. RMDL: Recalibrated Multi-instance Deep Learning for Whole Slide Gastric Im- age Classification. Medical Image Analysis , 101549doi: 10.1016/j.media.2019. 101549 . W etteland, R., Engan, K., Eftestol, T ., Kvidstad, V ., M., J.E.A., 2019. Multiscale deep neural networks for multiclass tissue classification of histological whole-slide images, in: Medical Imaging with Deep Learning (MIDL) 2019. Zhang, H., Dana, K., Shi, J., Zhang, Z., W ang, X., T yagi, A., Agraw al, A., 2018. Context Encoding for Semantic Se gmentation. arXiv:1803.08904 [cs] . Zhou, Y ., Sun, X., Zha, Z.J., Zeng, W ., 2019. Context-Reinforced Semantic Segmen- 41 tation. The IEEE Conference on Computer V ision and Pattern Recognition (CVPR) , 4046–4055. Zink, D., Fischer, A.H., Nickerson, J.A., 2004. Nuclear structure in cancer cells. Nature Revie ws Cancer 4, 677–687. doi: 10.1038/nrc1430 . 42 Figure 4: Exemplary cases from the P AIP 2019 (A), BA CH 2018 (B) and CAMEL YON 2016 (C) datasets. The arrows mark regions of hepatocallular carcinoma, breast carcinoma and a lymph node macrometastasis in A, B and C, respectively . In B, benign and in situ lesions are indicated by stars and x’ s. Beside the macrometastasis in C, also isolated tumor cells are found (next to the triangle). 43 Supplementary Materials to: Multi-scale fully con volutional neural networks f or histopathology image segmentation: from nuclear aberrations to the global tissue architectur e R ¨ udiger Schmitz * , Frederic Madesta, Maximilian Nielsen, Jenny Krause, Stefan Steurer , Ren ´ e W erner ** , Thomas R ¨ osch ** S1. Base model architectur e A detailed view of the baseline model architecture is provided in figure S1. S2. Establishment of the CAMEL Y ON 2016 macrometastases subset: CAMEL Y ON 2016 / MM Starting from the original CAME- L YON 2016 dataset, we created our sub- set CAMEL YON 2016 / MM as follows: First, we sorted all cases by the size of the total tumor region in pixels. Starting from the WSI with the lar gest total tu- mor region, we visually checked for the presence of macrometastases, where we additionally excluded cases which con- tained almost no non-cancerous regions and which had almost no border between healthy and cancerous tissue (as these would not have been well suited for the analysis of segmentation performance). W e stopped when N = 20 samples had been reached. Referring to the original file names in the CAMEL YON 2016 dataset, we ended up with the following WSIs in CAMEL YON 2016 / MM: “tumor 009”, “tumor 011”, “tumor 016”, “tumor 026”, “tumor 031”, “tumor 046”, “tumor 047”, “tumor 055”, “tumor 058”, “tumor 068”, “tumor 078”, “tumor 082”, “tumor 085”, “tumor 088”, “tumor 089”, “tumor 090”, “tumor 095”, “tumor 101”, “tumor 102”, “tumor 110”. S3. Baseline model results As described in section 4 of the main article, the experiments are repeated three times for the baseline model. The detailed results for each individual repetition are * Corresponding author: r.schmitz@uke.de ** Equal contribution. S-1 Figure S1: ResNet18-based U-Net architecture (baseline model). For each block the spacial image shape as well as the number of channels are giv en. Here, C f i , f o m × n denotes a single m × n con volution with f i input and f o output feature maps, followed by ReLU acti vation. C f m × n l shall represent l consecutiv e m × n conv olutions with f output maps, each followed by a ReLU activ ation function. For the encoding part, the blocks ( C f res ) of a ResNet18 are used where f denotes number of the respective output feature maps. Each individual block introduces a spatial downscaling by a factor of 2, either through max pooling or strided convolutions. The decoder uses m × n bilinear upsampling ( U m × n ) to enlarge the spacial dimensions. T able S1: Class-average of the v alidation Jaccard index for whole and viable tumor at conv ergence of the validation loss for the baseline model in three independent training runs. CV folds 0 1 2 3 4 Run 0 0.833 0.757 0.651 0.735 0.723 Run 1 0.803 0.720 0.706 0.732 0.744 Run 2 0.806 0.786 0.701 0.737 0.721 S-2 giv en in table S1. S4. Statistical significance tests and es- timation of the statistical power of the study Results from corresponding CV splits are considered as paired measurements. Use of a paired-sample t-test, ho we ver , re- quires statistical independence of the ex- periments which is violated in a cross- validation setting. Therefore, we per - form a corrected resampled paired-sample t-test, with the correction as introduced by (Nadeau and Bengio, 2000) and dis- cussed by (Bouckaert and Frank, 2004). For the reason that all multi-scale archi- tectures can reproduce the behaviour of the baseline U-Net, we use a one-sided re- sampled paired-sample t-test. Addition- ally , in order to correct for multiple test- ing, we employ the Benjamini-Hochberg step-up procedure. Using the results from the baseline model (cf. section S3), we seek to pre- estimate the statistical power of our study: W e estimate the standard deviation of the Jaccard index for a single model to be in the range of 0 . 045. Therefore, for the standard deviation of the di ff erences be- tween tw o models, we assume √ 2 · 0 . 045. The resampling correction by Nadeau and Bengio can be viewed as an additional fac- tor of q 1 n + n val n train / q 1 n to the standard de- viation, where n denotes the number of CV splits and n tr ain and n val are the num- ber of samples in the train and valida- tion set, respectively . In our experiments, with n tr ain = 40 and n val = 10 for P AIP , n tr ain = 8 and n val = 2 for BA CH and n tr ain = 16 and n val = 4 for CAME- L YON, this computes to 1 . 5. Therefore, we can estimate the po wer of our study to be equal to the power of a standard paired- sample t-test with a standard de viation of the pairs of 1 . 5 · √ 2 · 0 . 045. W e aim for an improv ement ov er the baseline U-Net of 0 . 1 to 0 . 15 for the multi-scale models, resulting in a statistical power in between 0 . 613 and 0 . 888. For di ff erences between di ff erent multi-scale models, which we expect to be around 0 . 05, howe ver , our study is clearly underpowered (statistical power 0 . 253). W e therefore conclude that comparisons of multi-scale architectures with respect to the baseline U-Net are amenable to an analysis of statistical sig- nificance, whereas di ff erences within the family of multi-scale models are not. S-3 S5. GPU memory f ootprint analysis For analysis of the GPU memory foot- print, we hav e examined the GPU memory usage of both forward and backward pass as printed by the NVIDIA System Man- agement Interface and performed a linear regression with v arying batch size. T a- ble S2 pro vides the detailed results of this. W e interpret the slope of that analysis, i.e. the amount with which the required GPU memory increases when adding another image patch to the batch, as the “GPU footprint” of the model and the intercept as its ov erhead. S6. B A CH 2018 Complementary to table 2, table S3 provides the results for the custom metric used in the original B A CH 2018 challenge (Aresta et al., 2019). This metric has cer- tain disadvantages, including an unclear mapping of the classes to a rational scale and, importantly , being dominated by con- tributions of the (trivial) back ounground class, and is not used for our study . The results provided here, howe ver , sho w that the performance of our models lies in the range of the top-performing teams in the original challenge task (1 st place: 0.69, 2 nd : 0.55, 3 rd : 0.52). S-4 T able S2: Linear regression analysis of the GPU memory usage while training, including forward and back- ward pass. The memory footprint was read out via the NVIDIA System Management Interface. For the linear regression batches of size 2, 4, 6, 8, 10, 12 and 14 were used. Model Linear regr ession Slope Slope † Intercept ‡ R 2 % U-Net % Ens. U-Net (scale 1 or 16) 1.066 1.512 0.994 100.0 30.4 U-Net (scale 4) 1.374 1.382 0.998 128.89 39.19 Ensemble 3.506 § – – 328.9 100.0 msY (4) -Net 1.422 0.914 1.000 133.4 40.6 msY (16) -Net 1.175 1.799 0.988 110.2 33.5 msUI (4) -Net 1.389 0.538 0.997 130.3 39.6 msUI (16) -Net 1.355 0.712 0.998 127.1 38.6 msY 2 -Net 1.561 0.962 1.000 146.4 44.5 msY I -Net 1.398 1.273 0.999 131.2 39.9 msY 2 ( Re s 34) -Net 1.516 1.527 0.994 142.2 43.2 ms Y 2 -Net 1.436 1.669 0.984 134.7 41.0 msY (16) -Net (w / o class. loss) 1.175 1.799 0.988 110.2 33.5 Y (16) (w / o class. loss) 1.281 1.795 0.983 120.2 36.5 msY I -Net (w / multiple merges) 1.556 1.483 0.995 146.0 44.4 msY 2 (Res34) -Net (w / multiple merges) 1.608 1.532 0.995 150.8 45.9 § sum of three individual U-Nets (scales: 1, 4, 16) † giv en in gigabytes per image patch in batch ‡ giv en in gigabytes S-5 T able S3: Selected multi-scale architectures versus the baseline U-Net on the B A CH 2018 dataset and e valu- ated by the custom metric used for that challenge. For a quick ov erview , the best results per split and overall are marked in bold, ignoring di ff erences < 0 . 005. Arch. Scales # pms. † Mem. ‡ B A CH metric Per CV f old Mean (95% CI) U-Net 1 17.804 1.066 0.627 0.697 0.590 0.623 0.569 0.621 (0.583, 0.659) A vg. Ens. 1, 4, 16 53.412 § 3.506 § 0.641 0.692 0.688 0.801 0.682 0.701 (0.654, 0.748) Log. Ens. 1, 4, 16 53.412 § 3.506 § 0.597 0.679 0.703 0.761 0.555 0.659 (0.594, 0.724) Maj. Ens. 1, 4, 16 53.412 § 3.506 § 0.616 0.685 0.643 0.827 0.692 0.692 (0.629, 0.756) msY I -Net 1, 4, 16 40.460 1.398 0.570 0.591 0.562 0.798 0.572 0.619 (0.540, 0.698) msY 2 -Net 1, 4, 16 40.761 1.561 0.618 0.714 0.665 0.813 0.639 0.690 (0.629, 0.751) § sum of three individual U-Nets (scales: 1, 4, 16) † in units of one million parameters ‡ GPU memory footprint giv en in gigabytes per image patch in batch S-6
Original Paper
Loading high-quality paper...
Comments & Academic Discussion
Loading comments...
Leave a Comment