Real-time and interactive tools for vocal training based on an analytic signal with a cosine series envelope
We introduce real-time and interactive tools for assisting vocal training. In this presentation, we demonstrate mainly a tool based on real-time visualizer of fundamental frequency candidates to provide information-rich feedback to learners. The visu…
Authors: Hideki Kawahara, Ken-Ichi Sakakibara, Eri Haneishi
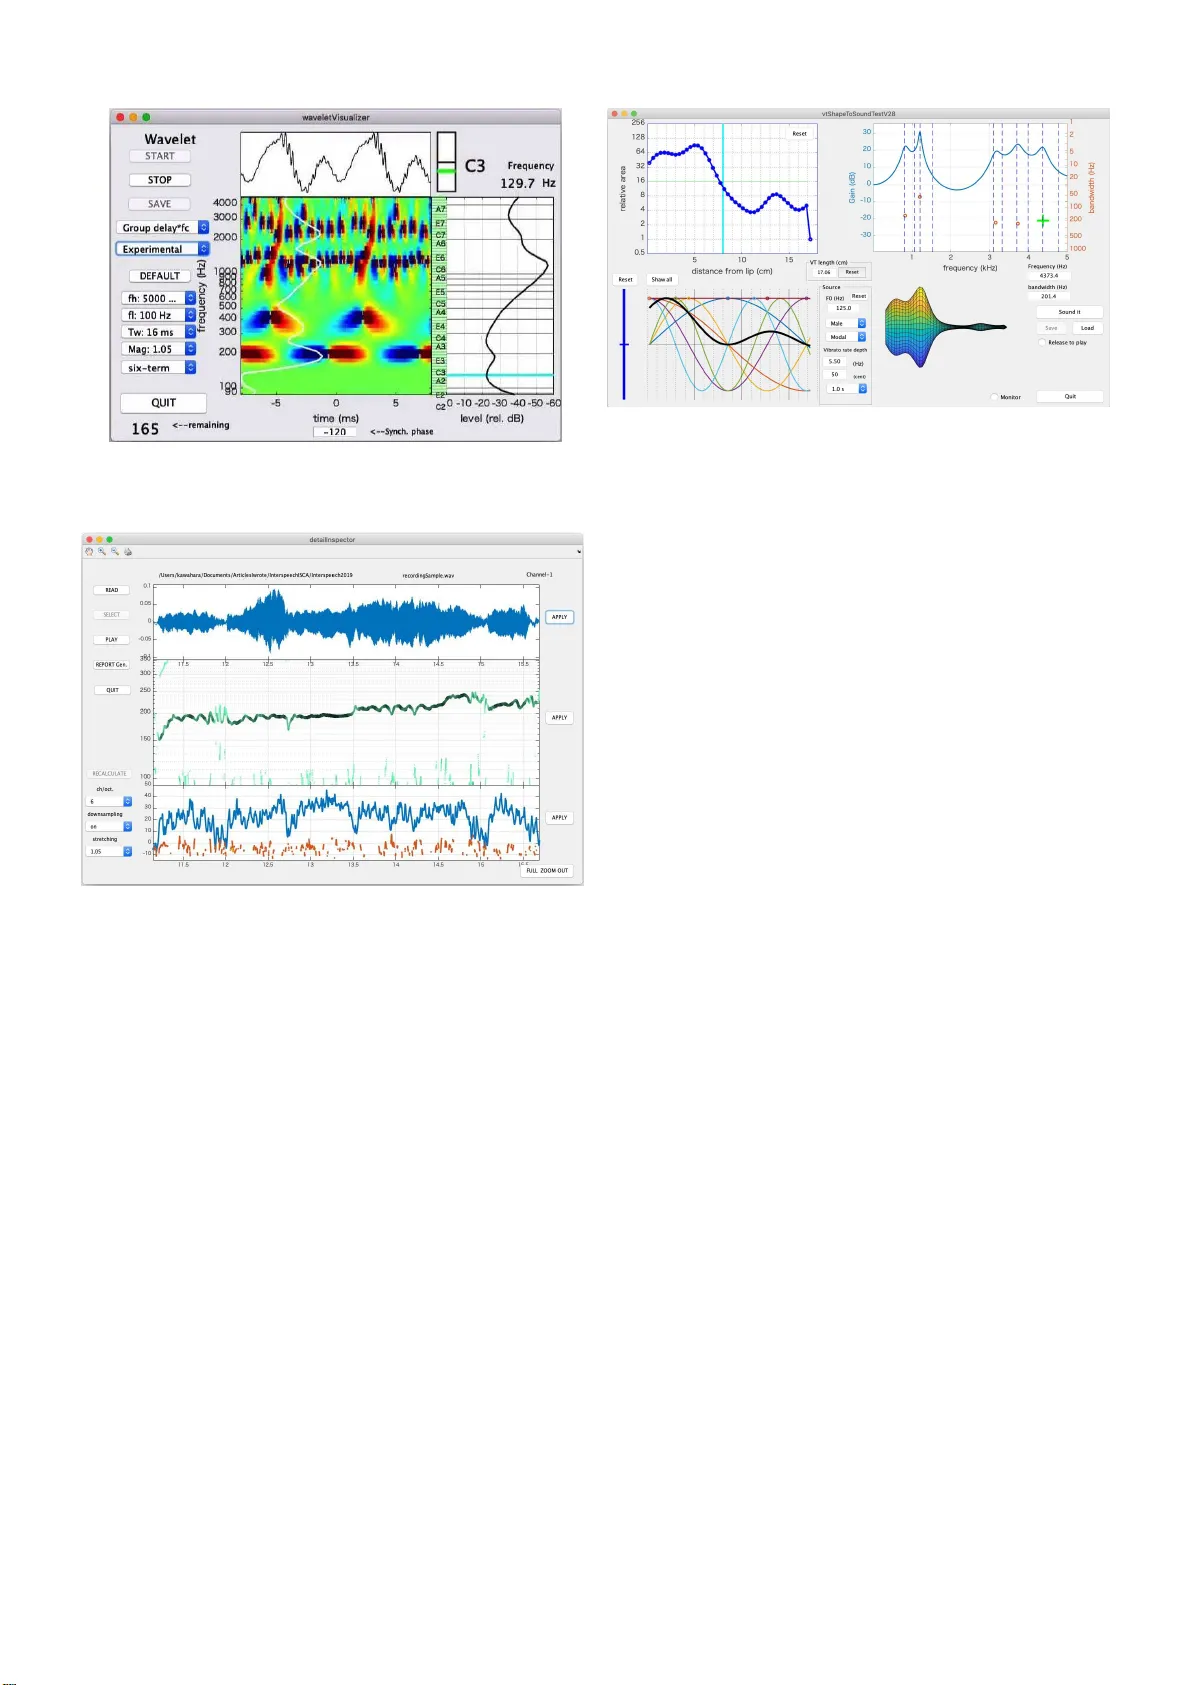
Real-ti me and interac ti v e tools for v ocal training based on an analytic s ignal with a cosine series en v elope Hideki Kawahara ∗ , K en-Ichi Sakakibara † , Eri Haneishi ‡ and Kaori Hagiwara ‡ ∗ W akayama University , W akayama, Japan E-mail: kawahara@wakayama-u . ac.jp † Health Science University of Hokk aido, Sapp oro, Japan E-mail: queso k is@gmail.com ‡ Show a University of M u sic, Kawasaki, Japan E-mail: haneish i@tosei-sh ow a-music.ac.jp, k-ha giwara@tosei-show a-music.ac.jp Abstract —W e introduce real-time and interactive tools f or assisting voca l trainin g. In this presentation, we demonstrate mainly a tool based on real-time visualizer of fu ndamental frequency candidates to provide inform ation-rich feedback to learners. The visualizer uses an efficien t algorithm u si ng analytic signals for deriving ph ase-based attributes. W e start using these tools in vocal trainin g for assisting learners to acquire the awareness of appropriate v ocalization. The first author made the MA TLAB implementation of the tools open-source. The code and associated video materials are accessible in the first author’ s GitHub repository . I . I N T RO D U C T I O N Adequate vocalization, such as speaking and singing, play s an essential r ole in main ta in ing a g ood qu ality of daily human life. For old adults, adequate vocalization h elps their quality of life by promotin g so cial com munication a c tivities and, in some cases, even re d ucing the risk of aspiration pneumo nia. For vocal pro f essionals, such as sing ers, teachers, and m usic th erapists, prop e r vocalization technique is crucial for p reserving their profession a l lives[1]. T o m aintain pr oper vocalization skills, we introduce tools for assisting vocal training. Real-tim e tools p rovide visual feedback of voicing attributes. T h e supportin g tools enable detailed analy sis and study the effects of articulatory changes. The tools use an extracto r of f o 1 (fund amental fr equency) can didates in real-time and aud io sampling rate using an alytic sign a ls with a six-term cosine series[3]. I t also uses oth er interactiv e tools for visualization of audito ry inform ation and spee c h produ ction processes[4]. The body part of this ar ticle focuses o n the introdu c tion and u se of the to ols. W e placed techn ical details in the ap pendix for m a k ing the body text less co nfusing. I I . R E A L - T I M E A N D I N T E R AC T I V E T O O L S This section main ly focuses on the tool ba sed on a real-time extractor o f f o candidates. In a train ing session, the instructo r uses th is too l interactively to demonstrate lear n ers how to control voicing by visualizing their voices in re al-time and playback the referen ce samples a n d the learner s’ voices. 1 Using “ f o ” instead of “F0” for representing fundamental frequency is based on a recommendat ion[2 ] Fig. 1. GUI of the tool with a real-ti me f o candida tes extra ctor . The to ol has th e following fun ctions; a) f o candidates’ trajectory visualization with the salience of periodicity , b)musical no te disp la y , c ) wa veform display (lon g and short duration ), d)sou nd pressure le vel, e)sp ectrum, f)recordin g with calibr ation, and g)playb ack of working and reference recordin gs. Figure 1 shows a sn apshot of the GUI of the tool. 2 The left th ree panels are continuo usly scrolling to the left to show trajectories of the wav eform, f o candidates, and the periodicity salience (from top to bottom ). The top right panel shows the stabilized wa veform of several cycles o f th e f undamen tal period. The midd le right pan el sh ows sta ves with a treb le clef and a bass clef. W e introduc e d th is panel to he lp learners to be aware of voice pitch because sometimes learner has difficulty in finding what “hig h” or “low” pitch is. The re d circle re presents th e c o rrespond ing f o position. Each stav e has a nu mber at the right side. Th e instructor can use the red circ le and the number to advise learn ers. Just below the musical 2 The first author’ s GitHub repository[5] has the latest versi on of the accompan ying video, which introduces ho w to use this tool. panel, a green cir c le an d a number representing the freq uency of the best f o candidate ap pear when th e sign al perio dicity is salient. The small panel be twe e n th e scr o lling display and the musical display shows co rrespond ing no te n a m es. Th in horizon tal lines span these th ree pan els. Th ey represen t the chromatic scale. The rightmost bar gr a p h sho ws the calib rated sound pre ssur e lev el at the refer ence p osition (30 cm in fr ont of the lip center[6]) using C-weightin g[7]. Th e g reen b ar sh ows th e fast response, an d the ho rizontal red line shows the slow r e sponse. The bo ttom rig h t p anel shows spectral inform ation u sin g three lines. Th e three lin es are a)power sp ectrum (a gree n line), b)tem porally interfere n ce-free spectrum (a red line), and c)spectrum with o ut temporal and frequen cy interferences (a bold black line)[8]. Th e vertical axis represents the sound pressure level when calibrated. The bottom center bar pane l is a le vel ind icator in dB scale spanning f rom -100 dB to 0 dB, where 0 d B cor r esponds to the MSB (Most Significan t Bit, the maximum inp ut le vel). This indicato r has three cu r sors. The re d curso r r epresents the peak value, an d the blue cursor represen ts the RMS value. Finally , the green cursor represen ts the tempor a lly smooth ed RMS value. Th e user can calibrate this too l by using any stable test signals ( in cluding the learn er’ s sustained vo wel) an d a sound level meter together with this level indicator . Please refer[9], [6] for the r ecommend ed pro cedure and microp hone settings. This tool ha s ten pu sh buttons and a popup men u. They have the following fun ctions. “REC. ST AR T” button restarts the tool. T he “SA VE.W ORK” button writes th e conten ts of the input buf fer to a file provid ing a u nique n ame. Th e sa ved file is a W A VE form at with 44,100 Hz sampling frequen cy and 24 -bit resolution . The “STOP” button stop s the continuo us mon ito ring of th e inp ut. “PLA Y .WORK” button outputs the signal in th e audio in put buf fer . “PLA Y .REF” button outpu ts the sign al in the referen ce buffer . Th e “QUIT” button term inates the tool. “SET .WORK” button assign s the directory for wr itin g work files. “LO AD.REF” button r e a ds an aud io file a s th e re ference. “Cal.V oice” and “CAL. Ref ” buttons calibrate the microp hone in put level. Only ad equate buttons a r e active and highligh ted. The popup m e nu showing “7 0 dB” selects the c alibration sound pr essure lev el. Our GitHub re pository[5] has link s to videos showing how to calibra te this tool a n d several ope r ation examples. A. S upporting interactive tools In addition to this tool, we developed two supp o rting to o ls and applied previously de veloped tools[4]. Developed tools ar e a real- time phase-attr ibutes visualizer and a detailed interactive inspector . 1) Real-time phase-attributes visualizer: Figure 2 sh ows example visualizations of three p hase-related attributes. Fro m top to b o ttom, the panels show the ph ase map, the n ormalized instantaneou s frequ ency map , and the norm alized grou p delay map. Descriptions o f the com ponents in each panel are as fo llows. This d escription is f or the to p pane l. The top left panel Fig. 2. Snapshots of a real-time phase-attri bute s visualizer . shows the pseu do co lor imag e o f th e p hase o f the analy sis results in the mid d le. The lin e p lo t above th e im age shows the time-aligned inp ut wav eform ba sed on the phase of the fundam ental compo nent. The cyan line in th e right plot indicates the fun d amental c o mponen t. The rightmost line plot shows the RMS ( root m ean squ ared) average of each outp ut. The top rig ht co rner d isplays th e frequ e ncy of th e be st f o candidate an d the c losest mu sical note name with a tunin g display (The black center line shows the target note for the Fig. 3. Snapshot of the “Experimen tal” mode of a real-t ime phase-attri bute s visuali zer . Fig. 4. GUI of an interact i ve detai led inspector . green line pitch m onitor). The main image of this pa nel shows the pseudoco lor r epresentation of th e p hase value itself. W e u se the color map which yields cyclic impre ssion because phase has a circular topolog y . The seco nd panel shows the relative outp u t instan taneous frequen cy no rmalized by the center frequ e ncy . Th e relative instantaneou s frequen cy display h as a rainbow-colored horizon tal bar which corre sponds to the fun damental compon ent. The bo ttom panel shows the relativ e o u tput group d elay normalized by the nomin al p eriod o f each filter response. The relativ e gr oup d elay d isplays ha ve (gen tly bend ing) rainbow-colored vertical bars which correspo nd to the GCIs (Glottal Closur e I nstances). Figure 3 shows th e “Exp erimental” mod e, which allows an extended parameter setting. 2) Detailed inter active inspector: Figure 4 shows a snapshot of the d etailed inspector . T he a nalyzed file is the contents of the real- time too l of th e session shown in th e accompanyin g vid eo. The top pane l shows the waveform Fig. 5. GUI of a voic e production simulator in the pre vious tools[4]. for about 4 .5 seconds. The midd le pan el shows the f o candidates tra jec tories. The thickness and the dark ness o f each trajectory represent salien c e of the period icity . The bottom panel represen ts periodicity salience. It uses the estimated SNR for the salience. The user can interactively check details by “zoom in, ” “zo om out, ” and “pa nning” in each pa nel. 3) SparkNG: pre vious to ols: Figure 5 shows the sn a pshot of the GUI of a voice produc tion simulator in ou r p revious tools[4]. The too l p rovides inte r activ e man ip ulation of voicing attributes and provide resu lts by synthesizin g voiced sou n ds. The attributes are the vocal tract area function , the fir st fi ve formant frequen c ie s and bandwidths, vocal tract len gth, and the sh ape parameters of the glottal source wav eform. The results o f par a meter m odifications directly ch ange the synthesized sound s an d e nabling users to acqu ire intricate relations between various voicing attributes. I I I . C O N C L U S I O N S W e introd uced r eal-time and interactive too ls for assisting vocal tra ining. Th e tools are implem e n ted using MA T L AB and open -sourced . The intro d uced tools and th e o ther a ssistive tools, Spark NG are a vailable in the first au thor’ s GitHub repository [5 ]. I V . A C K N OW L E D G E M E N T S This research w as supported b y KAKEN H I (Gra nt in Aid for Scientific Research by JSPS) 1 6H0173 4, 15 H03207 , 18K001 47, and 1 9K2161 8. R E F E R E N C E S [1] E . Haneishi, “Effec ts of a music therapy voice protocol on speech intel ligibil ity , vocal acoustic measures, and mood of individ uals with parkinson’ s disease, ” J ournal of music therapy , vol. 38, no. 4, pp. 273–290, 2001. [2] I. R. Titz e, R. J. Baken, K. W . Bozeman, S. Granqvist, N. Henrich, C. T . Herbst, D. M. Howar d, E. J. Hunter , D. Kaelin, R. D. Kent, J. Kreiman, M. Ko b, A. L ¨ ofqvist, S. McCoy , D. G. Miller , H. No ´ e, R. C. Scherer , J. R. Sm ith, B. H. Story , J. G. ˇ Svec , S. T ernstr ¨ om, and J. W olfe, “T ow ard a consensus on s ymbolic notati on of harmonics, resonances, and formants in voc aliza tion, ” The Journa l of the Acoustical Society of America , vol. 137, no. 5, pp. 3005–3007, 2015. [3] H. Kawahara , K.-I. Sakakibara, M. Morise, H. Banno, T . T oda, and T . Irino, “A new cosine series antial iasing functio n and its applicati on to aliasing -free glottal source m odels for speech and singing synthesis, ” in Pr oc. Interspeec h 2017 , Stocholm, August 2017, pp. 1358–1362. [4] H. K awahara , “SparkNG: Interacti ve MA TLAB tools for introducti on to speech production, percept ion and processing fundament als and applic ation of the aliasing-fre e L-F m odel component , ” in Interspeec h 2016 , 2016, pp. 1180–1181. [5] ——, “GitHub projects of H ideki Kaw ahara, ” GitHub, (Last access: 2019-04-26). [Online]. A vai lable: https:// github .com/HidekiKaw ahara [6] R. R. Patel, S. N. A wan, J . Barkmeier-Kra emer , M. Courey , D. Deliyski, T . Eadie, D. Paul, J. G. ˇ Svec , and R. Hillman, “Recommended protocol s for instru mental assessment of voi ce: Americ an speech-lang uage-hea ring associat ion e xpert panel to dev elop a protocol for instrumental assessment of voca l function, ” American Journal of Speec h-Langua ge P athology , vol. 27, no. 3, pp. 887–905, 2018. [7] International Electrotec hnical Commission, “Electroaco ustics: sound le ve l meters–P art 1: Specificat ion (IEC 61672-1:2013 ), ” Gene v a, Switzerl and, 2013, tC 29. [8] H. Kawahara , M. M. , and K. Hua, “R e visitin g spectral en vel ope recove ry from speech sounds generated by periodic exci tation , ” in APSIP A ASC 2018, Hawaii , 2018, pp. 1674–1683. [9] J . G. ˇ Svec and S. Granqvi st, “Guideline s for selecti ng microphones for human voice prod uction researc h, ” American J ournal of Speec h-Langua ge P athology , vol. 19, no. 4, pp. 356–368, 2010. [10] J. L. Flanagan and R. M. Golden, “Phase V ocoder, ” Bell System T ec hnical Journal , vol. 45, no. 9, pp. 1493–1509, Nov 1966. [11] Intel, “V ector Mathemat ics (VM): Performance and Accuracy Data, ” 2018, (Access date : 2018-10-12) . [Online]. A vaila ble: https:/ /softwa re.intel.com/sites/products/documentation/ [12] F . J. Harris, “On the use of windo ws for harmonic analysis with the discrete Fourier transform, ” P r ocee dings of the IE EE , vol. 66, no. 1, pp. 51–83, 1978. [13] J. Kaiser and R. W . Schafer , “On the use of the I 0 -sinh window for s pectrum analysis, ” IEEE T rans. Acoustics, Speech and Signal Pr ocessing , vol. 28, no. 1, pp. 105–107, 1980. [14] A. H. Nuttall , “Some windows with very good sidelobe behavi or, ” IEEE T rans. Audio Speec h and Signal Pro cessing , vol. 29, no. 1, pp. 84–91, 1981. A P P E N D I X A. R e al-time f o candida tes extractor This appen d ix briefly describes the procedur es u sed to implement the p roposed tools. 1) Simplified implementation of pha se-r elated attributes: Flanagan introd uced an equ a tion to calculate the instan taneous frequen cy , which does not rely on phase unwrap ping[10 ]. Recent advances in multimed ia proc essing made CPU have efficient instructio ns for calculating related function s ( for example[11]). These modern CPUs calculates the fo llowing discrete implementatio n of instan taneous frequ ency ω i [ n ] and grou p delay τ g [ k ] efficiently . ω i [ n ] = ∠ x [ n + 1] x [ n ] f s , (1) τ g [ k ] = − 1 ∆ ω ∠ X [ k + 1] X [ k ] , (2) where x [ n ] represents an an alytic discrete-time signal, an d k represents the d iscr ete frequ ency . 2) Analytic sign al with the six-term cosine series envelope: Filtering an inp u t signal u sing a filter having an an alytic signal impulse respon se yields an analy tic signal outp ut. Multiplying a time windowing functio n and a car r ier com p lex exponential function makes such analy tic signa l. W e fo u nd that common ly used time windowing fun ctions[12 ], [13], [ 14] are not relevant for calculatin g ph ase-related attributes[3]. T he 0 10 20 30 40 50 60 70 80 input SNR (dB) 0 10 20 30 40 50 60 70 80 estimated SNR (dB) fo:120 mag:1.05 dsOn:0 sixterm hanning hamming blackman nuttall12 kaiser PSWF Fig. 6. Estimated SNR for each en velo pe function s. The stretch ing factor is c mag = 1 . 05 . following functio n w e ( t ; f c , c mag ) provid e s practica lly the best results. w e ( t ; f c , c mag ) = K X k =0 a k cos 2 π k f c t K c mag , (3) where c mag represents a tu ning p arameter which determ ines the relatio n between the bandwid th and the carr ier freq uency f c . W e u sed the f ollowing cosin e series with K = 5 . Th e optimized coefficients are the f o llowing. { a k } 5 k =0 = { 0 . 26247 10164 , 0 . 4265335164 , 0 . 2250165621 , 0 . 0726 83163 3 , 0 . 0125124215 , 0 . 0 007833203 } (4) The following equ ation provides the d esired impulse r esponse. w ( t ) = w e ( t ; f c , c mag ) exp ( j 2 π f c t ) where j = √ − 1 , (5) 3) SNR estimation : When the dominant compo nent is a stable sinusoid located in the p ass-band of a filter, the instantaneou s freq uency of the filter output is tempora lly constant. The gro up delay calculated using adjace n t chann el outputs is also temporally constant. Mixin g tem poral variations of the instantaneo us f requency and th e g roup delay p rovides the estimate of the SNR of the filter outpu t. Figure 6 shows the relation b e twe en the given SNR and th e estimated SNR u sing comm only u sed windowing fu nctions and the p roposed six-term cosine series. The p roposed en velope y ields accura te e stima te s from 1 0 dB to 80 dB SNR. This SNR estimation executes abo ut 300 times faster than real-time for a sing le filter output fo r 44,10 0 Hz sampled signals. T his speed test used MA TLAB imp lementation on MacBook Pro (2 019 1 3” 2.7 GH z Intel Corei7, with 16 GB memory ). 4) Extractor of f o candida tes: W e placed six SNR estimators for ea c h octave covering from 80 Hz to 5 kHz. The initial can d idates are dete c ted a s fixed p oints fro m th e filter ce n ter freq uency to the o utput instantaneo us f requency . The extracto r selects th e in itial fou r candidates based o n th e SNR. T hese are the c a ndidates display ed in the pro posed tools.
Original Paper
Loading high-quality paper...
Comments & Academic Discussion
Loading comments...
Leave a Comment