ODE network model for nonlinear and complex agricultural nutrient solution system
In closed hydroponic systems, periodic readjustment of nutrient solution is necessary to continuously provide stable environment to plant roots because the interaction between plant and nutrient solution changes the rate of ions in it. The traditiona…
Authors: ** - Byunghyun Ban* (안동시청, 고용노동부, 안동
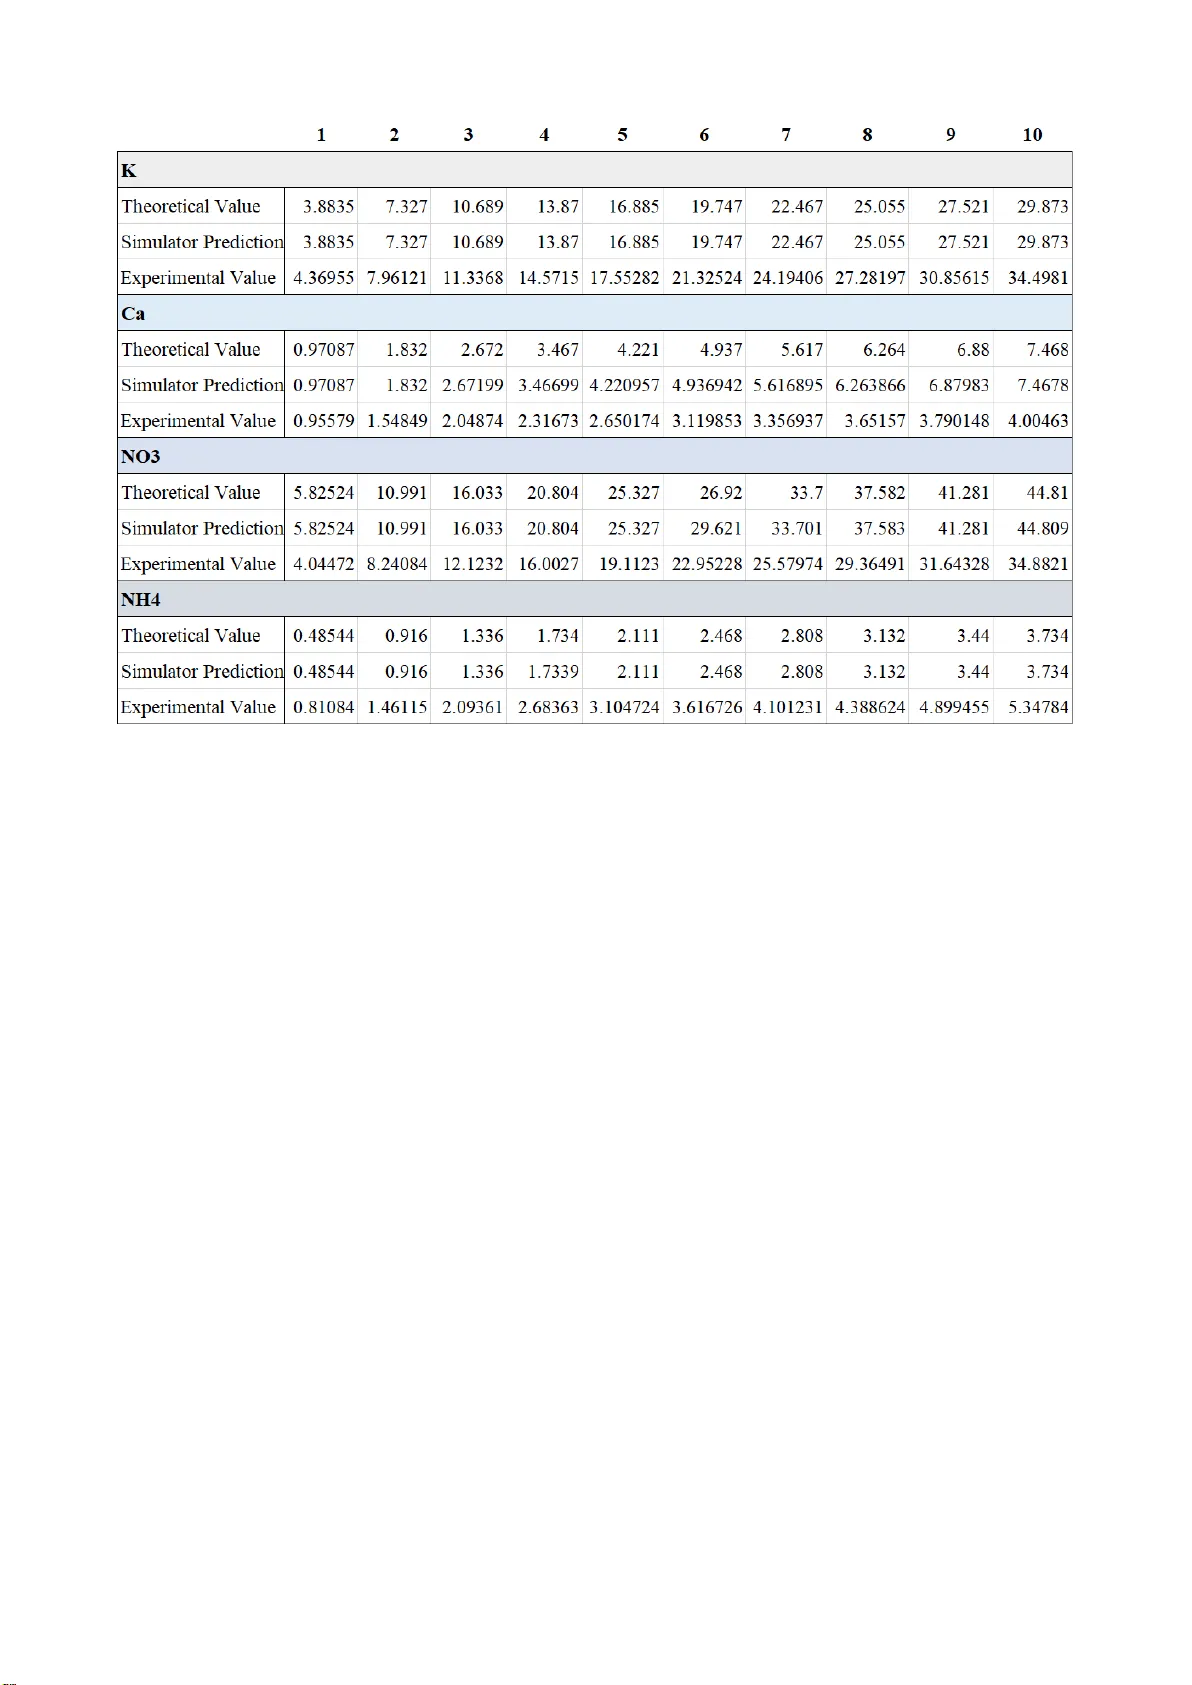
ODE Network Model for Nonlinear and Complex Agricultural Nutrient Solution System Byunghyun Ban * Andong District Office Ministry of Employment and Labor Andong, Republic of Korea bhban@kaist.ac.kr Minwoo Lee Future Agriculture Team Imagination Garden Inc. Andong, Republic of Korea hydrominus@sangsang.farm Donghun Ryu Machine Learning Team Imagination Garden Inc. Andong, Republic of Korea dhryu@sangsang.farm Abstract — In closed hydroponic systems, periodic readjustment of nutrient solution is n ecessary to continuously provide stable environment to plant roots because the interaction between plant and nutrient solution changes the rate of ions in it. The traditional m et hod is to repeat supplying small amount of premade concentrated nutrient solution, mea suring total electric co nductivity and pH of t he tank only. As it c annot control the collapse of ion rates, recent researches try to measure the concentration of individual components to provide insufficient io ns only. How ever, those approaches use titr ation- like heuristic approaches, which repeat adding sma ll a mount of components and me asuring ion d ensity a lot of tim es for a single control input. B oth traditional and recent methods are not only time-consuming, but also c annot pre dict chemical re actions related with control inputs because the nutrient s olution is a nonlinear co mplex system, incl uding many precipitation reactions and complicated interactions. We present a continuous n etwork m odel of th e nu trient solution syste m, whose rea ctions are described as d ifferential equations. The model predicts molar concentration of each che mical components and tot al dissolv ed solids w ith low error. This model also c an calculate the amount of che mica l compounds needed to produce a desired nutrient solution, by reverse calculation from dissolved ion concentrations. Keywords — nutrient solution, smart far m, system eng ineering, computational chemistry, simulation, complex system , IoT I. I NTRODUCTI ON Recently, so illess c ulture take s center stage in a gricultural industry. Clo sed hydropo nic s ystem is o ne of the most popular hydroponic method b ecause it reduce s the cost and hazard of water p ollution [1] . As p lants continuousl y ab sorb nutrients from the e nvironment, the concentration of individual ions conti nuously drop s. Traditional methods usually measure p H and elect rical conductivity (EC) of t he nutrient solu tion to m onitor the f ertilizatio n stat us [ 2 -3]. When EC is lo w, they add premade co ncentrated s olutio n to the tank and then app ly acids to maintain pH. As t he ab sorption rate s of the ions are a ll d ifferent, those approaches gradually destro y the ratio among ions [4] and accumulates exce ssive ions (sodium , c hloride, sulfate and etc.) [ 5-6] w hich have low ab sorption rates or are supplied too much. Many researchers recently have suggested to measure indi vidual io n with ion -selective se nsors a nd t o provide in sufficient ions onl y [1, 7 -9]. H owever, their control methods are slow and can not avoid Na+ accu mulatio n problem caused by Fe -EDTA suppl y. Nutrient solution is a co mplex system. I t is a bi -directe d network model, whose nodes are chemical components and edges are reactions. It is difficult to figure out the exact state, and so me input can ca use une xpected results because almost all the ve sicles have self-feedback structures or b i-directed interactions. And many reactions lead to undesired o utput nodes such as sediment or unabsorbab le ions. Fo r example, supplying additional chemicals do es not just raise ion concentrations directl y. The components in the n utrient solution m ake various reactions suc h as sedimentatio ns or reductions, p roducing compo unds which pla nt do es not absorb. As researchers does no t know what is happ ening i n the nutrient s olution system exactly, th ey proposed so me models to predict salt ac cumulation [6] or ion rates [4]. Boolean network model and ordinar y differential equation (ODE) m odel are freque ntly applied to describe complex system. Boolean syste m describe s value of the co mponents as true or false binary. So construction of large-scale n etwor k model such as cancer cell m odel [10- 13] is a novel and useful approach. ODE network describes interaction bet ween components as ordinary differential equations, which usually have ti me t as independent var iable [14 -16]. I t requires huge computing p ower, a nd it is d ifficult to b uild di fferential equations for the whole network. ODE model can describe continuous system w hile Boolean model can describe discrete phenomena onl y. Apply ing Boolean netw ork on nutrient system modeling can only sho w existence of a component as tr ue or false value but ODE networ k can describe continuous chan ges of concentrations of io ns and sedimentation reactions. Chemical reactions are time-dependent continuous proce ss so the y can be modeled as o rdinary di fferential equation s, whose independent variable is the ti me. For exa mple, a sedimentation reaction in th e nutrient solution is described as equation (1). The coefficients k 1 and k 2 are reaction rate coefficients which shows ho w fast the reaction is. If one component appears on the left side of various differential equations, they can be superpositioned as single equation. As a chemi cal reaction influe nces ever y component e xcept catalyst, chemical reactio n network has a lot of self-feedbacks. If a che mical prod uces more same ions at the same time, we multipli ed the number of ion s on the reaction rate coefficie nt like equat ion (2) describin g Ca(NO 3 ) 2 dissociation, in ter ms of NO 3. Although t he topo logy of c hemical s ystem net work i s easily driven from known reaction sets, the reaction rate coefficient is not. It is measured by experiments [17]. The coefficient of each equatio n defines response of the system because kinetic parameters define th e activity of the equation. However, precise literature values for those che mical processes in n utrient solution system ar e m issin g. Parameter estimation algorithms for complex network systems have been proposed in systems biology field [18 -20] but they require experimental data. I t is not fea sible to measure the amount of all the chemical c ompounds in nutrient solut ion along time adding input, because n ot all kinds of ion selective electrodes (ISEs) and sediments are not measurable with commercially available se nsors, while not affecting any chemical environments such as pH o r temperatures. We pr esent a co mprehensive and persuasive ne twork model for nutrien t solution system whose parameters are driven fro m literature values . The kinetic par ameter s are based on eq uilibrium constants . T his model can simulate bo th forward and r everse r eaction at the same ti me, and even can perform time -reverse simulati on. Simulation with this mode l is easily perform without GP U devices. We can pred ict the ionic co mposition and the amount o f sediments by dissolution simulation of fertilization materials. Even calculation of the amount of each n utrient powder from ionic so lution state is p ossible with reverse-direc tion simulation. As it is a white -bo x model, it can also trace th e accumulation of Na + or other unabsorbable ions in closed hydroponic s ystem. Read justment met hod for nutrient solution should also be changed because the model can show the amount of required materials. Pouring a shot of chemicals into the tank is enough, rather than traditional m ethods which take several minutes for single step of control input. II. M ETHOD S A. Network Topolog y Design We established nutrient solution syste m with Ya mazaki’s solution for Lactuca Sa tiva L. [21] , which includes N, P, K families and microelements in highly-plant -absorbable ion state. Althoug h the i ndustrial recip es reco mmend hydrates [22], there are too many p ossible numbers of w ater m olecules per formula unit for one salt, and eve n incomplete sealin g increases it durin g storage in f ields. So we chose dehydrated chemical co mpounds in ord er to build a standard model for nutrient solutions. The selected standard che micals, the ir ionized forms and the prod ucts w hich are produced by reactions among the ions which ar e involved the exper iment of the experi ments ar e provided on S1 in the supple mentary infor mation sectio n. They are all enlisted on the s ystem network. We also ad ded water, hydrogen io n, hydroxyl io n, nitric acid for pH adjustment and UV light which disintegrates Fe -EDT A - io n to make the model more co mprehensive. The interaction a mong nodes are simply classified into 3 classes: enhancement, suppression, not-interactive. Fig 1 is visualized network topo logy with Cytoscape [23]. Dissolution of s ystem input is regarded as irr eversible processes because nutrie nt solution is t hin enough and Fig. 1. Nutrient Solution System Netw ork Model. external plant interference wh ich reduces concentrations of plant- ab sorbable ions i s applied in real world. B. Network Dyn amics Design Reaction rate coefficie nts ar e driven fro m eq uilibriu m constants by the relatio n . Equilibrium con stant is a description of a state of co nvergence so if we manipula te the value of k f and k b while fixing their ratio n as K, the reaction converges within the same status if time stride is not too big. Therefore, if we let and , th e differential equatio n converges app ropriately b ecause thei r rate is still K, but the required t ime to m ake convergence only differs. It also can d escribe ionization and its reverse process, which are not actuall y chemical reactio ns. We us ed dissociation constant K d , w hich explai ns a reversible process in which big com ponents breaks down into smaller com ponents, to explain liquid state input such a s nitric acid. For example, the eq uilibrium state o f a r eversible dissociation process is described as equation (3). K d is directly obtain by gathering literature value of acid dissociation constant K a . The solubility product equilibrium constant K sp is adopted for dissolution of solids because it describes the d ynamic equilibr ium bet ween solid and ion state. Solubility pr oduct equilibrium co nstant for dissolution is defined as equation (4), which is easily calculated with solubility. Although simple ap plication o f k f and k b driven above ca n predict converged state of the system, it i s not enough to describe sy stem states before convergence. T herefore, w e multiplied co rrection co efficient, which is a positive number between 1 and 100 0, to correct the speed o f forward and backward reactions. For examp le, dissociation of HNO 3 into H + and NO 3 - is ver y fast but dissol ution of NaFe -EDT A into Na + and Fe-EDT A - is relatively slow. So we multiplied 1000 to both k f and k b for nitric acid d issolution process and multiplied 1 to those of ferric EDTA. Literature values o f K a , solubilit y for all reac tions and calculated equilibriu m constants involved in the experi ments are provided on S2 in th e supplementary information s ection . The differential equations, their reaction rate coefficients and correction coefficients used to perfor m simulatio ns are listed in Table S3 on the supplementary information sectio n. III. A LGORITHM The s ystem needs initial state infor mation. As the kinetics are time-dependent, t he model is an ord inary differential equation model. An ODE model updates its next -step status by applying current -state information. Let [X i ] the concentration o f i-th node variab le of the network. It is a time - dependent variable. In other word, [X i ] is a function of time. ODE for [X i ] is equation ( 5), where q is total number of terms in superpo sitioned eq uation for [X i ]. Coefficient c means t he number of X i in the term. Update for [X i ] along ti me i s performed with gradie nt - descent-like method as equa tion (6, where is the time interval. If the time interval i s to o small, the system conver ges too slowly but if it is too b ig, the s ystem may not conver ge. We applied synchronous upda te method, which upd ate all [X](t) values from all [X](t-1), because chemical reactions in one solutio n o ccurs simultan eously. We defined X(t) as a vector of concentratio n of the nodes and sim ply calculate d to o btain gradient vector. S ynchronous update with vector-form is described in equation ( 7 ). We built a che mical complex system solver with P ython language. This simulato r receives a text file contai ning differential equa tions of chemical reactions a nd rea ction rate coefficient and automatically p erforms s uperposition for overlapped variables. T he chemical topology is driven du ring text parsi ng process. It al so performs bo th for ward and backward simulatio ns. We also wrote a text file which contains the top ological a nd kinetic infor mation of nutrien t solution model. Both c hemical co mplex system solver and nutrient syste m model information file are pro vided as an open sourced python package at the authors’ Github repository: https://github.com/needleworm/nutri ent_sol ution. IV. E XPER IMENT To examine the performance o f the simulator, w e perform ed experim ent o n Yamazaki’s nutrient solution. As ISEs have error in complex chem ical system d ue to the ion interfer ence p henom enon, traditional methods to s electively readjust individu al ions are not feasi ble. We com pared I SE- observed ion co ncent ration with the model’s prediction , as well as th e lite racy value. A. Eq uipments Vernier’s Go Dir ect ® ISE se ries, GD X-NO3, GDX-NH 4, GDX -CA, GDX-K, are used to measure the concentr ation of ions. KNO 3 , Ca(NO3 ) 2 - 4H 2 O, NH 4 H 2 PO 4 , MgSO 4 - 7H 2 O are used to produce Yamazaki’s nutrient solut ion for lettu ce. The simu lation w as perform ed on Intel’s I7 -6850K with P ython 3.6. 10 different sett ings of s imulations were done at the sam e time as the CPU has 12 thre ad. Total simu lation was do ne in less than 1 minu te. B. In - situ Conecntration Measurement We prepared 100 times more concentrate d version of Yamazaki’ s nutrient sol ution for lettuce. I t consiste d of 0.4M of KNO 3 , 0.1M of Ca(N O 3 ) 2 and 0 .05M of NH 4 H 2 PO 4 . Chem ical compounds wh ich are n eeded fo r oth er ions of Yamazaki’ s nutrient solution were omitted in o rder to avoid any ions w hich are unmeasu rable w ith our ISE devic es. By adding the concent rated s olution on 1L w ater, we gradually increased the ionic concentrati on. Total 10 steps of addition was conducted and th eoretical value f or individual ions at ea ch experim ental ste p are p rovided on Table 1. C. Simulation The network model simulator was designed to receive various parameters: na mes of co mponents, initial concentration, io nic state, reaction rate coefficient and the stirring velocit y o f water. W e set the init ial co ncentration values of KNO 3 , Ca(NO 3 ) 2 and NH 4 H 2 PO 4 as the same value from wet experi ment’s. And we set the initial value o f any other co mponents excep t H 2 O, H + and OH - into 0 in order to make the simulation and experi mental conditio n be same. The time step dt was set to 1 e-8 second to avoid step- update related issue. Althoug h the con centrati on doesn’t show divergenc e, som e io ns with low concentration sometim es converge d into w rong value wh en dt was set to 1 e-4 sec ond. The auth o rs re comm end using smaller tim e step for each update. Each simulation was terminate d after 2.5 milli on updates, which t ook less than 50 secon ds. V. R ESULT The results from i n-situ conc entration measurement and simulation are provided on Table 1. The valu es are in m ol per milliliter scale. The simu lator predicted theoretical value almost exactly . Ho wever, all the experim ental value sh owed sig nifi cant e rror. The error becomes gr eater at h igher-concent ration c ondition . VI. C ONCLUSION Ex periment showed that ion interference ef fect makes ISE value unclear. The er rors of experimental values ar e not related to calibration or sensor malfunction because the ISE were calibrated with single -ion state solutions, whose concentration is exactly same as the solutions used for wet experiment. As interfering ions disturb Ner nst potential on the membrane of I SE, any glass-based sensory device has io n in terference issue. Therefore, app lying ISEs on industrial condition to maintain nutrie nt solution is not feasible. However, the network model provided in this paper has no prediction err or even the prediction was gradient -desce nt based approach rather than cal culation of d issociatio nal value of che mical co mponents d irectly. Applying complex s ystem modeling would help removal of limitation o f ISE app roach and provide more precise stat us of nutrient sol ution system. A CKNOWL EDGMENT The authors w ould like to express our gratitude to Janghun Lee f o r developmen t of ISE data a cquisition sof tware for sensory experiment. Table 1. Experi ment Results. ( mol / mL) S UPPL EMENTA RY I NFORMAT IO NS S1. Equati ons for simulation ( 1) (2) (3) ( 4) ( 5) ( 6) (7) (8) (9) (10) ( 11) ( 12) (13) (14) ( 15) ( 16 ) ( 17) ( 18 ) (1 9) (20) ( 21) ( 22) (2 3) (24) (25) (2 6) (27) (28) (2 9) (3 0) S2. K sp and K a (1) at p H 7 (2) (3) (4) (5) , K a = 0.0070 7946 [25] (6) , K a = 8.1283e -08 [25] (7) , K a = 4.7863e -13 [25] (8) (9) (10) S3. k f and k b Coefficien t Value Coefficien t Value k 0 1e - 20 k 1 1e -6 k 2 976.88 70716 k 3 0 k 4 161.18 97361 k 5 0 k 6 105.72 03812 k 7 0 k 8 0.725 k 9 100 k 10 6.31e- 6 k 11 100 k 12 3.98e- 13 k 13 100 k 14 1e -5 k 15 100 k 16 1.2e- 16 k 17 100 k 18 0.5913 61 k 19 100 Table S 1. k f and k b values f or sim ulation R EFERENCES [1] Cho W J, Kim H J, Jung D H, K im D W , Ahn T I, S on J E. On-site io n monitoring system for precision h ydropon ic nutrient manageme nt. Comput Electron A GR. 2018; 146: 51-58. https://doi.org /10.1016/j.compag.2 018.01.019 . [2] Bamsey M, Graham T, Tho mpson C, Berinstain A, Scott A, Dixo n M. Ion-specific nutrient management i n c losed systems: the n ecessity for ion-selective sensors in terre strial and space-based agri culture and water manage ment systmes. Senso rs. 2012; 12(10): 13349-13392. https://doi.org /10.3390/s1210133 49 . [3] Katsoulas N, Savvas D, Kitta E, Bartzanas T, Kittas C. Extension and evaluation of a model for automatic drainage solution management in tomato crops grow n in semi-closed hydroponic sy stems. Comput Electron AG R. 2015; 113: 61-71. https://doi.org /10.1016/j.compag.2 015.01.014 . [4] Ahn T I , Shin J W, Son J E, Analy sis of Changes in I on Concentration with Time and Drainage Ratio under EC-based Nutrie nt Control in Closed-loo p Soilless Culture for Sweet Pepper Plants (Caspsicum Annum L. ‘Bo ogie’). J Bio -Environ C ontrol. 2010; 19: 298-304. [5] Neocle ous D, Savvas D. NaCl accumulation and macroutrient up take by a melon crop in a closed hydropo nic system in relation to water uptake. Ag ric Water Manag. 2015; 165: 22-32. https://doi.org /10.1016/j.agw at.2015.11.013 . [6] Neocleous D, Savvas D. Simul ating NaCl accumulation in a closed hydroponic cro p of zucch ini: Impact on macronutrient uptake, gro wth, ield, and photosy nthesis. J Plant Nu tr Soil SC. 201 7; 180(3): 283-293. https://doi.org /10.1002/jpln.201 600338 . [7] Kim H J, Son D W , Kwon S G, Roh M Y, Kang C I, Jung H S . PVC membrane-base d portable ion analyzer for hydroponic and w ater monitoring. Comp ut Electron Ag ric. 2017; 140: 37 4 -385. https://doi.org /10.1016/j.compag.2 017.06.015 . [8] Ryan S Knight, Mark Lefsrud. Auto mated Nutrie nt Sensing and Recycl ing. 2017 ASA BE Annual International M eeting. 2017; 1701609. ht tps://doi.org/10.1 3031/aim.201701609 . [9] Jung D H, Kim H J, Kim W K, Kang C I, Choi G L. Automate d Sensing and Control of Hydroponic Macronutrients Using a Computer- controlle d System. ASABE. 2013 ; 131594020. https://doi.org /10.13031/aim.2013 1594020 . [10] Choi M , Shi J, Zhu Y, Yang R, Cho K H. Network dynamics -based cancer panel stratification for systemic prediction of anticance r drug response. Nat Comm un. 2017; 8: 1940. https://doi.org /10.1038/s41467-017-0216 0-5 [11] Choo S M , Ban B , Joo J I, Cho K H. The phenotype control kernel of a biomole cular regulatory netw ork. BMC Syst Biol. 2018; 12-49. https://doi.org /10.1186/s12918-018-0576-8 [12] Kim Y, Choi S, Shin D, Cho K H. Quantitative evaluation and reversion analysis of the att ractor landscapes of an intracellular regulatory network for colo rectal cancer. BMC sy st boil. 2017; 11-45. https://doi.org /10.1186/s12918-017-0424-2 [13] Fumia H F, Martins M L. Bool ean Networ k Model for Cancer Pathways: Predicting Carcinogenesis and T argeted Therapy Outcomes. PLoS O ne. 2013; 8(7). https://doi.org /10.1371/journal.pone. 0069008 [14] Ban B, Kim S. Control of nonlinear, comple x and b lack-boxed greenhouse system w ith reinforceme nt learning. 2 017 ICT C; 2017 Oct 18 -20; Jej u, South Kore a; IEEE, 2017. https://doi.org /10.1109/ICT C.2017.8190813 . [15] Xu A M, Huang P H. Receptor T yrosine K inase Coact ivation Ne twork in Cancer. Cancer Res. 2010; 70( 10): 3857-3860. https://doi.org /10.1158/0008-5472.CA N- 10 -0163 . [16] Grieco L, Calzone L, Bernard-Pierrot I , R advanyi F, Kahn-Perles B, Thieffry D. Integrative Modeling of t he Influence of MAPK Network on Cancer Cell Fate Decision. PLoS Comput Biol. 2 013; 9(11): e1003286. https://do i.org/10.1371/jo urnal.pcbi.1003 286 . [17] Smith M C, Chao W, Kumar M, Francisco J S, Takahashi K, Lin J J. Temper ature-Depentent Rate Coeff icients for Reaction of CH2OO with Hydro gen Sulfide. J Phys Chem. 2017; 121 (5): 938 -845. https://doi.org /10.1021/acs.jpca.6b 12303 . [18] Raue A , Schilling M , Bac hmann J , Matteson A , S chelker M, K ashche k D, et al. Le ssons learnd fro m quantitativ e dynamical modeling i n systems biol ogy. PLoS One . 2013; 8: e74335. [19] https://doi.org/10.137 1/journal.pone.0074 335 . [20] Frohlich F, Kessler T, Weindl D, Sha drin A, Schmiester L, Hache H, et al. Efficient Parameter Estimation Enables the Prediction of Drug Response Using a Mechanistic Pan-Cancer Pa thway Model . Cell Syst. 2018; 7(6): 5 67-579. https://doi.org /10.1016/j.cels.20 18.10.013 . [21] Yamazaki K. Nutrient solution culture. Tokyo, Japan: Pak -ky o Co; 1982. Japane se. [22] Gao H, Mao H, Zhang X. Deter mination of lettuce nitrogen content using sp ectroscopy with efficient wav elength selection and extreme learning mac hine. Zemdirbyste . 2015; 102(1): 5 1 -58. https://doi.org /10.13080/z-a.2015.102 .006 . [23] Shannon P, Markei A, Ozier O, Baliga N S, Wang J T, Ramage D, et al. Cytoscape: a software environment for integrated models of biomolecular interaction networks. Genome Res. 2003; 13(11): 2498- 2504. https://doi.or g/10.1101/gr.1239 303 [24] Lide, David R. C RC handbook of chemistry and physics: a ready- reference book of chemical an d physical data . CRC press, 19 95. [25] O'Neil, M.J. (ed.). The Merck Index - An Encyclopedia of Chemicals, Drugs, and Biolo gicals. Whitehouse S tation, NJ: Merck an d Co., Inc. ,2006., p. 1 266 [26] Lide, D.R. (ed). CRC Handbook of Chemistry and Phy sics. 72nd ed. Boca Raton, FL : CRC Press, 1991-1992., p. 4- 49
Original Paper
Loading high-quality paper...
Comments & Academic Discussion
Loading comments...
Leave a Comment