A Neural Approach to Ordinal Regression for the Preventive Assessment of Developmental Dyslexia
Developmental Dyslexia (DD) is a learning disability related to the acquisition of reading skills that affects about 5% of the population. DD can have an enormous impact on the intellectual and personal development of affected children, so early dete…
Authors: F.J. Martinez-Murcia, A. Ortiz, Marco A. Formoso
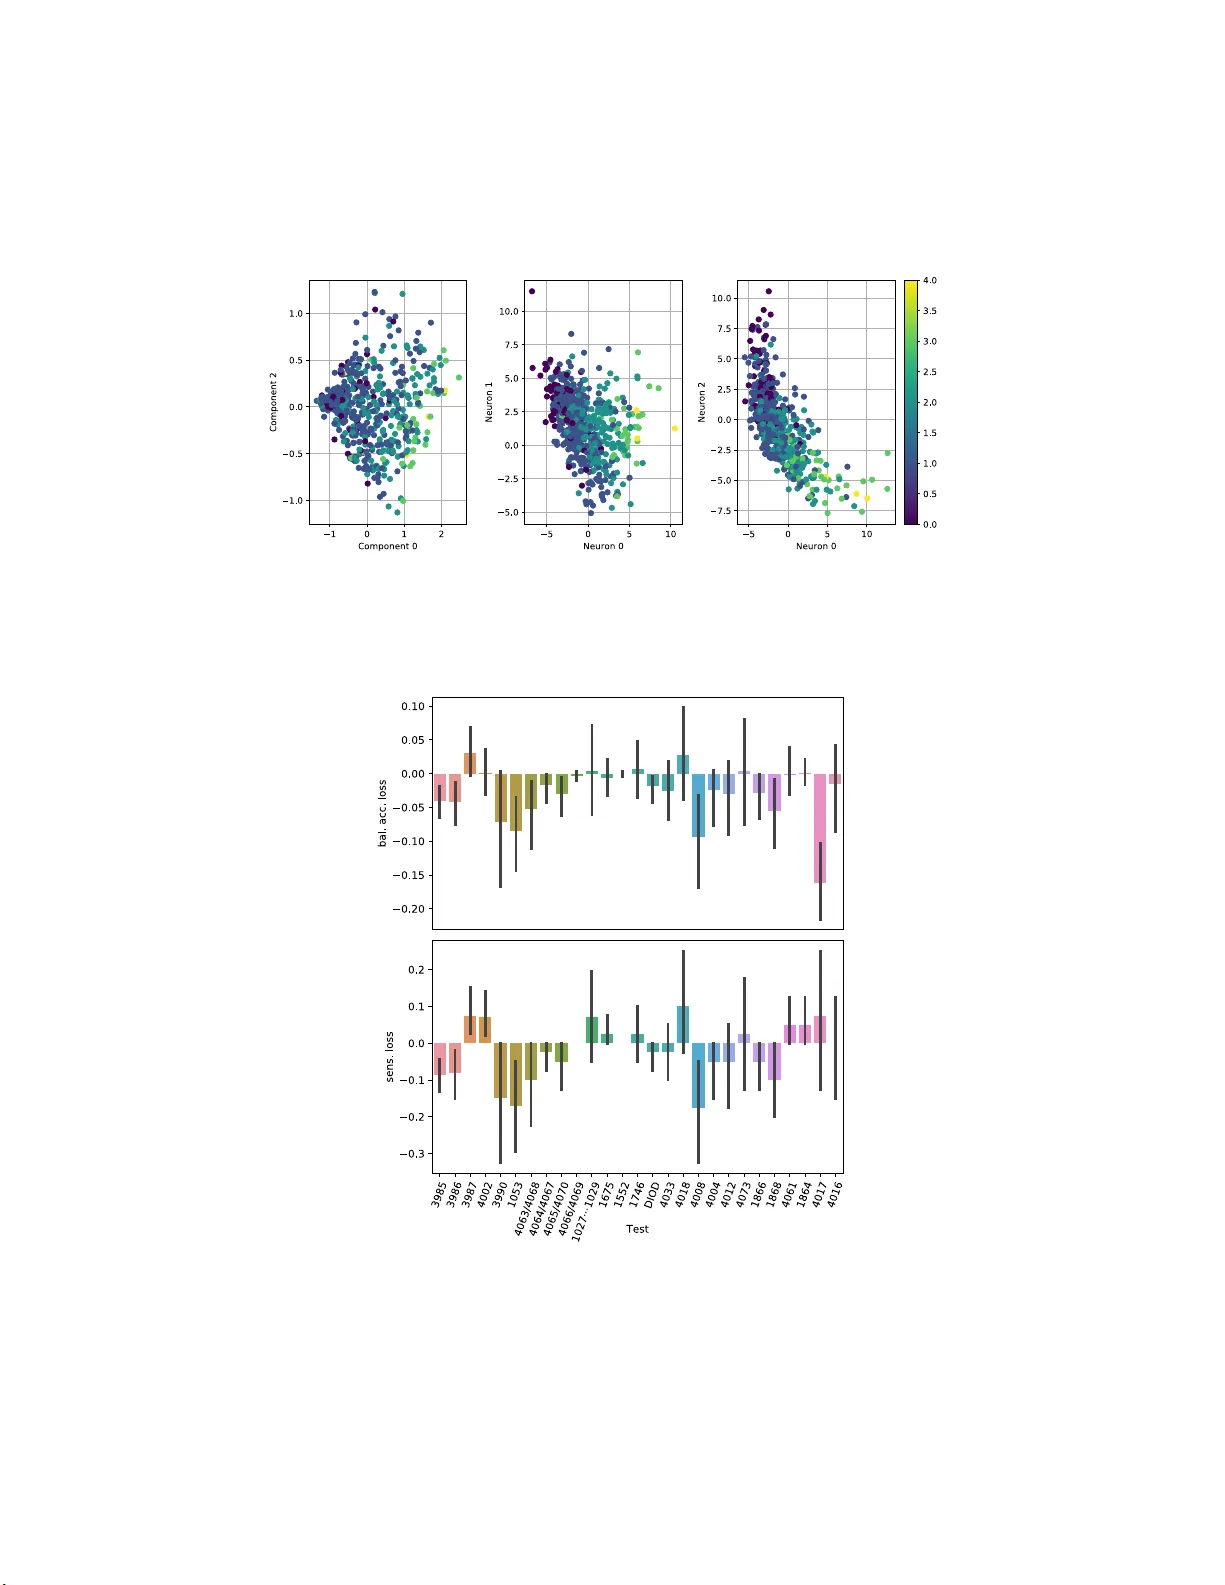
A Neural Appr oac h to Ordinal Regression for the Prev en tiv e Assessmen t of Dev elopmen tal Dyslexia F rancisco J. Martinez-Murcia 1 , Andres Ortiz 1 , Marco A. F ormoso 1 , Miguel Lop ez-Zamo r a 2 , Juan Luis Luque 2 , and Alm udena Gimenez 2 1 Dept. of Communicatio n s Engineering, Universit y of M´ alaga, Spain fjmm@ic.um a.es 2 Dept. of Developmen tal and Edu cational Psyc h ology , Universit y of M´ alaga, S p ain Abstract. Dev elopmental Dyslexia (DD) is a learning disabilit y related to the acqu isition of reading skills that affects about 5% of the p opula- tion. DD can hav e an enormous impact on the intellectual and personal developmen t of affected chil d ren, so early detection is k ey t o implement- ing preven t ive strategies for teaching language. Research has sho wn th at there may b e biological un derpinnings to D D t h at affect p honeme pro- cessing, and hence these symptoms may b e identifiable b efore reading abilit y is acquired, allo wing for early interve ntion. In this pap er w e p ro- p ose a new metho dology to assess the risk of DD b efore stu dents learn to read. F or this purp ose, we prop ose a mixed neu ral mod el that calcu- lates risk levels of dyslexia from tests th at can b e completed at the age of 5 years. Our meth od first trains an auto-en co der, and then combines the trained encoder with an optimized ordinal regressio n n eural netw ork devised to ensure consistency of p redictions. Our exp eriments show that the system is able to detect unaffected sub jects tw o years b efore it can assess t h e risk of DD based mainly on phonological pro cessing, giving a sp ecificity of 0.969 and a correct rate of more than 0.92. I n addition, the t rained en cod er can b e used t o transform test results into an inter- pretable sub ject spatial distribution that facilitates risk assessmen t and v alidates metho dology . Keywords: Auto encod er · Deep Learning · Dyslexia · Prev ention · Or- dinal Regression. 1 In tro duction The Developmen tal Dys lexia (DD) is a learning disability that hinders the ac- quisition of reading skills, affecting roughly a 5% o f the p opulatio n [15]. It is characterized by difficulties in r eading, unrea dable handwriting, letter migration and common missp elling , that can affect the intellectual and p erso nal develop- men t o f a ffected children [18]. A v ar iety o f lea rning metho dolo gies e xist that can po sitively impa ct the reading abilities of affected children. How ever, the diagno- sis is generally asso cia ted to reading , and therefor e it limits the minim um age, which may be o f fundamen ta l impa ct to a pply pr even tive treatments. 2 F.J. Martinez-Murcia et al. In the last years, many works are p ointing to commo n biolo gical underpin- nings that may ca use this disability . Sp ecifica lly , an incor r ect pho nologica l pro- cessing may lay b ehind so me pr oblems asso cia ted with DD, causing an abnorma l enco ding of words in memo r y [6,4,5]. These symptoms may b e identifiable befor e the sub jects a cquire the a bilit y to r ead, allowing for a preven tive interv ention that fav ours the reading co mpe tence in tho se in r isk for DD. Data dec o mp osition is often use d in machine learning b oth for dimensional- it y reduction and interpretation of the metho dology . Man y metho dolo gies exist, among then the very po pular Principal Compo nent Analys is (PCA) [1 7] or In- depe ndent Comp onent Analysis (ICA) [1,11]. In contrast to these tec hnique s , whose mo del of the data is a linear co mbin ation of hidden v ar iables, there ex- ist ma nifold learning tec hniq ue s that allow to discov er mo re co mplex co mbin a - tions. So me of them have b een widely used in the liter ature, such as Isomap, the t-distributed sto chastic neighbour embedding (t-SNE) o r mor e recently , au- to enco ders [3,10]. Autoenco ders are a powerful and versatile to ol used in many works to yield a da ta-driven distribution o f the data, allowing for cor relation with contin uous v ariables a nd cla s sification, e.g. in Alzheimer’s Dise a se [10]. Typically , machine learning is often thought of as a v ar iety of metho ds for classification and r egressio n. Moreover, most metho dologies that deal with a ny kind of diag nosis tend to make use of cla ssifiers, whereas those dealing with contin uous assess ment –e.g ., cognitive tests– mak e use of regr ession. Howev er, there is an in ter mediate problem, for which ther e are no t so many alternatives av ailable: risk a ssessment [9]. In the case o f DD, there exis t an arbitr ary scale ranging from 0 to 4, in which no intermediate v alues a re av a ilable. The risk scale is not con tinuous in natur e, but in co ntrast to m ulti-c lass classification the outcomes still dep end on each other: level 3 implies a higher r isk than 2, but smaller than 4. There is a n o rdinal nature in these pro blems, a nd that is why we use ordinal r egress ion to tackle the problem. Many or dinal regressio n metho ds hav e b een pro p osed. The most widespre a d consists on dividing the grading pro blem in a series of binary c la ssifiers, each of which indica tes if a certain threshold has b een surpassed [9,13]. How ever, most of these systems deal with inconsis tency in the cla s sifier when the training complexity increases. Tha t is , some binary classifiers may indicate the gra de is ab ov e a given threshold, whereas other s may no t. In [2], the author s prop ose a Consistent Rank Logits (CORAL) or dinal regr ession to implemen t the bina r y classifiers with parameter sharing in the weigh ts of the last layers, but with individual bias e s in eac h neur on, accomplishing theoretical classifier co nsistence. In this pap er, we present a novel metho dolo gy to predic t the risk of DD in 5 year old individuals based o n the outcomes o f tests designed b y exp ert psychol- ogists. These s ub jects were follow ed ov er 4 years (from 5 to 8 years old), until a consistent DD ris k ev aluation was p er formed at ag e 7. W e apply auto enco ders for obtaining a feature modelling of the test outcomes and then a o rdinal neural regres s or that tries to predict the risk levels using the data a t age 7. The dataset and the complete metho dology is intro duced a t Section 2, the results ar e pr e- A Neural Approach to Ordinal Regression for... 3 sented at Sec. 3 and discussed at Sec. 4 . Finally , conclus ions a b o ut this work are drawn at Section 5. 2 Material and Metho ds 2.1 The LEEDUCA Study The LEE DUCA pro ject is a study for the assessment of sp ecific learning difficul- ties of rea ding -dyslexia- and their evolution during infancy [1 2]. It implements a Res p o nse to Interv ention (RtI) sy stem that has b ee n applied for 20 years in the US and 10 years in Finland. The system applies a dy namic ev aluation three times a y e ar fr om 4 to 8 years to la rge po pulation samples. Sp ec ific a lly , the con- trol and e xp erimental g roups came from a cohor t from different schools in the south of Spa in, following ev aluation from 5 to 8 years, v ia the s tandard criteria used in simila r studies and the Sp ecia l Education School Services (SESS). 2.2 Data and Prepro cessin g The data from the LEEDUCA study comprises a battery of tests spanning fro m 5 to 8 years old children at school. These tests ar e ada pted to the age and educational level of the student s (e.g., when they cannot read at 5 years), and therefore it is difficult to establish any longitudinal pro cessing. As stated, we only use the 33 tests p erformed a t 5 y ea rs – w hen students ca nnot r ead– to predict the risk o f DD at 7 years. The r isk gra des were set in function of the n umber and grade of the scor es in asses sments of four ma jor categor ies: Phonologica l Route, Visual Ro ute, T ext Fluidity and T ext Co mprehension. Anomalous v alues were set based o n p ercentile ( p ) v a lues, in which p < 3 0, p < 2 0 and p < 30 were set to grade 1, 2 a nd 3. Afterwards, these abnormality g rades were averaged over all assess ments and catego ries, a nd the fina l risk was estimated according to this av e r age v alue , in a scale o f 0 to 4 , dep e nding on the int e r v als where it laid ( −∞ , 0) , (0 , 0 . 5) , (0 . 5 , 1 . 5) , (1 . 5 , 2 . 5) , (2 . 5 , ∞ ). In the end, the n umber o f sub jects in each grade is 5, 3 31, 2 70, 5 0 a nd 1 0 for g rades 0, 1 , 2 , 3 and 4. All sub jects lacking mor e than 5 test results in the tests were deleted from the s e t. That left us with 5 7 2 sub jects with ev alua tions a t 5 and 7. K-Neares t- Neighbour (KNN) imputation [19] with the t wo closest neighbours was us ed to generate v a lid v alues for those missing less than 5 results. Finally , the data was scaled to the range [0 , 1], es timating the minimum and maximum v alues from the training subset. 2.3 Denoising Auto enco der Autoenc o ders (AEs) are a sp ecific type o f neural e nco der-deco der archit e c ture. It consists of a feed-forward neural netw o rk tha t r educes dimensionality (enco der), directly connected to a in verse netw o rk (a deco der, usually symmetric w ith the enco der) tha t increas es dimensionality to r econstruct the original s ha p e. Then, 4 F.J. Martinez-Murcia et al. the netw or k is trained to minimize the erro r b etw een the input and the output. A t ypica l v ariation is the denoising AE (DAE), in whic h the input is corrupted with noise and the netw ork is exp ected to provide the original input, without noise, whic h is sometimes co nsidered a regularization pro cedure. No further reg- ularization w a s used. In this w o rk, w e pro po se a hybrid mo de l that trains the auto enco der and then reuses the enco der part to p erfor m dimensiona lity r e duction, a s in [10]. The precise architecture uses symmetric enco der and deco der mo dules. There are three layers of N , 64 and 3 neur ons for the enco der and 3, 64 and N for the deco der (where N is the num b er of tests included). W e use d 3 neuro ns in the Z -layer to fav o ur a visual in ter pretation of the results in a three- dimensional space, and 6 4 neurons in the in ter mediate layers of the enco der and deco der were chosen after a c a reful systematic test of a ccuracy and visualiza tion, in pow er s of 2. A hig her num b er o f neurons led to ov erfitting and low er explaina bility o f the representation, and a smaller n umber of neuro ns yielded low er per formance. Batch normalization is used for sp eeding up the conv erg ence and the activ ation function for layers 1, 2, 4 and 5 is ELU. The intermediate layer (usually known as Z-layer) a nd output lay ers hav e linear activ atio n. F o r training we use the Mean Squared Err or (MSE) betw een the input and output data a s loss, and the Adamax optimizer [7 ]. 2.4 Ordinal Neural Regres sion T o p erform ordina l re g ressio n, we use the Consistent Rank Lo gits (CORAL) approach prop osed in [2]. CORAL is devis e d to crea te an ordinal r egressio n framework with theoretical gua rantees for cla ssifier consistency , in contrast to other metho ds in the liter ature [13]. The pro cedure consists of tw o ma jor co n- tributions. First, a la b el extension, by which the rank level y i is extended into K − 1 bina ry lab els { t i, 0 , . . . t i,K − 1 } such that t i,j ∈ { 0 , 1 } indica tes whether y i exceeds a given ra nk ( y i > r k ), as in [13]. This is implemented a t the output lay er of the regressio n net work, via a layer with K − 1 binary neuron classifier s sharing the s ame weigh t parameter but indep endent bias units, which according to [2] solves the incons istency problem among predicted binary r esp onses. The predicted rank is obtained as: r i = K − 2 X j =0 o i,j (1) where o i,j is the output (linea r activ ation) of the j th neuron for the i th sub ject, also known as lo git. The seco nd key asp ect of the CORAL reg ressio n is the loss function. T o calculate the loss betw een o i,j and the target level t i,j , the author s prop ose: L ( o , l ) = X n X j t n,j log [ s ( o n,j )] + (1 − t n,j )(log [ s ( o n,j )] − o n,j ) (2) A Neural Approach to Ordinal Regression for... 5 where s ( · ) is the sigmoid function. An optional feature impo rtance v ar ia ble could m ultiply the second term to adjust for lab el prev ale nce , althoug h adding it did not increase d the p erformance sig nifica ntly . F urthermo re, since it a lso implied making assumptions ab out the r e al distribution of s ub jects, w e c ho se not to use this impo rtance term. 2.5 F ull Mo del: Arc hitecture and T raining The res ulting mo del is a combination of the enco der part of a DA E and an ordinal neur al reg ressor , a 3-layer feed-forward net work that uses the CORAL framework. The model architecture is display ed in more detail at Figure 1.a), b) and c). n=3 n=64 n=4 n=33 n=64 n= 3 n=64 n=33 ENCODER DEC ODER n=33 n=64 n= 3 n=64 n=4 a) b) c) Fig. 1. Schema of t h e a) Au to encod er for pre and re- training, b) F eed-forw ard netw ork for CORAL ordinal regression, c) complete mo del. The cost functions for the enco der and the regre ssor a re defined at Sec- tions 2 .3 and 2.4, and Adam with l r = 0 . 01 is use d to train the whole system (with or without lo cking the enco der). W e applied early stopping in b oth cases, that is, the training was s topp ed after 150 ep o chs if there was no improvemen t in v alidation lo ss, in order to reta in the b est mo del. 2.6 Ev aluation The mo dels hav e b e en tested under a 10- fold stratified cross -v alidation (CV) scenario [8 ]. A la rge v arie ty of p erfor ma nce meas ures w e re obtained, sp ecifi- cally: correct r ate, per -class cor rect ra te (for multi-class class ification), sensi- tivit y , sp ecificity , pr e c ision a nd F1 -scor e , and their cor resp onding standard de- viation (STD) ov er all cro ss-v alidation folds. Fina lly , the balanced accur acy is defined as the average correct rate ov er all c la sses [10], which is the most repr e - sentativ e measure in s uch an imbalanced problem. F or ev a luating the relative contribution of ea ch v ariable to the final outcome (either the manifold distribution, risk estima tion or classifica tion), we use a r an- domization pro cedur e ba s ed o n Perm utation Impo rtance (PI) [14]. W e iteratively set ea ch v ar iable to ze ro, a nd re-tes ted the traine d reg r essor obtaining a p erfor- mance e stimation in each CV fold. Afterwards, we compare those p erforma nces 6 F.J. Martinez-Murcia et al. to the regresso r us ing a ll v ariables . In this fra mework, a larger p erforma nce loss implies a larger influence of that v ar ia ble in the mo del. Finally , w e define the following mo dels to b e compa red in our work: – PCA . A mo del c o mp osed of a decomp os ition of the dataset using Principal Comp onent Analysis and a CORAL regres sion (Fig. 1.b) on the comp onent scores for ea ch sub ject. Note that only the training subset is us e d to create the PCA mo del a nd pro ject the test set. – Pretraining . The prop os ed mo del in whic h the auto enco der (Fig. 1 .a) is first trained, and then the mo del is built with the neural regresso r (Fig. 1.b) and the pre-tr ained enco der (Fig. 1.c ). The enco der is lo ck ed and only the neural regres s or is trained. – Retraining . The AE is pre-trained as in the previo us mo del (Fig. 1.a), but this time, the full mo del (Fig. 1 .c ) including the enco der and the neura l regres s or are trained simultaneously . 3 Results After tra ining and testing the mo dels defined in Sec tion 2.6, we measured first the m ulti- le vel per formance; that means, we provide the accur acy for the differe nt DD risk levels, the ov era ll c orrect rate a nd the balanced accur acy . These results are presented at T able 1 . T able 1. Results for the ordinal regression, including accuracy p er level, balanced accuracy and ov erall correct rate for the PCA, pre- and re-training mo dels. PCA pre-training re-training Level 0 (acc.) 0.000 [0.00] 0.143 [0.14] 0.067 [0.14] Level 1 (acc.) 0.822 [ 0.13] 0.633 [0.17] 0.61 5 [0.15] Level 2 (acc.) 0.433 [ 0.18] 0.376 [0.09] 0.39 5 [0.13] Level 3 (acc.) 0.058 [0.12] 0.225 [0.26] 0.442 [0.14] Level 4 (acc.) 0.000 [0.00] 0.000 [0.00] 0.000 [0.00] Correct Rate [STD] 0. 575 [ 0.06] 0.481 [0.07] 0.484 [0.08] Balanced Acc. 0.309 [0.05] 0.321 [0.05] 0.357 [0.06] Regarding the per- level accur acy , we observe that PCA is go o d in gener a l for obtaining a fair ov erall correc t rate (0.575) when compar ed to the pre- training mo del (0.481 ) and the re-trained mo del(0.4 84). How ever, the P C A fails to ac- count for the le s s-prev alent levels (3 and 4, the ones asso cia ted with high risk of DD), which is precisely the main ob jective of this pap er . When lo o king at this, the pre-training model at least detects a small prop ortio n (0 .225) of level 3 sub jects and also level 0, but failing to account for level 4, wherea s the re-trained mo del detects a lar ger amount (0.442) of these levels, a t the cos t of mistaking some level 1 and 2 sub jects. This is refle c ted on the balanced a ccuracy , which is A Neural Approach to Ordinal Regression for... 7 higher in the cas e of the re-training mo del, but a lso can be seen in mor e detail at the co nfusion matrices, display ed at Figur e 2 . RETRAINING RETRAINING Fig. 2. Confusion matrices for th e three mod els ev aluated. There w e see how the re -training mo del is the b es t in g rading e xtreme-level sub jects (lev els 0 , 3 and 4 ) corr ectly . This is far more evident in the case o f the levels more asso ciated to dys le xia (3 and 4), which are far better in the D AE + ordinal regre ssion mo dels than in the PCA. How ever, there is another a ppr oach to the problem: the one that co nsiders only the detec tio n of sub jects in high risk of DD (a risk lev el ≥ 3 ). Der ived from the same model, the r esults of this binar y s c enario are presented at T able 2. T able 2. Performa nce results for binary classification of th e highest level s ( r i ≥ 3) PCA pre-training re-training Correct Rate 0.934 [ 0.012] 0.898 [0.052] 0.927 [0.041] Sensitivity 0.050 [0.110] 0.225 [0.281] 0.442 [0.153] Sp ecificity 0.998 [ 0.006] 0.946 [0.059] 0.962 [0.037] Precision 0.667 [0.580] 0.446 [0.482] 0.909 [0.091] F1-Score 0.400 [0.000] 0.572 [0.193] 0.585 [0.150] Balanced Acc. 0.524 [0.053] 0.586 [0.131] 0.702 [0.086] The ov era ll correct rate in this case is astounding , over 90% in all c a ses. How ever, this is again due to the low er prev alence of DD. When digging deeper int o the meas ures, w e observe that the sensitivity and sp ecificity , as well as the balance d accurac y , offer a clearer sight o f the p erfo r mance of ea ch mo del. Particularly , the larger sp ecificity is achiev ed aga in b y the P CA mo del (it is the bes t in dis c arding sub jects with no r isk of DD). Howev er, the sens itivity of the mo del is 0.0 50, close to lab elling all sub jects as low r isk. The DAE+Regress or mo dels offer larg er sensitiv ity (ov er 0.2), aga in with the r e-training mo del the one ac hiev ing b etter res ults, w ith a sensitivity of 0.44 2 , and a precision o f 0.9 09, 8 F.J. Martinez-Murcia et al. and a total balanced acc uracy of 0.702 , which is fairly go o d for this application. F urthermore, the spec ific ity o f this metho d (0.92 7) is excellent, indicating that the s y stem har dly misses a ny sub ject in risk of DD. Given that o ur purpos e is to per form a preven tive interv ention on sub jects in risk, a go o d tra de-off b etw een high sp ecificity and the b est p ossible sensitivity is a sensible approach. 4 Discussion The results of ev aluating the mo de l show that it is p oss ible to predict DD when student s are 5 years old, b efor e they have learnt to read. This is a fundamental adv ance in pr even tive tr eatment, allowing for an ea r lier detection o f this lea rning disability and making it p ossible to a pply a preven tion pr ogra m. Since the LEE DUCA study has a large co hort that has b een repeatedly ev aluated over the y ear s, ma ny s ub jects ar e av aila ble for o ur study . Th us , neural net work architectures may b e applied to the pr oblem. The combination of a representation mo delling approach (the DAE) that has b een a pplied to other data analysis pip elines [10], and the flexibility of neural r egress io n seems to b e informative enough to automatica lly g rade the risk of DD and provide a set of sub jects to whic h the preven tive progr am could b e applied. Moreov e r , this metho dology gives us larg e r insight into which tests are more predictive of future reading disa bility , at the sa me time that it provides a deeper insight into the data, r evealing a self-sup ervised data decomp os ition via the auto enco de r that allows for a bi- a nd tri- dimensional representation of the dataset. When explor ing this pro jectio n onto a t wo-dimensional space , and co mparing the thr e e mo dels, w e o bta in Figure 3. Ther e we can see that all three metho ds pro ject the sub jects (each p oint) in a spatial co or dinate related to the DD risk. How ever, thes e distributions differ. In the case of PCA, the risk increases with comp onent 0 (the fir st P CA comp onent), but individuals ar e spar sely lo cated, and the levels a re very mixed, which was exp ected for a linea r approach. F o r the D AE + regr essor mo dels, the levels are more disting uis hable. In the c a se of the pre-training mo del, it resembles the P CA mo de l with an increasing risk ov er neuron 0 , but this time, the levels ar e clustered together . How ever, the sub jects at higher level are still very mixed, making it difficult for the regres s or to correctly assign risk lev els . The r e-training mo del, how ever, is forming a manifold that resembles a cur ve starting at sub jects with risk 0- 1 and relatively increasing up to the furthest sub jects, those w ith r isk level 3 and 4. This prov es that there exist a relations hip b etw ee n the test outcomes a nd the risk of developing DD that is better mo de lle d by the re -training mo del, generating more acc urate predictions of risk. F o cusing on this mo del, it may b e very useful to a ssess which input v ariables cause larg er changes in the overall balanced accura cy and sensitivity . T o do so, we use the PI algo rithm (see Sec. 2 .6) that helps us to visua liz e the re lative influence of each v a riable. This imp ortance is shown at Fig ure 4. In Fig . 4 the b ehaviour is consis tent in mos t v ar iables, regardles s of ho w the loss is measur ed (balanc e d accur acy or sensitivity in the binary cla ssification, A Neural Approach to Ordinal Regression for... 9 PRETRAINING PCA RETRAINING Fig. 3. Distribution of th e p oints at th e outp ut of the PCA (for the baseline sy stem) and the AE (for the pre- and re-training systems). Note t he self-sup ervised distribution of the gradings in the later mo dels. Fig. 4. Relative imp ortance of th e different v ariables in the re-training system, com- puted using the sensitivity and balanced accuracy loss. 10 F.J. Martinez-Murcia et al. DD detectio n), except for t wo r elev ant cases, test v ar iables 40 17 a nd 4 002. Those corres p o nd r e sp ectively to a test to lab el Ar a bic numerals and a test fo r verbal memory acco rding to the phonological hypothesis. F or the remaining v aria bles, the larger p erfo rmance loss is for v ar ia bles 3 990, 10 53, 4063/40 68 a nd 4 008. The last one co rresp o nds to an ev aluation o f the ‘sustained attention’, within the category of exec utive functions. All the remaining corr esp ond to the phono logical hypothesis, sp ecifically for trials that ev aluate the Lexical access s p ee d in co lours (3990), num b ers (1053) and ob jects in s yllables (406 3/40 68). This is co ns istent with the c urrent scientific understanding of DD in the literature . In fact, a n incorrect phonolo gical pr o cessing is one of the most acc epted causes of DD in the scientific communit y [16], causing an a bnormal e nc o ding of words in memo ry . In summary , we developed a no vel metho dolo gy intended to accur ately grade sub jects t wo years b efo r e the first DD risk ev aluations. It uses a self-sup er vised decomp osition via denois ing auto enco ders plus a neural o rdinal regr ession fol- lowing the CORAL metho dology . T he results pr ov e that the methodo logy is useful for an ear ly scree ning , achieving high v alues of sp ecificity that could lea d to non-inv a sive preven tive metho do logies that allow a mo re efficient developmen t of reading skills. 5 Conclusions In this work, we have developed a neural system that combines a denois ing au- to enco der with the theoretica l guarantees o f the Consistent Rank Logits (CORAL) neural regres s ion, allowing for a mo del that is able to predict the risk of Develop- men tal Dyslexia tw o years b efore firs t a ssessing the r eading abilities. The s y stem combines a pre- training of the auto enco der , and then co nnecting the output o f the enco der to a neural perceptro n that uses parameter s ha ring at the output as in the CORAL ordina l r egress io n framework, yielding a sp ecificity of 0.9 69 and correct r ate of o ver 0.92 . The sys tem outputs ris k level v alues similar to the ones assessed at age 7 using just the test outco mes at age 5, based ma inly on pho no - logical pro ces sing. The sy stem pr oved its abilit y in detecting non-affected a nd yielding a subset of candidates for preven tive –non inv a sive– la nguage teaching mo dalities, allowing a visual in ter pretation by tra nsforming the battery of tests int o a manifold related to the r isk levels o f dyslexia, v alidating the metho dolo gy . Ac knowledgem ents This w o rk w a s partly suppo rted by the MINECO/FEDER under R TI2018- 09891 3-B-I0 0, PSI2 015-6 5848 -R and PGC2018 -0988 13-B- C32 pro jects. W ork by F.J.M.M. was supp orted by the MICINN “Juan de la Cier v a - F ormaci´ on” FJCI- 2017- 3302 2 . References 1. Bartlett, M., Mov ellan, J., Sejno wski, T.: F ace recognitio n by indep endent compo- nent analysis. IEEE T ransactions on N eural Net works 13 (6), 1450–1 464 (2002) A Neural Approach to Ordinal Regression for... 11 2. Cao, W., Mirjalili, V., Rasc hk a, S.: Rank-consistent Ord inal Regression for Neural Netw orks. arXiv:1901.078 84 [cs, stat] (Aug 2019) 3. Chen , M., Shi, X ., Zhang, Y., W u, D., Guizani, M.: Deep features learning for med - ical image analysis with conv olutional auto enco der neural netw ork. IEEE T rans- actions on Big Data (2017) 4. Goswami, U.: A neural oscillations p ersp ective on phon ological developmen t and phonological pro cessing in developmenta l dyslexia. Language and Linguistics Com- pass 13 (5), e12328 (2019). https://doi.org /10.1111/lnc3.12328 5. Goswami, U .: Sp eec h rhythm and language acquisition: A n amplitud e modulation phase hierarch y p ersp ective. Ann als of the New Y ork Academy of Sciences 0 (0) (2019). https://doi. org/10.1111/n yas.14 137 6. K imppa, L., S ht yrov, Y., P artanen, E., Kujala, T.: Impaired neural mechanism for online n o vel word acquisition in dyslexic children. Scientific R ep orts 8 (1), 1–12 (Aug 2018). https://doi. org/10.1038/s4 1 598-018-31211-0 7. K ingma, D .P ., Ba, J.: Adam: A metho d for sto chastic optimization. arXiv p reprint arXiv:1412.69 80 (2014) 8. K ohavi, R.: A study of cross-v alidation and b o otstrap for accuracy estimation and mod el selection. I n: Proceedings of International Join t Conference on A I. pp. 1137–11 45 (1995) 9. Li, L., Lin, H.T.: Ord inal regression by extend ed binary classification. In: Adva n ces in neural information pro cessing systems. p p. 865–872 (2007) 10. Martinez-Murcia, F.J., Ortiz, A ., Gorriz, J., Ramirez, J., Castil lo-Barnes, D.: Studying the manifold structure of alzheimer’s disease: A d eep learning approac h using conv olutional auto enco ders. I EEE Journal of Biomedical and Health Infor- matics 24 (1), 17–26 (Jan 2020). https://doi.org/10 .1109/JBHI.2019.2914970 11. Mart ´ ınez-Murcia, F.J. , G´ orriz, J., Ram ´ ırez, J., Pun tonet, C.G., I ll´ an, I., In itiativ e, A.D.N., et al.: F unctional activity maps based on significance measures and in- dep endent comp onent analysis. Computer metho ds and programs in biomedicine 111 (1), 255–26 8 (2013). https://doi. org/10.1 016/j.cmpb.2013.03.015 12. Mart ´ ınez-Murcia, F.J., Ortiz, A., Morales-Ortega, R., L´ op ez, P ., Luq ue, J., Castillo-Ba rn es, D., S ego v ia, F., Illan, I.A., Ort ega, J., R amirez, J., et al.: Peri- odogram connectivity of eeg signals for the detection of dyslexia. In: I nternational W ork-Conference on the Interplay Betw een N atural and Artificial Computation. pp. 350–359 . Springer, Cham (2019) 13. N iu , Z., Zhou, M., W ang, L., Gao, X., Hua, G.: Ordin al regression with multiple output cn n for age estimation. In: Pro ceedings of the IEEE conference on computer vision and pattern recognition. p p. 4920–4 928 ( 2016) 14. Olden , J.D., Jac kson, D.A.: Illuminating t he “blac k b ox”: A random- ization approac h for understanding v ariable contributions in artificial neural netw orks. Ecological Modelling 154 (1), 135–150 (Aug 2002). https://doi .org/10.1016/S03 04-38 00(02)00064-9 15. Peterson, R., Pennington, B.: Dev elopmenta l dyslexia. Lancet 379 , 1997–2007 (Apr 2012) 16. Sh aywi t z, S.E., Morris, R., S haywitz, B.A.: The ed ucation of dyslexic children from chil d ho od to young adulthoo d. An nu. Rev. Psychol. 59 , 451–47 5 (2008) 17. Sp etsieris, P .G., Ma, Y., Dha wan, V., Eidelberg, D.: Differen tial diagnosi s of parkinsonian syndromes using functional PCA-based imaging features. Neu roim- age 45 (4), 1241–52 (May 2009) 18. Thompson, P .A., Hulme, C., Nash, H .M., Go o ch, D., Ha yiou-Thomas, E., Snowl- ing, M.J.: Developmen tal dyslexia: Predicting individual risk. Journal of Child Psychol ogy and Psyc h iatry 56 (9), 976–987 (2015) 12 F.J. Martinez-Murcia et al. 19. T ro yansk ay a, O., Cantor, M., Sherlock, G., Bro wn, P ., Hastie, T., Tib- shirani, R., Botstein, D., Altman, R .B.: Missing v alue estimation meth- ods for DNA microarra ys. Bioinformatics 17 (6), 520–525 (Jun 2001). https://doi .org/10.1093/bio in formatics/17.6.520
Original Paper
Loading high-quality paper...
Comments & Academic Discussion
Loading comments...
Leave a Comment