Diagnosis of Celiac Disease and Environmental Enteropathy on Biopsy Images Using Color Balancing on Convolutional Neural Networks
Celiac Disease (CD) and Environmental Enteropathy (EE) are common causes of malnutrition and adversely impact normal childhood development. CD is an autoimmune disorder that is prevalent worldwide and is caused by an increased sensitivity to gluten. …
Authors: Kamran Kowsari, Rasoul Sali, Marium N. Khan
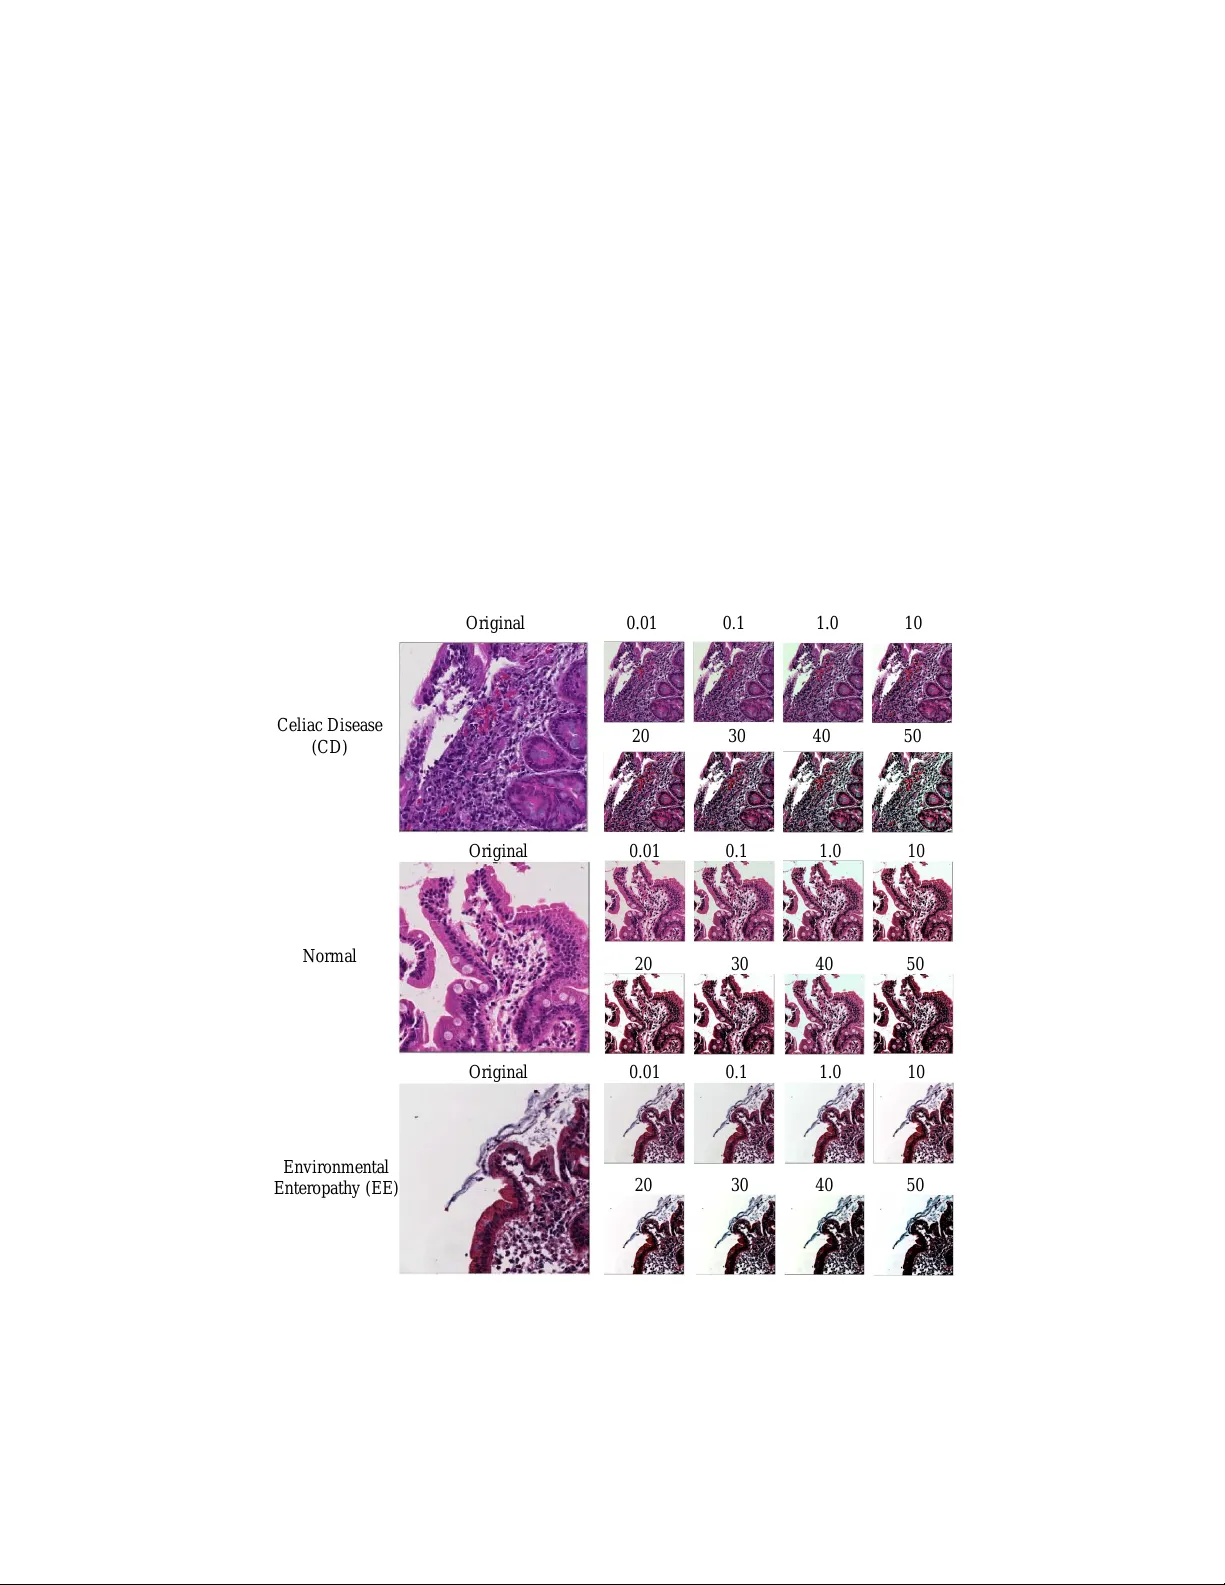
Diagnosis of Celiac Disease and En vironmen tal En teropath y on Biopsy Images Using Color Balancing on Con v olutional Neural Net w orks Kamran Ko wsari 1 , Rasoul Sali 1 , Marium N. Khan 3 , William Adorno 1 , S. Asad Ali 4 , Sean R. Mo ore 3 , Beatrice C. Amadi 5 , P aul Kelly 5 , 6 , Sana Sy ed 2 , 3 , 4 , ∗ , and Donald E. Bro wn 1 , 2 , ∗ 1 Departmen t of Systems & Information Engineering, Universit y of Virginia, Charlottesville, V A, USA 2 Sc ho ol of Data Science, Universit y of Virginia, Charlottesville, V A, USA 3 Departmen t of P ediatrics, School of Medicine, Universit y of Virginia, Charlottesville, V A, USA 4 Aga Khan Universit y , Karac hi, Pakistan 5 T ropical Gastroenterology and Nutrition group, Universit y of Zambia Sc ho ol of Medicine, Lusak a, Zambia 6 Blizard Institute, Barts and The London School of Medicine, Queen Mary Univ ersity of London, London, United Kingdom ∗ Co-corresp onding authors: { sana.syed , deb } @virginia.edu Abstract. Celiac Disease (CD) and Environmen tal Enteropath y (EE) are common causes of maln utrition and adversely impact normal child- ho od developmen t. CD is an autoimm une disorder that is prev alen t w orldwide and is caused by an increased sensitivit y to gluten. Gluten exp osure destructs the small in testinal epithelial barrier, resulting in nu- trien t mal-absorption and childhoo d under-n utrition. EE also results in barrier dysfunction but is thought to b e caused by an increased vulner- abilit y to infections. EE has been implicated as the predominant cause of under-n utrition, oral v accine failure, and impaired cognitive devel- opmen t in low-and-middle-income countries. Both conditions require a tissue biopsy for diagnosis, and a ma jor c hallenge of interpreting clini- cal biopsy images to differen tiate betw een these gastrointestinal diseases is striking histopathologic ov erlap b et ween them. In the current study , w e prop ose a conv olutional neural netw ork (CNN) to classify duo denal biopsy images from sub jects with CD, EE, and healthy controls. W e ev aluated the p erformance of our prop osed mo del using a large cohort con taining 1000 biopsy images. Our ev aluations sho w that the prop osed mo del ac hieves an area under ROC of 0.99, 1.00, and 0.97 for CD, EE, and health y controls, respectively . These results demonstrate the discrim- inativ e p ow er of the prop osed mo del in duo denal biopsies classification. Keyw ords: Con v olutional Neural Netw orks, Medical Imaging, Celiac Disease, Environmen tal Enteropath y 2 Kamran Kowsari et al. 1 In tro duction and Related W orks Under-n utrition is the underlying cause of appro ximately 45% of the 5 million under 5-year-old childhoo d deaths annually in lo w and middle-income coun- tries (LMICs) [ 1 ] and is a ma jor cause of mortality in this p opulation. Linear gro wth failure (or stun ting) is a ma jor complication of under-n utrition, and is as- so ciated with irrev ersible physical and cognitive deficits, with profound develop- men tal implications [ 32 ]. A common cause of stuntin g in LMICs is EE, for which there are no universally accepted, clear diagnostic algorithms or non-inv asiv e biomark ers for accurate diagnosis [ 32 ], making this a critical priorit y [ 28 ]. EE has b een describ ed to b e caused by chronic exp osure to enteropathogens which results in a vicious cycle of constan t mucosal inflammation, villous blun ting, and a damaged epithelium [ 32 ]. These deficiencies contribute to a markedly reduced n utrient absorption and thus under-n utrition and stunting [ 32 ]. In terestingly , CD, a common cause of stunting in the United States, with an estimated 1% prev alence, is an autoimmune disorder caused by a gluten sensitivity [ 15 ] and has man y shared histological features with EE (such as increased inflammatory cells and villous blunting) [ 32 ]. This resemblance has led to the ma jor challenge of differen tiating clinical biopsy images for these similar but distinct diseases. Therefore, there is a ma jor clinical interest tow ards developing new, innov ativ e metho ds to automate and enhance the detection of morphological features of EE versus CD, and to differentiate b etw een diseased and healthy small intesti- nal tissue [ 4 ]. In this pap er, we prop ose a CNN-based mo del for classification of biopsy images. In recent years, Deep Learning architectures hav e received great atten- tion after ac hieving state-of-the-art results in a wide v ariety of fundamen tal tasks suc h classification [ 13 , 18 , 19 , 20 , 24 , 29 , 35 ] or other medical domains [ 12 , 36 ]. CNNs in particular ha ve pro ven to be very effectiv e in medical image pro cessing. CNNs preserv e lo cal image relations, while reducing dimensionality and for this reason are the most popular mac hine learning algorithm in image recognition and visual learning tasks [ 16 ]. CNNs ha ve b een widely used for classification and segmen- tation in v arious types of medical applications such as histopathological images of breast tissues, lung images, MRI images, medical X-Ra y images, etc. [ 11 , 24 ]. Researc hers pro duced adv anced results on duo denal biopsies classification us- ing CNNs [ 3 ], but those mo dels are only robust to a single type of image stain or color distribution. Man y researc hers apply a stain normalization technique as part of the image pre-pro cessing stage to b oth the training and v alidation datasets [ 27 ]. In this pap er, v arying levels of color balancing were applied during image pre-pro cessing in order to accoun t for multiple stain v ariations. The rest of this pap er is organized as follows: In Section 2 , w e describ e the differen t data sets used in this work, as well as, the required pre-pro cessing steps. The arc hitecture of the mo del is explained in Section 4 . Empirical results are elab orated in Section 5 . Finally , Section 6 concludes the pap er along with outlining future directions. Diagnosis of Celiac Disease and En vironmental En teropathy 3 Color Balancing Patches Clustering (Removing useless patches) Image Patching Validating CNN Construction of CNN Training CNN Evaluation of CNN on test set Fig. 1. Overview of methodology 2 Data Source F or this pro ject, 121 Hematoxylin and Eosin (H&E) stained duo denal biopsy glass slides w ere retriev ed from 102 patien ts. The slides w ere conv erted in to 3118 whole slide images, and labeled as either EE, CD, or normal. The biopsy slides for EE patients were from the Aga Khan Univ ersity Hospital (AKUH) in Karachi, P akistan ( n = 29 slides from 10 patients) and the Universit y of Zambia Medical Cen ter in Lusak a, Zam bia ( n = 16). The slides for CD patien ts ( n = 34) and nor- mal ( n = 42) were retrieved from archiv es at the Universit y of Virginia (UV a). The CD and normal slides were conv erted into whole slide images at 40x mag- nification using the Leica SCN 400 slide scanner (Meyer Instruments, Houston, TX) at UV a, and the digitized EE slides were of 20x magnification and shared via the En vironmental Enteric Dysfunction Biopsy Inv estigators (EEDBI) Con- sortium shared WUP AX server. Characteristics of our patient p opulation are as follo ws: the median ( Q 1, Q 3) age of our entire study p opulation was 31 (20 . 25, 75 . 5) mon ths, and we had a roughly equal distribution of males (52%, n = 53) and females (48%, n = 49). The ma jorit y of our study p opulation w ere his- tologically normal controls (41 . 2%), follow ed b y CD patients (33 . 3%), and EE patien ts (25 . 5%). 4 Kamran Kowsari et al. 3 Pre-Pro cessing In this section, w e cov er all of the pre-pro cessing steps whic h include image patc hing, image clustering, and color balancing. The biopsy images are unstruc- tured (v arying image sizes) and to o large to pro cess with deep neural netw orks; th us, requiring that images are split into m ultiple smaller images. After execut- ing the split, some of the images do not contain muc h useful information. F or instance, some only con tain the mostly blank b order region of the original image. In the image clustering section, the process to select useful images is describ ed. Finally , color balancing is used to correct for v arying color stains which is a common issue in histological image pro cessing. 3.1 Image Patc hing Although effectiv eness of CNNs in image classification has been sho wn in v arious studies in different domains, training on high resolution Whole Slide Tissue Images (WSI) is not commonly preferred due to a high computational cost. Ho wev er, applying CNNs on WSI enables losing a large amoun t of discriminativ e information due to extensive do wnsampling [ 14 ]. Due to a cellular lev el difference b et ween Celiac, En vironmental En tropathy and normal cases, a trained classifier on image patc hes is likely to perform as well as or even b etter than a trained WSI- lev el classifier. Many researchers in pathology image analysis hav e considered classification or feature extraction on image patches [ 14 ]. In this pro ject, after generating patc hes from each images, lab els w ere applied to eac h patc h according to its asso ciated original image. A CNN w as trained to generate predictions on eac h individual patch. Fig. 2. Structure of clustering mo del with autoenco der and K-means combination Diagnosis of Celiac Disease and En vironmental En teropathy 5 T able 1. The clustering results for all patches in to tw o clusters T otal Cluster 1 Cluster 2 Celiac Disease (CD) 16 , 832 7 , 742 (46%) 9 , 090 (54%) Normal 15 , 983 8 , 953 (56%) 7 , 030 (44%) En vironmental En teropathy (EE) 22 , 625 2 , 034 (9%) 20 , 591 (91%) T otal 55 , 440 18 , 729 (34%) 36 , 711 (66%) 3.2 Clustering In this study , after image patching, some of created patc hes do not contain any useful information regarding biopsies and should b e remov ed from the data. These patches ha ve been created from mostly background parts of WSIs. A t wo- step clustering pro cess was applied to identify the unimp ortant patches. F or the first step, a con volutional auto enco der was used to learn embedded features of eac h patch and in the second step w e used k-means to cluster embedded features in to t wo clusters: useful and not useful. In Figure 2 , the pipeline of our clustering tec hnique is shown which con tains b oth the auto enco der and k-mean clustering. An auto enco der is a type of neural netw ork that is designed to match the mo del’s inputs to the outputs [ 10 ]. The auto enco der has achiev ed great success as a dimensionality reduction metho d via the p ow erful reprehensibility of neural net works [ 33 ]. The first v ersion of auto enco der w as in tro duced b y DE. Rumelhart el at. [ 30 ] in 1985. The main idea is that one hidden lay er b etw een input and output la yers has m uch fewer units [ 23 ] and can b e used to reduce the dimensions of a feature space. F or medical images which typically contain many features, using an auto enco der can help allo w for faster, more efficient data pro cessing. A CNN-based autoenco der can be divided in to t wo main steps [ 25 ] : encoding and deco ding. O m ( i, j ) = a D X d =1 2 k +1 X u = − 2 k − 1 2 k +1 X v = − 2 k − 1 F (1) m d ( u, v ) I d ( i − u, j − v ) m = 1 , · · · , n (1) Where F ∈ { F (1) 1 , F (1) 2 , . . . , F (1) n , } is a conv olutional filter, with conv olution among an input volume defined b y I = { I 1 , · · · , I D } which it learns to represen t the input b y combining non-linear functions: z m = O m = a ( I ∗ F (1) m + b (1) m ) m = 1 , · · · , m (2) where b (1) m is the bias, and the num b er of zeros we wan t to pad the input with is suc h that: dim(I) = dim(deco de(enco de(I))) Finally , the enco ding conv olution is equal to: O w = O h = ( I w + 2(2 k + 1) − 2) − (2 k + 1) + 1 = I w + (2 k + 1) − 1 (3) 6 Kamran Kowsari et al. The deco ding conv olution step pro duces n feature maps z m =1 ,...,n . The recon- structed results ˆ I is the result of the conv olution b etw een the volume of feature maps Z = { z i =1 } n and this con volutional filters volume F (2) [ 7 , 9 ]. ˜ I = a ( Z ∗ F (2) m + b (2) ) (4) O w = O h = ( I w + (2 k + 1) − 1) − (2 k + 1) + 1 = I w = I h (5) Where Equation 5 sho ws the deco ding conv olution with I dimensions. The input’s dimensions are equal to the output’s dimensions. Results of patch clustering has been summarized in T able 1 . Obviously , patc hes in cluster 1, which were deemed useful, are used for the analysis in this pap er. 3.3 Color Balancing The concept of color balancing for this pap er is to conv ert all images to the same color space to accoun t for v ariations in H&E staining. The images can b e represented with the illuminan t sp ectral p ow er distribution I ( λ ), the surface sp ectral reflectance S ( λ ), and the sensor sp ectral sensitivities C ( λ ) [ 5 , 6 ]. Using this notation [ 6 ], the sensor resp onses at the pixel with co ordinates ( x, y ) can b e th us describ ed as: p ( x, y ) = Z w I ( x, y , λ ) S ( x, y , λ ) C ( λ ) dλ (6) Fig. 3. Some samples of clustering results - cluster 1 includes patches with useful information and cluster 2 includes patches without useful information (mostly created from background parts of WSIs) Diagnosis of Celiac Disease and En vironmental Enteropath y 7 where w is the wa velength range of the visible light sp ectrum, and C ( λ ) are three-comp onen t vectors. R G B out = α a 11 a 12 a 13 a 21 a 22 a 23 a 31 a 32 a 33 × r awb 0 0 0 g awb 0 0 0 b awb R G B in γ (7) where RGB in is raw images from biopsy and RGB out is results for CNN input. In the follo wing, a more compact version of Equation 7 is used: RGB out = ( αAI w .RGB in ) γ (8) where α is exp osure comp ensation gain, I w refers the diagonal matrix for the illuminan t comp ensation and A indicates the color matrix transformation. O r i gina l 0 . 01 0 . 1 1 . 0 10 20 30 40 50 O r i gi na l 0 . 01 0 . 1 1 . 0 10 20 30 40 50 Or i gi na l 0 . 01 0 . 1 1 . 0 10 20 30 40 50 C e li a c D is e a s e ( CD ) N or m a l Environme nt a l Ente r opa t hy ( EE ) Fig. 4. Color Balancing samples for the three classes 8 Kamran Kowsari et al. Figure 4 shows the results of color balancing for three classes (Celiac Dis- ease (CD), Normal and Environmen tal Enteropath y (EE)) with differen t color balancing p ercen tages b etw een 0 . 01 and 50. 4 Metho d In this section, w e describ e Conv olutional Neural Netw orks (CNN) including the con volutional lay ers, p o oling lay ers, activ ation functions, and optimizer. Then, w e discuss our netw ork architecture for diagnosis of Celiac Disease and Envi- ronmen tal Enteropath y . As shown in figure 5 , the input lay ers starts with image patc hes (1000 × 1000) and is connected to the conv olutional la yer ( Conv 1). Con v 1 is connected to the p o oling lay er ( MaxPo oling ), and then connected to Conv 2. Finally , the last conv olutional lay er ( Conv 3) is flattened and connected to a fully connected p erception lay er. The output lay er contains three no des whic h each no de represent one class. 4.1 Con volutional La yer CNN is a deep learning architecture that can b e employ ed for hierarchical image classification. Originally , CNNs were built for image pro cessing with an archi- tecture similar to the visual cortex. CNNs hav e b een used effectively for medical image pro cessing. In a basic CNN used for image pro cessing, an image tensor is con volv ed with a set of kernels of size d × d . These conv olution lay ers are called feature maps and can be stac ked to pro vide multiple filters on the input. The elemen t (feature) of input and output matrices can b e different [ 22 ]. The process to compute a single output matrix is defined as follows: A j = f N X i =1 I i ∗ K i,j + B j ! (9) Eac h input matrix I − i is con volv ed with a corresponding k ernel matrix K i,j , and summed with a bias v alue B j at each element. Finally , a non-linear activ ation function (See Section 4.3 ) is applied to eac h element [ 22 ]. In general, during the back propagation step of a CNN, the weigh ts and biases are adjusted to create effective feature detection filters . The filters in the con volution lay er are applied across all three ’channels’ or Σ (size of the color space) [ 13 ]. 4.2 P o oling Lay er T o reduce the computational complexity , CNNs utilize the concept of p o oling to reduce the size of the output from one la yer to the next in the netw ork. Differ- en t p o oling techniques are used to reduce outputs while preserving imp ortant features [ 31 ]. The most common p o oling method is max p o oling where the max- im um element is selected in the p o oling window. Diagnosis of Celiac Disease and En vironmental Enteropath y 9 In p u t Im a g e s ( 1 0 0 0 × 1 0 0 0 ) Co n v 1 Co n v 3 Co n v 2 F u ll y Co n n e c ted Out p u t Fig. 5. Structure of Conv olutional Neural Net using multiple 2D feature detectors and 2D max-p o oling In order to feed the p o oled output from stack ed featured maps to the next lay er, the maps are flattened into one column. The final lay ers in a CNN are typically fully connected [ 19 ]. 4.3 Neuron Activ ation The implemen tation of CNN is a discriminative trained model that uses standard bac k-propagation algorithm using a sigmoid (Equation 10 ), (Rectified Linear Units (ReLU) [ 26 ] (Equation 11 ) as activ ation function. The output lay er for m ulti-class classification includes a S of tmax function (as shown in Equation 12 ). f ( x ) = 1 1 + e − x ∈ (0 , 1) (10) f ( x ) = max(0 , x ) (11) σ ( z ) j = e z j P K k =1 e z k (12) ∀ j ∈ { 1 , . . . , K } 4.4 Optimizor F or this CNN architecture, the Adam optimizor [ 17 ] which is a sto chastic gradi- en t optimizer that uses only the a verage of the first t wo momen ts of gradient ( v and m , sho wn in Equation 13 , 14 , 15 , and 16 ). It can handle non-stationary of the ob jectiv e function as in RMSProp, while ov ercoming the sparse gradient issue limitation of RMSProp [ 17 ]. θ ← θ − α √ ˆ v + ˆ m (13) g i,t = ∇ θ J ( θ i , x i , y i ) (14) 10 Kamran Kowsari et al. m t = β 1 m t − 1 + (1 − β 1 ) g i,t (15) m t = β 2 v t − 1 + (1 − β 2 ) g 2 i,t (16) where m t is the first momen t and v t indicates second moment that b oth are estimated. ˆ m t = m t 1 − β t 1 and ˆ v t = v t 1 − β t 2 . 4.5 Net work Arc hitecture As shown in T able 2 and Figure 6 , our CNN architecture consists of three con- v olution la yer each follow ed by a p o oling la yer. This mo del receives RGB image patc hes with dimensions of (1000 × 1000) as input. The first conv olutional la yer has 32 filters with kernel size of (3 , 3). Then w e hav e Pooling la yer with size of (5 , 5) which reduce the feature maps from (1000 × 1000) to (200 × 200). The second conv olutional la yers with 32 filters with kernel size of (3 , 3). Then P o oling lay er (MaxPooling 2 D ) with size of (5 , 5) reduces the feature maps from (200 × 200) to (40 × 40). The third con volutional lay er has 64 filters with k ernel size of (3 , 3), and final p o oling lay e r (MaxPooling 2 D ) is scaled down to (8 × 8). The feature maps as shown in T able 2 is flatten and connected to fully connected lay er with 128 no des. The output la yer with three no des to represen t the three classes: (En vironmental Enteropath y , Celiac Disease, and Normal). The optimizer used is Adam (See Section 4.4 ) with a learning rate of 0 . 001, β 1 = 0 . 9, β 2 = 0 . 999 and the loss considered is sparse categorical crossentrop y [ 8 ]. Also for all lay ers, we use Rectified linear unit (ReLU) as activ ation function except output la yer which we use S of tmax (See Section 4.3 ). T able 2. CNN Architecture for Diagnosis of Diseased Duo denal on Biopsy Images La yer (type) Output Shap e T rainable P arameters 1 Conv olutional Lay er (1000 , 1000 , 32) 869 2 Max Pooling (200 , 200 , 32) 0 3 Conv olutional Lay er (200 , 200 , 32) 9 , 248 4 Max Pooling (40 , 40 , 32) 0 5 Conv olutional Lay er (40 , 40 , 64) 18 , 496 6 Max Pooling (8 , 8 , 64) 0 7 dense 128 524 , 416 8 Output 3 387 Diagnosis of Celiac Disease and En vironmental Enteropath y 11 Po o l i n g L ay er Fu l l y Co n n ec t ed L ay er Co n v o l u t i o n al L a y er O u t p u t L ay er Fig. 6. Our Conv olutional Neural Netw orks’ Architecture 5 Empirical Results 5.1 Ev aluation Setup In the research communit y , comparable and shareable p erformance measures to ev aluate algorithms are preferable. How ever, in reality such measures may only exist for a handful of methods. The ma jor problem when ev aluating image clas- sification metho ds is the absence of standard data collection proto cols. Even if a common collection metho d existed, simply choosing different training and test sets can in tro duce inconsistencies in mo del p erformance [ 34 ]. Another challenge with respect to metho d ev aluation is being able to compare differen t p erformance measures used in separate exp erimen ts. Performance measures generally ev alu- ate sp ecific asp ects of classification task performance, and thus do not alwa ys presen t identical information. In this section, we discuss ev aluation metrics and p erformance measures and highligh t wa ys in whic h the p erformance of classifiers can b e compared. Since the underlying mechanics of different ev aluation metrics ma y v ary , un- derstanding what exactly each of these metrics represents and what kind of in- formation they are trying to con vey is crucial for comparabilit y . Some examples of these metrics include recall, precision, accuracy , F-measure, micro-av erage, and macro-av erage. These metrics are based on a “confusion matrix” that com- prises true p ositives (TP), false p ositives (FP), false negatives (FN) and true negativ es (TN) [ 21 ]. The significance of these four elemen ts may v ary based on the classification application. The fraction of correct predictions ov er all predic- tions is called accuracy (Eq. 17 ). The prop ortion of correctly predicted p ositives to all p ositiv es is called precision, i.e. p ositive predictive v alue (Eq. 18 ). 12 Kamran Kowsari et al. accur acy = ( T P + T N ) ( T P + F P + F N + T N ) (17) P r ecision = P L l =1 T P l P L l =1 T P l + F P l (18) Recal l = P L l =1 T P l P L l =1 T P l + F N l (19) F 1 − S cor e = P L l =1 2 T P l P L l =1 2 T P l + F P l + F N l (20) 5.2 Exp erimen tal Setup The following results were obtained using a combination of central pro cessing units (CPUs) and graphical pro cessing units (GPUs). The pro cessing w as done on a X eon E 5 − 2640 (2 . 6 GH z ) with 32 cores and 64 GB memory , and the GPU cards were t wo N v idia T itan X p and a N vidia T esla K 20 c . W e implemen ted our approac hes in Python using the Compute Unified Device Architecture (CUDA), whic h is a parallel computing platform and Application Programming Inter- face (API) mo del created by N v idia . W e also used Keras and T ensorFlow li- braries for creating the neural net works [ 2 , 8 ]. 5.3 Exp erimen tal Results In this section we show that CNN with color balancing can improv e the ro- bustness of medical image classification. The results for the mo del trained on 4 differen t color balancing v alues are sho wn in T able 3 . The results shown in T a- ble 4 are also based on the trained mo del using the same color balancing v alues. Although in T able 4 , the test set is based on a differen t set of color balancing v alues: 0 . 5 , 1 . 0 , 1 . 5 and 2 . 0. By testing on a differen t set of color balancing, these results show that this technique can solve the issue of multiple stain v ariations during histological image analysis. As shown in T able 3 , the f1-score of three classes (Environmen tal Enteropa- th y (EE), Celiac Disease (CD), and Normal) are 0 . 98, 0 . 94, and 0 . 91 resp ectiv ely . In T able 4 , the f1-score is reduced, but not by a significan t amount. The three classes (Environmen tal En teropathy (EE), Celiac Disease (CD), and Normal) f1-scores are 0 . 94, 0 . 92, and 0 . 87 resp ectively . The result is very similar to MA. Boni et.al [ 3 ] which achiev ed 90.59% of accuracy in their mo de, but without using the color balancing tec hnique to allow differently stained images. In Figure 7 , Receiv er op erating characteristics (ROC) curves are v aluable graphical to ols for ev aluating classifiers. How ev er, class imbalances (i.e. differ- ences in prior class probabilities) can cause R OC curv es to p o orly represent the classifier p erformance. ROC curve plots true p ositive rate (TPR) and false p osi- tiv e rate (FPR). The R OC shows that A UC of En vironmen tal Enteropath y (EE) is 1 . 00, Celiac Disease (CD) is 0.99, and Normal is 0.97. Diagnosis of Celiac Disease and En vironmental Enteropath y 13 T able 3. F1-score for train on a set with color balancing of 0.001, 0.01, 0.1, and 1.0. Then, we ev aluate test set with same color balancing precision recall f1-score supp ort Celiac Disease (CD) 0 . 89 0 . 99 0 . 94 22 , 196 Normal 0 . 99 0 . 83 0 . 91 22 , 194 En vironmental Enteropath y (EE) 0 . 96 1 . 00 0 . 98 22 , 198 T able 4. F1-score for train with color balancing of 0.001, 0.01, 0.1, and 1.0 and test with color balancing of 0.5, 1.0, 1.5 and 2.0 precision recall f1-score supp ort Celiac Disease (CD) 0 . 90 0 . 94 0 . 92 22 , 196 Normal 0 . 96 0 . 80 0 . 87 22 , 194 En vironmental Enteropath y (EE) 0 . 89 1 . 00 0 . 94 22 , 198 Fig. 7. Receiv er op erating characteristics (ROC) curv es for three classes also the figure sho ws micro-av erage and macro-a verage of our classifier As shown in T able 5 , our mo del p erforms b etter compared to some other mo dels in terms of accuracy . Among the compared mo dels, only the fine-tuned ALEXNET [ 27 ] has considered the color staining problem. This mo del prop oses a transfer learning based approach for the classification of stained histology images. They also applied stain normalization before using images for fine tuning the mo del. 14 Kamran Kowsari et al. T able 5. Comparison accuracy with different baseline metho ds Metho d Solv e Color Staining Problem Mo del Arc hitecture Accuracy Shifting and Reflections [ 3 ] No CNN 85.13% Gamma [ 3 ] No CNN 90.59% CLAHE [ 3 ] No CNN 86.79% Gamma-CLAHE [ 3 ] No CNN 86.72% Fine-tuned ALEXNET [ 27 ] Y es ALEXNET 89.95% Ours Y es CNN 93.39% 6 Conclusion In this pap er, we prop osed a data driven mo del for diagnosis of diseased duo- denal arc hitecture on biopsy images using color balancing on conv olutional neu- ral netw orks. V alidation results of this mo del show that it can b e utilized by pathologists in diagnostic op erations regarding CD and EE. F urthermore, color consistency is an issue in digital histology images and different imaging systems repro duced the colors of a histological slide differently . Our results demonstrate that application of the color balancing technique can attenuate effect of this issue in image classification. The metho ds describ ed here can b e improv ed in multiple wa ys. Additional training and testing with other color balancing techniques on data sets will con- tin ue to identify architectures that work b est for these problems. Also, it is p os- sible to extend the mo del to more than four different color balance p ercen tages to capture more of the complexit y in the medical image classification. Ac kno wledgements This research was supp orted b y Univ ersity of Virginia, Engineering in Medicine SEED Grant ( S S & D E B ), the Universit y of Virginia T ranslational Health Researc h Institute of Virginia ( T H R I V ) Mentored Career Developmen t Award ( S S ), and the Bill and Melinda Gates F oundation ( AA, O P P 1138727; S RM , O P P 1144149; P K, O P P 1066118) References 1. Who. c hildren: reducing mortalit y . fact sheet 2017. h ttp://www.who.int/ mediacen tre/factsheets/fs178/en/ . Accessed: 2019-1-30 2. Abadi, M., Agarwal, A., Barham, P ., Brevdo, E., Chen, Z., Citro, C., Corrado, G.S., Da vis, A., Dean, J., Devin, M., et al.: T ensorflow: Large-scale machine learning on heterogeneous distributed systems. arXiv preprint arXiv:1603.04467 (2016) 3. Al Boni, M., Syed, S., Ali, A., Mo ore, S.R., Brown, D.E.: Duo denal biopsies classi- fication and understanding using con volutional neural net works. American Medical Informatics Asso ciation (2019) Diagnosis of Celiac Disease and En vironmental Enteropath y 15 4. Bejnordi, B.E., V eta, M., V an Diest, P .J., V an Ginnek en, B., Karssemeijer, N., Litjens, G., V an Der Laak, J.A., Hermsen, M., Manson, Q.F., Balk enhol, M., et al.: Diagnostic assessment of deep learning algorithms for detection of lymph no de metastases in women with breast cancer. Jama 318 (22), 2199–2210 (2017) 5. Bianco, S., Cusano, C., Napoletano, P ., Sc hettini, R.: Improving cnn-based texture classification by color balancing. Journal of Imaging 3 (3), 33 (2017) 6. Bianco, S., Sc hettini, R.: Error-toleran t color rendering for digital cameras. Journal of mathematical imaging and vision 50 (3), 235–245 (2014) 7. Chen, K., Seuret, M., Liwicki, M., Henneb ert, J., Ingold, R.: Page segmentation of historical do cument images with conv olutional auto enco ders. In: Do cumen t Analysis and Recognition (ICDAR), 2015 13th International Conference on, pp. 1011–1015. IEEE (2015) 8. Chollet, F., et al.: Keras: Deep learning library for theano and tensorflo w. https: //k eras.io/ (2015) 9. Geng, J., F an, J., W ang, H., Ma, X., Li, B., Chen, F.: High-resolution sar image classification via deep conv olutional auto encoders. IEEE Geoscience and Remote Sensing Letters 12 (11), 2351–2355 (2015) 10. Go odfellow, I., Bengio, Y., Courville, A., Bengio, Y.: Deep learning, vol. 1. MIT press Cambridge (2016) 11. Gulshan, V., Peng, L., Coram, M., Stumpe, M.C., W u, D., Nara yanasw amy , A., V enugopalan, S., Widner, K., Madams, T., Cuadros, J., et al.: Developmen t and v alidation of a deep learning algorithm for detection of diab etic retinopathy in retinal fundus photographs. Jama 316 (22), 2402–2410 (2016) 12. Hegde, R.B., Prasad, K., Hebbar, H., Singh, B.M.K.: Comparison of traditional image pro cessing and deep learning approaches for classification of white bloo d cells in p eripheral bloo d smear images. Bio cyb ernetics and Biomedical Engineering (2019) 13. Heidarysafa, M., Kowsari, K., Bro wn, D.E., Jafari Meimandi, K., Barnes, L.E.: An impro vemen t of data classification using random multimodel deep learning (rmdl) 8 (4), 298–310 (2018). DOI 10.18178/ijmlc.2018.8.4.703 14. Hou, L., Samaras, D., Kurc, T.M., Gao, Y., Davis, J.E., Saltz, J.H.: Patc h-based con volutional neural net work for whole slide tissue image classification. In: Pro- ceedings of the IEEE Conference on Computer Vision and Pattern Recognition, pp. 2424–2433 (2016) 15. Husb y , S., et al.: Europ ean so ciety for p ediatric gastro en terology , hepatology , and n utrition guidelines for the diagnosis of co eliac disease. Journal of p ediatric gas- tro en terology and n utrition 54 (1), 136–160 (2012) 16. Ker, J., W ang, L., Rao, J., Lim, T.: Deep learning applications in medical image analysis. IEEE Access 6 , 9375–9389 (2018) 17. Kingma, D., Ba, J.: Adam: A metho d for sto chastic optimization. arXiv preprint arXiv:1412.6980 (2014) 18. Ko wsari, K., Bro wn, D.E., Heidarysafa, M., Meimandi, K.J., Gerb er, M.S., Barnes, L.E.: Hdltex: Hierarchical deep learning for text classification. In: 2017 16th IEEE In ternational Conference on Machine Learning and Applications (ICMLA), pp. 364–371. IEEE (2017) 19. Ko wsari, K., Heidarysafa, M., Brown, D.E., Meimandi, K.J., Barnes, L.E.: Rmdl: Random m ultimo del deep learning for classification. In: Pro ceedings of the 2nd In- ternational Conference on Information System and Data Mining, pp. 19–28. ACM (2018) 16 Kamran Kowsari et al. 20. Ko wsari, K., Jafari Meimandi, K., Heidarysafa, M., Mendu, S., Barnes, L., Brown, D.: T ext classification algorithms: A survey . Information 10 (4) (2019). DOI 10.3390/info10040150 21. Lev er, J., Krzywinski, M., Altman, N.: Poin ts of significance: Classification ev alu- ation (2016) 22. Li, Q., Cai, W., W ang, X., Zhou, Y., F eng, D.D., Chen, M.: Medical image classifi- cation with con volutional neural netw ork. In: 2014 13th In ternational Conference on Control Automation Rob otics & Vision (ICARCV), pp. 844–848. IEEE (2014) 23. Liang, H., Sun, X., Sun, Y., Gao, Y.: T ext feature extraction based on deep learn- ing: a review. EURASIP journal on wireless communications and netw orking 2017 (1), 211 (2017) 24. Litjens, G., Kooi, T., Bejnordi, B.E., Setio, A.A.A., Ciompi, F., Ghafo orian, M., V an Der Laak, J.A., V an Ginneken, B., S´ anc hez, C.I.: A survey on deep learning in medical image analysis. Medical image analysis 42 , 60–88 (2017) 25. Masci, J., Meier, U., Cire¸ san, D., Schmidh ub er, J.: Stac ked conv olutional auto- enco ders for hierarchical feature extraction. In: International Conference on Arti- ficial Neural Netw orks, pp. 52–59. Springer (2011) 26. Nair, V., Hinton, G.E.: Rectified linear units improv e restricted b oltzmann ma- c hines. In: Pro ceedings of the 27th international conference on machine learning (ICML-10), pp. 807–814 (2010) 27. Na waz, W., Ahmed, S., T ahir, A., Khan, H.A.: Classification of breast cancer histology images using alexnet. In: International Conference Image Analysis and Recognition, pp. 869–876. Springer (2018) 28. Na ylor, C., Lu, M., Haque, R., Mondal, D., Buonomo, E., Nay ak, U., Mychalec kyj, J.C., Kirkpatric k, B., Colgate, R., Carmolli, M., et al.: En vironmental en teropathy , oral v accine failure and gro wth faltering in infan ts in bangladesh. EBioMedicine 2 (11), 1759–1766 (2015) 29. Nobles, A.L., Glenn, J.J., Kowsari, K., T eachman, B.A., Barnes, L.E.: Identifica- tion of imminent suicide risk among young adults using text messages. In: Pro- ceedings of the 2018 CHI Conference on Human F actors in Computing Systems, p. 413. ACM (2018) 30. Rumelhart, D.E., Hinton, G.E., Williams, R.J.: Learning internal representations b y error propagation. T ec h. rep., California Univ San Diego La Jolla Inst for Cognitiv e Science (1985) 31. Sc herer, D., M ¨ uller, A., Behnk e, S.: Ev aluation of po oling op erations in conv o- lutional architectures for ob ject recognition. Artificial Neural Netw orks–ICANN 2010 pp. 92–101 (2010) 32. Sy ed, S., Ali, A., Duggan, C.: En vironmental enteric dysfunction in children: a review. Journal of p ediatric gastro enterology and nutrition 63 (1), 6 (2016) 33. W ang, W., Huang, Y., W ang, Y., W ang, L.: Generalized autoenco der: A neural net work framework for dimensionality reduction. In: Pro ceedings of the IEEE conference on computer vision and pattern recognition w orkshops, pp. 490–497 (2014) 34. Y ang, Y.: An ev aluation of statistical approaches to text categorization. Informa- tion retriev al 1 (1-2), 69–90 (1999) 35. Zhai, S., Cheng, Y., Zhang, Z.M., Lu, W.: Doubly conv olutional neural netw orks. In: Adv ances in neural information pro cessing systems, pp. 1082–1090 (2016) 36. Zhang, J., Kowsari, K., Harrison, J.H., Lob o, J.M., Barnes, L.E.: Patien t2vec: A p ersonalized in terpretable deep representation of the longitudinal electronic health record. IEEE Access 6 , 65,333–65,346 (2018)
Original Paper
Loading high-quality paper...
Comments & Academic Discussion
Loading comments...
Leave a Comment