Point Cloud Rendering after Coding: Impacts on Subjective and Objective Quality
Recently, point clouds have shown to be a promising way to represent 3D visual data for a wide range of immersive applications, from augmented reality to autonomous cars. Emerging imaging sensors have made easier to perform richer and denser point cl…
Authors: Alireza Javaheri, Catarina Brites, Fern
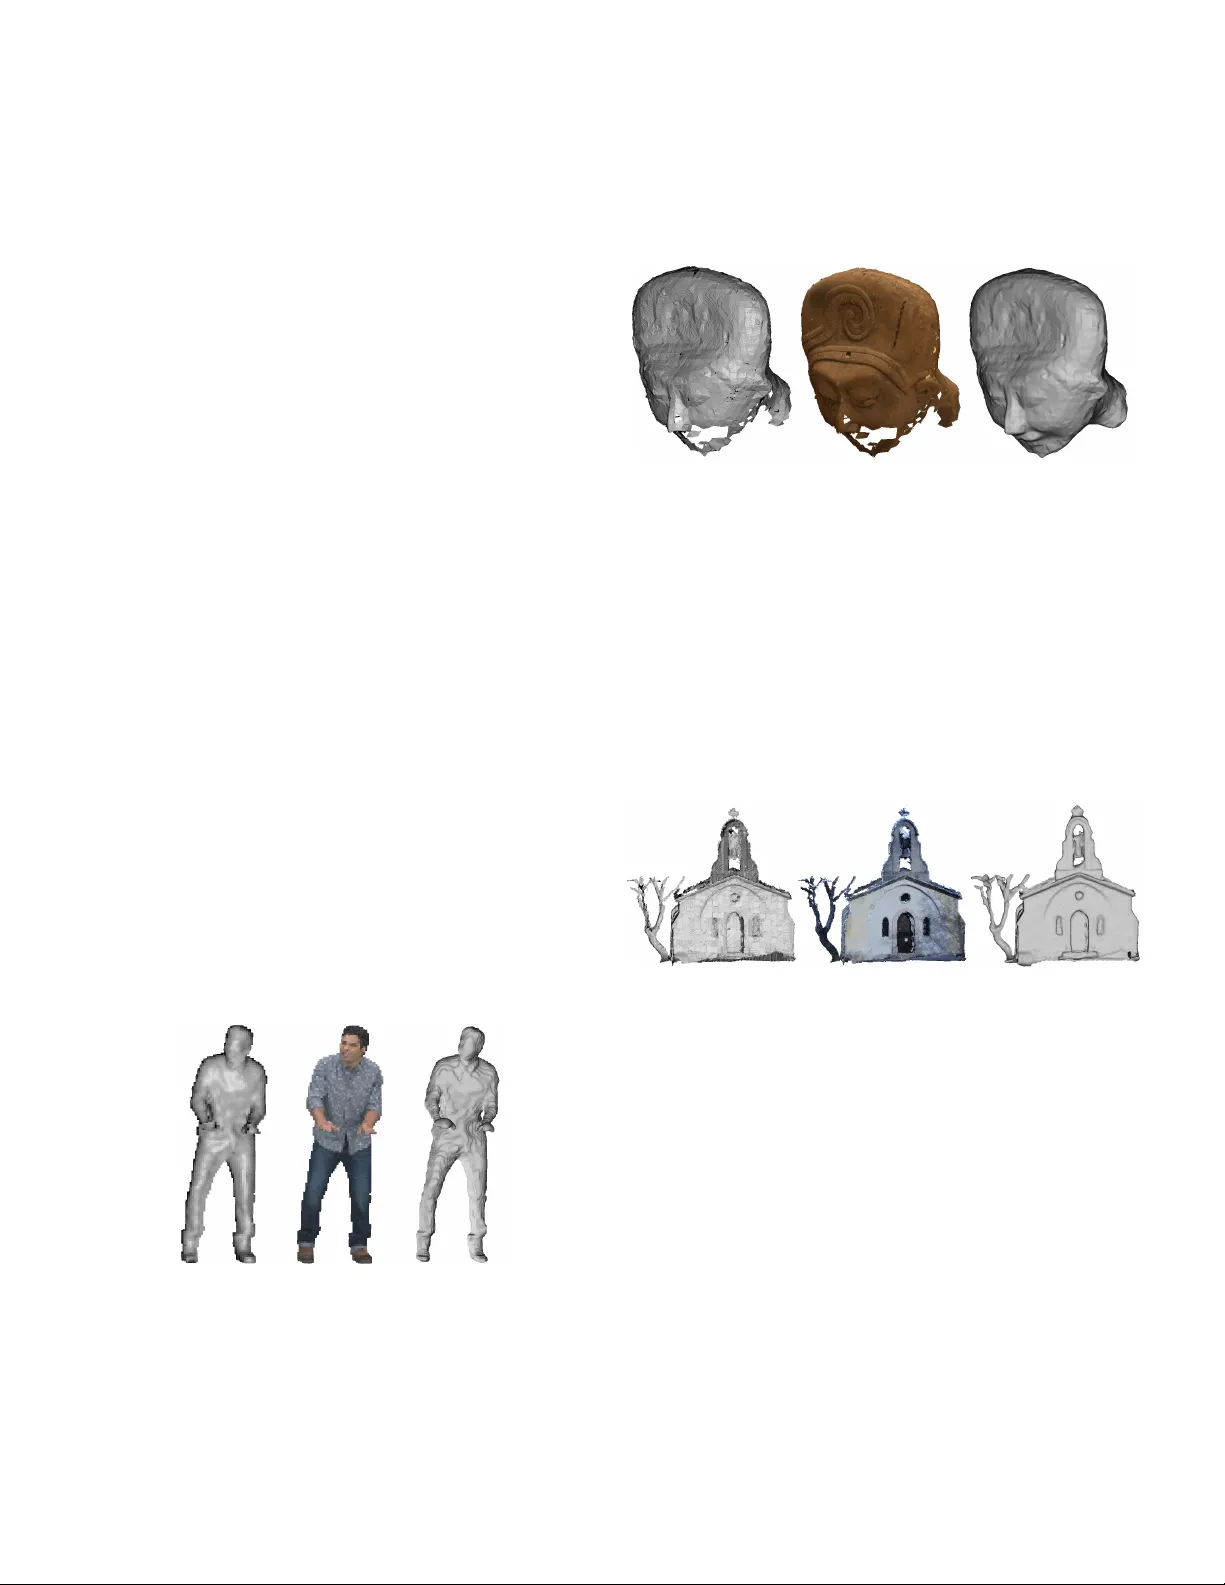
> REPLACE THIS LINE WITH YOUR PAPER IDENTIFICATION NU MBER (DOUBL E - CLICK HERE TO EDIT) < 1 Abstract — R ecently , p oint cloud s have shown to be a promising way to represent 3D visual data for a wide range of immersive applications , from augmented reality to autonomous cars. Emerging imaging sen sors have made easier to perfor m richer a nd denser point cloud acquisiti on, notably wit h mil lions of points, thus raising the need for efficient point cloud coding sol utions. I n such scenario, it is important to evaluate the impact and performance of several processing steps in a po int cloud communication system, notably the degradation s associated to point cl oud codi ng solutions . Moreove r , since point cl ouds are not directly vi sualized but rather processe d with a render ing algorithm before shown o n any dis play , t he perceived qua lity o f point cloud data highly depends on the rendering solution. In this context, the main objective of this paper is to study the impact of several coding and rendering solutions on the perceived user quality and in the performance of avail able objective assessment metric s . Another contribut ion regards the assessment of recent MPEG po int cloud coding sol uti ons for s evera l p opul ar r ende ring methods which wa s never p resented before . Th e conclusions regard the visibility of three types of coding artifacts for the three considered rendering approaches as well as the strengths and weakness of objective metrics when point clouds a re render e d after coding. Index Terms — point cloud coding , qu ality assessment, subject ive quality assessment, rendering I. I NTRODUCTION OWADAYS , emerging 3D visual representations allow ing more immersive experiences compared to the classical 2D images or video s are attract ing much interest . In fact, a new wave of multimedia applications are now possible, fr om geographical information systems , and virtual and augmented reality to cultural heritage and free viewpoint broadcasting , motivated by the recent advances in 3D acquisition systems [1] . In this context, point clouds are becoming a n important 3D visual representation format of the real world due to the availability of several acquisition devices (from range sensors to multi -c amera arrays) as well as efficient co ding solutions and rendering techniques. A point cl oud (PC) is a set of 3D points represent ed by their 3D coordinates and associated attributes, such as col or , normals and reflectance. PCs can be classified with respect to their temporal evo lution. While static PC s correspond to a single time instant, dynamic PC s correspond to a PC evolving along time, thus corresponding to a sequence of static PC frames. Also, progressive PC s correspond to large - scale PC s that are not c onsumed al l at once and thus are made from complementary parts of a visual scene; these parts are static PCs that differ both spatially and /or temporally (often used in autonomous driving ). To represent the visual scene with high fidelity, a PC can have se veral millions or even billions of point s , whic h results in a large amount of data that ne eds to be efficiently stored and transmitted. Thus, co di ng technologies are essential to deal with the huge amount of data that PC acquisi tion devices can generate. The coding solutions already available [2] - [5] can be lossy or lossless and aim to reduce the PC representat ion bitrate while keeping the data fi delity as high as possible. F ollowing the demands by the industry, both the Joint Photographic Experts Group ( JPEG ) and the Moving Picture Experts Group ( MP EG ) standardization bodies re cognized that the PC form at can address future immersive multimedia app lications and have initiated projects in the area of PC coding [6][7][8] . In January 2017, MPEG ha s is sued a Cal l fo r Pr oposals on Point Cloud Compression (P CC) [9] , targeting the efficient representation of static objects and scenes, as well as dynamic objects and r eal - time environments. After this call, two PC coding solutions have been developed, notabl y the so - called Geometry - based Point Cloud Compressio n (G - PCC) standard [10] , for static and progressive acquired content and Video - based Point Cloud Compression (V - PCC) [11] standard , for dynamic con tent. Naturally, PC quality asse ssment is f undamental t o evaluate the performance of the sev eral processing steps in PC - based appl ications , notably denoising, coding and rendering. Moreover, subject ive quali ty asses sment proc edures an d objective assessment metr ics that can acc urately evaluate the perceived quality , notably when PC data is compressed , are much needed. Both are critica l to improve the final Quality of Experience (QoE) offered to the end - users , not only to monitor the qual ity of the experiences but also to allow the design and optimization of novel PC coding techniques. PCs can be visualized on a variety of devices, such as 2D displays, head - mounte d disp lays (HMDs), au gmented reality devices and even on stereoscopic or multi - stereoscopic displays. However, in dependently of the typ e of display , PCs cannot be directly visualized and require a rendering technique to create t he data that may be vi sualized ; this can be seen as a post - processing step after decodi ng. Nowadays, there are multiple PC rendering approaches [12] [13] that may significantly influence the perce ived PC quality in different ways. While there are several subjective and objective quality evaluation studies available in the literature , the y do no t use the same type of coding and rendering solutions as well as test conditions and thus, rather often , reach different conclusions. Therefore, it is critical to study the impact of different rendering approaches on the subjective and objective decoded PC quality . On the other hand, many relevant pas t work s on subjective and objective quality assessment [14] - [20] rel y on simple codi ng solutions such as octree pruning , which are inefficient and produce a rather distinctive type of artifacts. However, more sophisticated and also more ef ficient lossy PC co ding solutions Point Cloud Rendering after Coding : Impacts on Subjective and Objective Quality A. Javaheri, C. Brites, Member , IEEE , F. Pereira , Fellow , IEEE , J. Ascenso, Senior Member, IEEE N The authors are with the Instituto Superior T é cnico and Instituto de Telecomunica ções , 1049 - 001 Lisboa Portugal {email: alireza.javaheri@lx.it.pt , catarina.brites@lx.it.pt , fp@lx.it.pt , joao.ascenso@l x.it.pt } > REPLACE THIS LINE WITH YOUR PAPER IDENTIFICATION NU MBER (DOUBL E - CLICK HERE TO EDIT) < 2 are now available , which produce decode d PCs with very different characteris tics and artifacts. As an example, some PC codecs significantly increase the number of decoded points to hide coding artifacts , thus achieving a better perceived qua lity. This makes the subjective and objective quality assessment of PCs more complex, especiall y when more e fficien t coding and rendering solutions are considered. While PCs have common ly two maj or compon ents, geometr y and color (or texture), t his paper focus on the qual ity impact s of degradations on the geometry component of the point cloud representation. Geometric artifa cts a re ve ry i mportant for the final perceived quality since this type of degradations may reduce the realism of the decoded geometry, e.g. due to the appearance of holes and deformed and noisy surfaces, consequently leading to poorer user immersion. Fig. 1 shows an example of geometric artifacts, in this case associated to the MPEG G - PCC codec (original texture was used for recoloring), which cl early r esults in a rather low perceived quality. Despite its importance to the perceived quality, geometric degradations have not been addressed mu ch in the literature before. B esides, while the geomet ry is an intri nsic component of the PC represen tation, the color attributes (which are optional) may not be available due to li mitations i n the acquisition process, e.g. PCs acquired by LIDAR only devices. Fig. 1 . Arco Valentino PC : left) original PC; and right) MPEG G - PCC decoded PC . Original texture use d for recoloring. In this context, t he objecti ve of this paper is to study in a subjective way, the impact of the different artifacts produced by state - of - the - art PC codecs for diff erent types of rendering and assess objective PC ge ometry metrics in several scenarios . This is the first time that the rendering ! and coding " processes , which play a major role on t he final perceived quality , a re jointly evaluated in this case for static point c louds . To be a ble to isol ate and, thus, directl y assess the impact of the geometric artifacts on the perceived quality, no color attributes coding was considered in this work. In this context, the main contributions are : • PC r endering after coding – subjective quality assessment: Study of the subjective quality impact of multiple #!$ " % combinations for relevant, lossy PC cod ing and rendering solutions. Moreover, the visibility of the distortions associated to each codec under different renderi ng sc enarios will be analyzed . This first co ntribution is critical for the design of a suitable PC subjective assessment methodolog y , where a rendering solution must be chosen. • PC r endering after coding – objective metrics assessment: Evaluat ion of the performance of available PC objective metrics for multiple # ! $ " % combinations , i.e. for different type s of rendering and coding artifacts. This should allow understand ing the strengths and weakness es of available objective metrics as well as their scop e of val idity, i.e. for which conditio ns these metrics represent well enough the human perceived quality. Th is sec ond contribution is critical for the design of more reliable PC objec tive metrics , n otably for the evaluation of new PC coding solutions as we ll as associated techniques . • Rendered Point Cloud Quality Assessment Dataset : Provision of the fir st public dataset of mean opinion scores (MOS) and corresponding PCs coded with relevant, lossy PC coding solutions. These PC codecs produce a distinctive set of artifacts that were not considered when the popular PC metrics were desi gned. This third contributio n is particular ly important for the young PC quality assessment community, since not many subjective studies are available, and from the ones available, none allows to assess the impact of the rendering process that is always performed after dec oding. This paper is organized as follows. Se ction II reviews the related work while Section III describe s three key PC co ding and rendering solutio ns , which are used for the following experiments. Section IV describes the subjective evaluation study along with some key conclusions . Section V aims to evaluate the most relevant PC objective metri cs. S ection V I presents some final remarks and , finally, Section VII presents challenges and proposes possible ways forward towards the advancement of this technical area . II. R ELATED W ORK In the literature, there are several subjective and objective PC quality assessment methods and studies available. In [21] , Zhang et al. designed a s ubjective test for colored PCs under differ ent levels of degradation of both geometry and col or. The qualit y degradations have been introduced by down - sampling the geometry and independently adding (synthetic) uniform noise for both color and geometry. The main conclus ion wa s that human percepti on is more tolerant to color no ise compared to geometry noise in PCs . In [22] , Meku ria et al. conducted the subjective evaluation of a PC codec based on geometry octree pruning and JPEG based a ttribute s coding. The subj ective evaluation was performed in a mixed real ity sys tem , combin ing coded PC data (acquired) and computer graphic s generated 3D content. In the subjecti ve test, the users could interact with the content by navigating a visual scene with an avatar. The system performance was globally assessed with a questionnaire addressing eight different qualit y aspects, notably realism, immersiveness and color quality. Two objective metrics (mean squared error b ased) w ere introduced to assess both the geometr y and color qualit ies . However, the correlation between objective metrics and s ubjective results was not assessed. In [23] , Javaheri et al. performed the subjective and objective quality assessment of denoi sing algorithms for PC geometry. To introduce geometry errors in clean , reference P Cs, impulse noise and Gaussian noise with three differ ent strengths were added to represent three dif ferent perceptual quali ties. Several outlier > REPLACE THIS LINE WITH YOUR PAPER IDENTIFICATION NU MBER (DOUBL E - CLICK HERE TO EDIT) < 3 removal and regularization algorithms were applied to the degraded PCs. Noisy and denoised PCs were rendered on standard 2D displays by first applying a surface reconstruction method (i.e. PC converted to polygonal meshes). Also, several objective metrics were selected to assess their performance in a denoising cont ext . In a later study [24] , Javah eri et al. performed the subjective and objective quality assessment of the geometry of compressed PCs. In this case, the popular P oint C loud L ibrary (PCL) octree and graph - based codecs , with t wo very different types of associated distortions , were used. The render ing was performed with a point - based representation , recoloring each decoded point with the original color attributes. In both these works, PCs were visualized on a 2D display a nd a Double - Stimulus Impairment Scale (DSIS) method was used for subjective quality assessment. In [14] , Ale xiou et al . performed a subjective quality assessment s tudy of the PC geometry for two types of degradation , octree pr u ning and Gaussian noise, thus generat ing PCs wi th different qualit y levels and artifacts. A n augmented reality (AR) headset was used to visualize simple PC objects without c olor from different perspectives (user could move around the object). It was concluded that objective metrics could perform well for Gaussian noise but underperform for PCL - like compression artif acts. In [15] and [16] , Alexiou et al. also performed a subjective test with the same data as in [14] and the same distor tion types but visualized on a 30 - inch 2D display. In both cases, color was not used and user interaction was al lowed; a simple rendering method with unit size points was selected. In [15] , the impact of adopting two different subjective test methodologi es , Absolut e Category Rating (ACR ) and DSIS , was studied through their compari son . The DSIS methodology was found more consistent and with lower confidence intervals and , thus, it was used later in [16] . In [17] , Al exiou et al. performed a subjective study to evaluate the PC geometry quality using an octree pruning based codec. Before rendering, a Poisson surface reconstruction algorithm was used to obtain a mesh from the decoded PCs. In this case, no interaction was allowed wit h the content and the subjective experiment also followed the DSIS methodology . It was fou nd that most PC obj ective metrics have a low correlation with the subjective scores and the 3D surface reconstruction algorithm plays a crucial role on the subjective scores obtained. In [18] , Alexiou et al. performed two subjective test s to study the impact of visualization on the subjective quality assessment of PCs. The first test used a 30 - inch 2D display and the second an AR headset. As befor e , geometric artifacts associated to octree coding and Gaussian noise were used . The test methodology wa s DSIS and i nteract ion by users was not allowed. In any cas e, the correlation between scores obtained with different visual ization devices was rather high , notably statistically equivalent for Gaussian noise. In [19] , Alexiou et al. conducted a subjective eval uation to assess the quality of compressed PCs r endered as mesh objects in several types of 3D displays, from passive stereosco pic to auto - stereoscopic displays. Geometry degradations in the form of oct ree pruni ng we re eval uated in the absence of color. The results obtained with 3D displays have a strong correlation with the results obtained with 2D displays for the same content. However, it was also found that the rendering method may play a significant role in thi s evaluation. Also, Alexiou et al. have benchmarked objective metrics for PC data represented by octree pruning and corrupted with Gaussian noise [20] . Both DSIS and ACR methodolo gies were used in separa te sess ions. It was found that the correlation between subjective and objective scores was low for distance - based objective metrics for octree - based compression artifact s , but better corr elation perfor mance could be achieved with metrics consider ing the normal at each point. In [25] , Christaki et al . , perform ed a subjective study for simple PCs , that we re converted to mesh es and coded with suitable open - source mesh codecs . Whi le some of the test PC s are common w i th the PCs often used in previous subjective quality evaluation studies (e.g. Bunny ) others were obtained with a platform designed for 3D human capture (with multiple Kinec t devices). In [25] , a variant on the pairwise subjective test methodology was used for evalu ation with thre e sti mul i presented simultaneously. Overall , three mesh codecs were considered, and content was displayed with a virtual realit y ( VR ) application in a head - mounted display. They conclud ed that usual 3D mesh metrics have a low correlation per formance in this scenario and the 3D mesh surface reconstruction method plays an important role . Finally, Dumic et al. p resented in [26] the state - of - the - art on PC subjective quality evaluation as well as a summary on the available PC objective metrics. In many of studies reviewed above , it is concluded that the rendering process , a pplied after decodi ng , can have a significant impact on the perceived quality by the users; however , there is no solid assessment or quantification of the differences between rendering methods. Mor eover, realistic distortions produced by relevant coding solutions are not often used, e.g. compression artifacts have been ar tificially simulated by noise addition or coding solutions that are much less efficient , compared to the MPEG PC codecs . Also , all the previous studies on PC quality assessment do not follow a common set of test conditions, such as those defined by t he MP EG and JPEG standardization bodies. Finally, many previous wor ks just focus on a single type of objective metri cs. These limitat ions and simplifications are overcome by this paper which precisely targets to study the impact of the rendering process on the perceived quality and objective metrics accuracy for recent, efficient coding solutions, under meaningful test conditions, for a wide range o f objective metrics. T his should guide future developments in the areas of subjective and objective PC quality assessment. III. P OINT C LOUD C ODI NG AND R ENDERING S OLUTIONS T his section first describes three popular rendering solutions , used later for subjective and objective assessment . Th en , three well - known state - of - the - art PC codecs are reviewe d, and the associated PC coding artifacts are characterized . A. Selected Point Cloud Rendering Soluti ons PC rendering is the process of producing a visual representation that can be consumed by users using an available display, e.g. conventional 2D, st ereo, auto - stereoscopic, head - mounted displays, etc. [27] . Since it effectively selects the information to be seen, the rendering process has a significant > REPLACE THIS LINE WITH YOUR PAPER IDENTIFICATION NU MBER (DOUBL E - CLICK HERE TO EDIT) < 4 impact on the quality perceived by the user. In this section, the rendering solutions selected for the experiments re ported in this paper are briefly described. Regarding PC rend ering, there are two main a pproaches; the first, directly uses the PC data (point - based) while the second converts the PC data into another r epresentation format, very commonly a surface, e.g. a polygonal mesh. The decision on the rendering approach to adopt mostly depends on the application requirements which may be very differe nt. The PC conversion to another repre sentation format more rendering friendly may bring some information loss and, in so me cases, it may not even be possible due to the complexity of the visual scene in terms of geometry or the l ow PC density. By directly rendering PCs, massive amounts of points can be visualized. Rather often, these PCs do not fit into t he available memo ry and require special algorithms to stream, process and render only a small subset of the entire PC data. This is easier to perform with a poi nt - based model due t o the lower complexity associated to the rendering process in comparison to a polygonal mesh representation where surface reconstruction and interpolation are usually ne eded. Independently of the rendering approach, a geometry shader with some primiti ves is employed to construct the fina l image shown to the user. In this context, the geom etry shad er is responsible for the creation of appropriate levels of light, darkness, and color within an image [28] . For PCs only with geometry, the shading is commonly perf ormed with a single color; otherwise, color attributes are used for each point or vertex. Moreover, primitives are the simplest (atomic) elements that are combined to create the 3D impression of surface in the final displayed content. 1) Po int - based Rendering without Color Attributes Point - based rendering algorithms use a set of discrete points that may be irregularly distributed , simple rendering primitives and 3D/ image space interpolation procedures to obtain a 2D image. The main advantage of this rendering approach is that it can achieve high levels of realism and is adequate for complex objects, such as trees, feathers, smoke, water, etc. In addition, point based rendering simplifies t he rendering process and typically requires less memor y and computational power due to the lack of connectivity info rmation. In this approach, simple and fast to render primitives are selected, such as circles, squares, spheres, cubes. Based on the PC de nsity and distance to the virtual camera (zoom level), t he size of the primitives can be manually or automatically adjusted to create the impression of a surface; in the auto matic case, connectivity information between points is usually computed to determine the primitive size [24] . The definition of an appropriate size f or the primitive is rather important to reduce the appearance of empty spaces (holes) between p oints (size too small) or aliasing artifacts (size too lar ge). In this work, the primitive selected for rendering was a square because they are similar to the smallest element of a 2D image (pixels) and t he point size was set to the minimum value able to fill the 3D space between points completely, thus avoidi ng holes. Regarding shading, color attributes we re not used, in order the impact of geometry distortions may be assessed without any additional component. The human visual system can easily and accurately derive the three - dimensional orientation of surfaces by using variations in the i mage intensi ty alone [29] . To obtain the normals, a (best fitting) plane was used as the local surface model and an a utomatic estimati on for the ne ighborhood radius was used, as su ggested i n [17] . This automatic estimation helps to find a suitable radius as a to o small radius may result in some points having an invalid normal and a too l arge radius may result into smoothed edges. By fitting a local s urface, only the direction of the normal can be computed and, thus, the orientation of the normal was determined with the minimum spanning tree algorithm [30] . This type of rendering approach wil l be designated as RPoint in the following. 2) Point - based Rendering with Color Attr ibutes The second renderi ng solution i s still p oint - based but uses also the available color attributes and thus for this reason, it will be designated as RCol or in the following. In RColor , the RPo int rendering method is again applied but the point color attributes are used. This means that the surface is still represented with points and displayed with the same primitives but with the color obtained during the PC acquisiti on process. While the color attributes correspond to the real color of the objects, they are still influenced by the specific light conditions that have occurred during t heir acquisition. However, in the f inal rendered image , some colors can be interpolated, e.g. between points, to avoid aliasing. Moreover, since the captured color also conveys t he object depth, it may mask some geometric distorti ons of t he surface. On the contrary, distortions may be mo re visible at object boundaries, which gi ve the user , the shape perception of the objects in the visual scen e. In this work , to isolate the impact of geome tric distortions, the color attribut es are not compressed and , thus , the original color is used to recolor th e decoded PC . The recoloring process occurs when the number of points in the decoded point cloud is different (or the same) from the original num ber of points . The recoloring procedure uses the original color and performs a mapping of the original colors in the original posit ions to the decoded points positions. In this case, the vertex attribute transfer method available in MeshLab was used for the recoloring process. Moreover, i n the adopted RColor rendering method, no relighting is performed to preserve as much as pos sible the color fidelity of the PC representation. 3) Mesh - based Rendering The first step in the mesh - based rendering approach, hereafter designated as RMesh , is to create polygonal meshe s with a surface reconstruction algorithm, such as the Poisson Surface R econstruction [ 31 ] . This means that rendering is performed with a set of vertic es alo ng with their conne ctivity to obta in a closed surface very precisely defined. The advantage of this renderi ng method is that, i ndependentl y of the distance to the object (or scene) or the PC density, a seamless surface is obtained; this may not occur with point - based rendering since the quality is associated to the number of points descri bing the surface and the distance between the viewer and t he obj ect. T he di sadvantage of this rendering method is that it requires surface reconstruction, which usually removes high > REPLACE THIS LINE WITH YOUR PAPER IDENTIFICATION NU MBER (DOUBL E - CLICK HERE TO EDIT) < 5 frequency geometric details [32] (smooth surfaces are obtained). It is important to note that surface reconstruction from complex surfaces is not always straightforward, it may not always be successful and can even require some user intervention. After surface reconstruction, the po lyg onal mesh needs to be rendered, usually with some shading algorithm [33][34] . The re are several mesh rend ering t echniques perfor ming shad ing, re flectio n, refraction and indirect illumination, and able to improve (when properly applied) the quality of the rendered data. In this work, the procedure t o reconstruct the surface proposed in [17] was followed. The Poisson Surfac e Reconstruction algorithm, available in the popular CloudCompare [ 35] software, was selected with default parameters. The estimation of the normal vect ors was performed as for the RPoint solution; no color att ributes were used to be able to directly assess the subjective impact of the geom etric artifacts. B. Selected Point Clou d Coding Solutions This section r eviews some releva nt and represent ative PC coding solutions available in the literature that will be later used for subjective and objec tive quality assessment . As ment ioned before, only the geometry component will be addressed. Naturally, t he MPEG G- PCC and V- PCC codecs , currently under development , are the most relevant for this work as they are the most recent and effici ent PC coding so lutions available . These code cs are part of the MPEG -I set of standards , which aim to design key technologies for immersive media. Considering th e above conte xt, the PCL, MPEG G - PCC and V- PCC codecs were selected . These codecs represent the three most relevant ways to structure PC data for coding purposes , namely tree, surface and patch , respectively . A t ree is a data structure where the points are organized in a tree , e.g. octrees, kd - trees ; a surface is a data st ructure where the points are represented with a parametrized surface model ( e.g. represent ed as a set of triangles ); finally, a patch cluster s points int o groups with som e size , w hich is su itable for 3D to 2D projections. Naturally , t hese PC codecs produce different types of geometr y artifacts, such as loss of geometric detail, geometric deformations, holes creati on and ot her geometric distort ions, e.g. curved surfaces represented by a set of planes. 1) PC C oding with Tree Structure s The PC coding solution selected for this class is the popular PC codec public available in the Point Cloud Libra ry [36] , a large scale, open project for 2D/3D image and PC processing . To faci litate the compression of geometry data, this codec represents the PC 3D coordinates and its attrib utes with an octree structure [3 7] . The PCL PC codec is often used a s benchmark since it can handle unorganized PCs of arbitrary si ze / density acquired with many types of sensors and has low encoding and decoding complexity . In PCL , each octree n ode corresponds to a voxel in 3D space. The root node corre sponds to a voxel that contains all points of the PC , the so - called PC bo unding bo x. Then, starting from the root node, each voxel is divided iteratively in to 8 voxels wit h the same si ze; naturally, a node is not divided if the corresponding voxel is not occupied. The occupancy of a node is represented with a single byte that signals the occupied child nod es up to the leaf voxels. By traversing the octree in breadth - first order, a stream of occupancy bytes is created , thus allow ing an efficient representation of the PC geometry. The decoded quality is dete rmined by the octree depth , which indirectly specifies the minimum voxel size; this corresponds to a pruned octree, since the octree will not have the full depth. When the PC is d ecoded , all t he poi nts in side a n occup ied vox el are represented with just one point at the voxel center. The statistics of the occu pancy bytes are expl oited by an entropy encoder (range coder [38]) that takes into account the specific (non - uniform) symbol frequenci es. The PCL v.1.8 version was used as the reference software for th e experiments reported here . In these exper iments, no point detail coding is performed to refine the geometry within the leaf voxels. 2) PC Coding with S urface Models The P C cod ing solution selecte d fo r t his class is t he MPEG G - PCC codec , which is capable of lossy and lossless coding of large PCs, with spatial random access, view dependent processing, packetization, and scalability [39] . As the PCL octree - based codec, the G- PCC codec is also based on octree decomposition to code the PC geometry but extends this coding paradigm wi th a parameterized s urface model. As in PCL, a pruned octree is used but the geometry of the point s at each leaf voxel is not represented by the voxel center; instead, a set of triangles is used to represent a surface form ed by these points. In G- PCC , the input PC data is first voxelized such that the resulting coordinates lie in the cube & '$ ( ! ) * + " and all points are represented by the voxel center ; , corresponds to the octree (full) depth parameter (defined a priori ) . Then, a prune d oct ree is created, from the root down to some specific octree level ( - ), which must be s maller or equal than the oct ree depth ; for lossless coding , level must be equal to the octree depth . If - is smaller than depth , a polygonal representation is used to represent the points , which is known as TriSoup , an amalgam for Triangle Soup. This means that the limited depth octree is complemented with additi onal geometr y informati on within g roups of v oxels, called bl ocks ; this additional geometry is represented by vertices , corresponding to t he inter sections of the surface with some edges of the block (in this case at most 12 vertices ). Th is set of vertices is sufficient to reconstruct a surface , corresponding to a non - planar polygon passing through the vertices. The test model category 1 ( TMC1 ) v1.1 version of the G - PCC reference softwar e was used for the experiments reported in this paper . 3) PC Coding with Pat ch - based Projection The P C cod ing solution selecte d fo r t his class is the MPEG V- PCC codec , which targets dynamic PC coding and performs a 3D to 2D mapping of both the geometry and color components [40] . Thus, depth and texture images are created and can be coded wi th a ny video codec, notably a High Efficiency Video Coding (HEVC) standard - compliant codec [41] . In the first step, the PC is decomposed into several patches with smoo th boundaries, while minimizing the reconstruction error. PC points are cluste red accor ding to the relation between their normal s and the normal directions of six predefined oriented planes (forming a 3D bounding box). Then, patches are extracted from these clusters usi ng a connected component > REPLACE THIS LINE WITH YOUR PAPER IDENTIFICATION NU MBER (DOUBL E - CLICK HERE TO EDIT) < 6 technique and mapped onto a 2D grid using a packing process which att empts to minimize the unu sed spac e. Each n × n (e.g., 16×16) block in th e grid is associated with a u nique patch. After th e p acking , geometry (depth) and texture maps are created and the empty spaces between patches are filled using a padding process to obtain a smooth image (easier to code). These maps are passed t o an HEV C encoder , which exploits the spatial and temporal corr el ations in a ve ry efficient way. An o ccupancy map used to determine whether a grid cell is occupied or not is also coded to determine which 3D points are decoded . T he V - PCC reference software used for the experiments reporte d in this paper was TMC2 v .2. C. Coding Artifac ts T his section describes the distortions associated with each of the PCC selected solutions . A characterization of the artifacts is important to understand the perceptual impact in the subjective tests and the limitations of the available objective metrics. For this purpose, some frames are extracted from the videos created for the subjective te st session described in Section IV.B . All PCs were coded u sing the t est condit ions for low rate as described in Section IV.A. Th e selected PCs e xamples try to show as much as possible the most typical visual artifacts found duri ng this study. A more compl e te set of examples , including these PCs for all codecs and rendering combinations (low quality only) are available in Section I of the supplementary material . 1) PCL C odec In the PCL codec , as the target bitrate de creases (lower octree depth) , the number of decoded points also decreases since all points inside a voxel are represented by just one point at t he voxel center. The consequence is an increase of the distance between decoded points and thus lack of detail. W hen PC L decoded PCs are rendered , in any rendering solution , the lack of detail (i .e. points ) results into a pixelated (or overly sub - sampled ) decoded PC. An example of the artifacts produced with PCL coding at low rate is illustrated in Fig. 2, f or the Loot PC for all rendering solutions . As shown, PCs are rather pixelated ( RPoint and RColor ) or lack detail (e.g. face and hands in RMesh ). Fig. 2 . PCL coding artifacts fo r Loot when renderi ng with RPoint , RColor and RMesh ( from left to right). 2) MPEG G- PCC C odec The MPEG G- PCC codec prunes the octree at some specific depth and after creates a surface representing all points in that depth with more preci sion. The rendering artifacts produced are very different from PCL, si nce the number of decoded point s is no longer r educed. An exampl e of the artifacts produced by G - PCC at low rate is illustrated in Fig. 3 for the Egyptian Mask PC for all rendering solutions. The ge ometric artifacts essentially come from the TriSoup process which may create false edges at the boundaries of the blocks or triangles; for low rates, these triangles may be visible . Moreo ver , when the PC is sparse in some region , the TriSoup process may cause artif icial holes (with polygonal shapes) or even an incr ease in the size of hol es already present in the original PC . Fig. 3 . G - PCC coding artifacts for Egyptian Mask when renderin g with RPoint , RColor and RMesh (from left to right). 3) MPEG V- PCC Codec In MPE G V - PCC , PC data is code d wi th traditional prediction and 2D transform tools. The more visible rendering artifacts correspond to block iness and the creation of false edges , often associated to the directional I ntra predict ion modes. An example of the rendering artifacts produced by V- PCC is illustrated in Fig. 4 for House w ithout a R oof PC f or all rendering solutions . While false edges are visible, mostly for RPoint rendering , V- PCC distortions are not very visible for RColor rendering . For RMesh , the entire decoded PC is smoother compared to RPoint . However, some details are lost (e.g. in the bell tower) , which may cause lower perceived quality. Fig. 4 . V - PCC coding artifacts for House w ithout a R oof when rendering wit h RPoint , RColor and RMesh ( from left to right) . Another type of artifact typically occurring with V - PCC coding (not shown in this example) is the lack of points at the patch boundaries. IV. PC R ENDERING AFTER C ODING : S UBJE CTIVE Q UALITY A SSESSMENT S TUDY In this section, the creation of the visual content for the subjective experiments is described along with the test setup and the experimental results. The analysis of these results will allow to assess the visibility of distortions of each PC codec under different rendering approaches . A. Test Conditions Six static PCs have been selected from the MPEG content repository [42] , notably Egyptian M ask and Frog from the class i nanimate object s, Fa c ade9 and House w ithout a R oof from the class b uildings and fa c ades , and Longdress and Loot from the class p eople. Thi s selection includes PC s w ith different levels of coding complexity (as defined by MPEG in [43] ), with four PCs > REPLACE THIS LINE WITH YOUR PAPER IDENTIFICATION NU MBER (DOUBL E - CLICK HERE TO EDIT) < 7 from class A (lowest complexity ) and two PC s from class B (medium complexity ). These six selected PCs have rather different characteristi cs in ter ms of content type, geometry and color. Thus , t he most important factors in th e PCs selection were : i ) the PC density ( PCs sparse and dense) , ii) the seman tic ty pe of content ( PCs fr om Inanimate Objects, Facades & Buildi ngs and People) , iii) the PC geometry structure ( PC s with hol es and PC s with flat surfaces ), and iv) the color characteristics (PCs with a small or high color gamut ). Table I shows the PC name, number of points , coordinat es precision, category whi le Fig. 5 shows the original PCs with RCol or rendering . T ABLE I T EST M ATERIALS AND C HARACTERISTICS . Fig. 5 . Test materials with RColor rendering. From left to right and top to bottom: Egyptian Mask, Frog, Longdress, Loot, Facade9 and House without a R oof . The selected PCs were coded with the three selected PC codecs , at three diff erent rates , to obtain decoded PCs with three different perceptual qualities, labelled as Low (L), Medium (M) and High (H). The selected codecs represent three different coding paradigms, notably PCL for tree structures , MPEG G- PCC for surface models and MPEG V - PCC for projection - based cod ing . For each of the MPEG PC codecs, three dif ferent rate points have been selected based on the suggested coding parameters in the MPEG Common Test Conditions (CTC) [43] for lossy coding. These rate points resulted into three distinguishable qualities, ranging from low to high. For PCL, the octree depth parameter was defined in a way to obtain a similar range of qualities compared t o V - PCC. Table II shows the coding parameters used for the PCL and MPEG G - PCC codecs. T ABLE II O CTREE D EPTH AND L EVEL FOR PCL AND G- PC C C ODECS FOR L OW (L), M EDIUM (M) AND H IGH (H) Q UALITIES . For G- PCC , the octree depth establishes the PC precision ( after the encoding voxelization step) . The level parameter corresponds to some octree layer after which a polygonal representation is used. For PCL, the octree depth ( OD) is set indirectly, using the PCL Octree Resolut ion ( OR ) parameter which corresponds to the size of the voxel computed as ./ 0 1 ( #$% &' ( , with P as PC precision (defined in Table I ). Table III shows the MPEG V - PCC HEVC qu antization pa rameter ( QP ) used for depth map coding ( note that no color coding is perf ormed ) and B0 is the occu pancy map precisi on . For V - PCC, a ll the test material was voxelized to 10 - bit precision. T ABLE III Q UANTIZATION P ARAMETER (Q P) AND O CCUPANCY M AP P RECISION (B0) FOR V- PCC C ODEC FOR L OW , M EDIUM AND H IGH Q UALITIES . B. Test Sessions The subjective quality assessment was performed in three test sessions, each using a different PC rendering approach . Following Section III. A , the test sessions have been lab elled as: 1. RPoint session : PCs are rendered with point - based rendering with point shading without c olor attr ibutes . 2. RColor session : PCs are rende red with point - based rendering with the original color (by recoloring) and no shading. 3. RMesh session: PCs are render ed with mesh - based rendering with surfa ce shading without co lor attri butes. The PCs were visualized in a non - interactiv e way, which means that th e o riginal and decoded PCs were rendered to standard video sequences and shown on a 2D display. The advantage of such approach is that all subjects in the subjective test see the same parts of the PC exactly in the same way, thus obtaining more reliable subjective assessment scores. T he CloudCompare PC processing soft ware was us ed for rendering with the point size, normal estimation and surface reconstruction performed as described in S ection I II. A . The lighting conditions , which influence the shading process in RPoi nt and RMesh , correspond to the default condit ions, this means ambient light source (sun light) and no spotlight . A simple camer a path rot ation around the object was used to create a 2D rendered video ; this path was f ound to allow a complete visuali zation of the PC and , most importantly, the codi ng artifacts under eval uation . For s ome PCs (e.g. Fa c ade9 ), no geometry was acquired for the back si de and , thus, the rotation path was restricted to the frontal part of the object . The vi rtual distance be tween th e PC and th e camera did not change, s imilarly to standard image and video s ubjective test methodologi es whe re th e dist ance between the subject and the display is fixed. The rendered video s have a spatial resolution of 1600×800 , a temporal resolutio n of 25 frames per se cond ( fps ) , and a duration of 1 0 s econds . For all the three sessions , the rendered videos were visualized on a 23 - inch ASUS VH238 monitor with 1920×1080 resolution. An i7 workstation with the Intel HD 530 graphic card and 128MB video memory was used to play the rendered video s at the correct frame rate. PC Name No. Points Precision Category Egyptian Mask 272,684 12 bit Inanimate Objects Fa cade9 1,596,085 12 bit Facades & Buildings Frog 3,614,251 12 bit Inanimate Objects House wo. roof 4,848,745 12 bit Facades & Buildings Loot 805,285 10 bit People Longdress 857,966 10 bit People PC PCL G- PCC Octree depth Oct ree depth Octree Level L M H L/M/H L M H Egyptian Mask 7 8 9 9 5 6 7 Frog 8 9 10 11 7 8 9 House wo. Roof 8 9 10 11 7 8 9 Facade9 8 9 10 11 7 8 9 Loot 7 8 9 10 6 7 8 Longdress 7 8 9 10 6 7 8 Quality Low Medium High QP 32 24 16 B0 4 4 4 > REPLACE THIS LINE WITH YOUR PAPER IDENTIFICATION NU MBER (DOUBL E - CLICK HERE TO EDIT) < 8 C. Subjective Quality Assessment Methodology The PCs selected for th e s ubjective study have rather different characteristics. Due to the acquisition process, some original PCs can be rather noisy, e.g. MPE G cultural heritage and buildings sub - category may have holes, outliers or even positioni ng errors. Also, the density (number of points per unit volume ) of the original PC may have a significant impact on the perc eived quality of the original rendered PC. These two factors may aff ect the subjective scores given by the subjects. Since these issues affect both the original and decoded PCs, the DSI S subj ective test methodology was selected f or all the test ses sions of th is subjective study. Thus , subjects visualize first the original and then the decoded rendered PCs and score the similar ity of decoded PC relati vely to the original, which allows to mitigate the impact of acquisition artifacts and other original PC characteristics. There were 20 subjects participat ing in each test session with 18 peopl e part icipating in all the three sessions and four people in one or two sess ions. At the beginning of each session , the goal of the subjective assessment experiment was explained to the subjects and they were asked to participate in a short training session to beco me familiar with the application interface . For the training sessions, the Statue Klimt PC from the same MPEG repository was used. The full set of rendere d PCs was organized into si x rounds per session with each round including all PCs with one of the three levels of quality . Since there were six PCs coded with three different codecs for three rat e points, 2 3 4 3 41 0 1 56 stimuli were assessed in each session. According to Rec ommendation BT - 500.13 [44] , the subjects see first the original rendered PC and after the impaired (this means decoded) rendered PC and score the later in a 1 - 5 scale associated to five im pairment levels, notably very annoying, annoying, slightly annoying, perceptible b ut not annoying and imperceptibl e. The display of each new rendered video was controlled by the subjects by pressing ‘Play ’. T he subjects had the option t o replay both video sequences (original followed by impaired PCs) before giving the subjective score . This option allow s to reduce the cognitive load of the subjects and , thus, obtain more reliable scores. Each session had a duration of approximately 28 minutes, considering t he training and scoring time s . To avoid that the results of one session influence d the re sults of another session , a minimum of 48h between test sessions was respected . For each session, outlier s ubjects were identified ba sed on the collected scores, following the procedure in BT.500 - 13 [44] ; onl y one outli er was id entified in the RMesh session. After, the average of all scores across the subjects were computed for each test PC, thus obtaining a MOS for each PC under evaluation . T he subjective scores for the three test sessions along with the original and decoded rendered PCs are publicly available at [45] and , thus , may be use d by the researc h community . D. Experimental Res ults and Analys is The focus of this section is on t he study of the i mpact of different PC rendering solutions on the user perceived quality for PCs compressed with different coding artifacts. Additionally, t he obtained subjective scores are analyzed to assess the visibility of the different coding artifacts . The subjective scores obtained for the three test sessions will be the basis for this study ; in this case, the MOS values represent th e similarity b etween the original and decoded PCs and not the intrinsic PC quality for which many other factors play a role. From now on, when the ‘ quality ’ term is used , it regards only to the fidelity ( or similarity) aspect . 1) Impact of Rendering on Perceived PC Qual ity This section studies the impact of the three rendering solutions on the percei ved PC quali ty. Note that , within each session , the rendering methods were not mixed and thus the subjects evaluated videos from decoded PCs for each rendering solution independently. Fig. 6 shows the 54 MOS for all PCs withi n each test session ( each associated to a rendering sol ution) . In Fig. 6 , t he MOS are sorted in ascending order , thus from lower to higher scores; each score is labelled with a rendered PC index and corresponds to a coding condition . To identify which are the most freq uent MOS per session (data not shown in Fig. 6 ) , Fig. 7 shows the MOS distributions (number of votes) given by the subjects in the three rendering sessions . Fig. 6 . S orted MOS for all test PCs in the three test sessions. Fig. 7 . MOS histograms f or the three test /rendering sessions. Fig. 6 shows that the scores are well distributed over the full range, from low (close to 1) to high (close to 5). The RColor session (blue curve) shows the highest MOS, followed by the RMesh session and, finally, the RPoint session. RPoint rendering : T he geometr y coding dist ortions are more visible for RPoint rendering since RMesh and RColor have mechanisms to miti gate the visual impact of the coding artifacts, e.g. filtering or masking. This can be clearly observed in Fig. 6 where the coding artifacts are more visi ble for the curve with lower MOS and, thus , as shown i n Fig. 7 , more ‘1’ , ‘2 ’ and ‘3’ votes are obtained for RPoint compared to RMesh and RColor . RMesh rendering : As sh own in Fig. 7 , RMesh rendering has higher MOS (and less low MOS) than RPoi nt rendering . Th is can be explained by the fact that RMesh rendering includes a surface reconstruction process (polygonal mesh creati on) w hich smooths the PC and makes the coding distort ions less visible, somehow behaving as a denoising filter . However, it should be emphasized > REPLACE THIS LINE WITH YOUR PAPER IDENTIFICATION NU MBER (DOUBL E - CLICK HERE TO EDIT) < 9 that PC edges and details are also s moothed with this type of rendering and , thus , RMesh is not able to out perform a point - based rendering solution with color ( RColor ), where the points are s imply rendered with a basic primitive , e.g . circles or squares. It also requires the extra pre - processing step of surface reconstruction before rendering , which may be difficult to ap ply in some application scenarios due to the scene complexity or the PC size (number of po ints) . RColor rendering : For RColor rendering , the original texture contains natural shading information, acquired from the light reflected by the object surface . This contrasts with the RPoint and RMesh renderings , whi ch use a single color with synt hetic shading and the final result depends on the accur acy of the (extracted) normal vectors (geometry only). H owever, it is clear that the original color captured during the acquisition is able to mask many of the geometric distortions , changing the perceived surface of the objects . Also, the texture details are able to hide geometr ic distortions since the human visual system is less sensible to high frequencies; this will cause the subjects to perceive less di storted shapes and , thus , better scores are given in the RColor session . In fact, in the RColor session, most of the scores are ‘4’ and ‘5’ as shown in Fig. 7, which means that most of the decoded PCs wer e considered to have high similarity with the original PCs . In this case, the most visible geometric distortions are limited t o the object boundaries. In summary, rendering with high quality color attributes mask s the geometric distortions and result s in higher perceived PC qualities. However , color attrib utes may not be availab le, and some applications may require high geometry fidelity . For example , geographical informatio n systems and cultural heritage applications t ypically only tolerate imperceptible geometry deformations ; i n such cases, RPoint rendering could be an appropriate choice to avoid the influence of color masking or geometry filt ering. On the other hand, if color is not available and geometry degradations are tolerable if not visibl e, RMesh rendering should be used, since it allows to mitigate the impa ct of some coding artifacts, e.g. holes or false edges, compared to RPoint , thus leading to higher perceived PC qualities . 2) Impact of Rendering on the Coding Artifacts Visib ility This section studies the impact of the three rendering solutions on the visibility of the coding artifacts associated to the t hree selected codecs. With this purpose in mind, the MOS for the three PC codecs and the three rendering solutions are shown in Fig. 8 . Fig. 8. MOS for each PC codec, organized b y rendering approach . This PC codec presentation of the MOS, more granular compared to Fig. 6 , allows comparing the impac t of the rendering solution on the final perceived visib ility, when different coding artifacts are present. From Fig. 8 , it is clear that the MOS distribution for each rendering approach is not similar for all c odecs. The main conclusion is that the different types of coding artifacts are not equally visible for all rendering approaches. Based on the results , the followin g conclusio ns about the sensibility of the various rendering solutions to t he PC codecs considered , and thus type of codin g artifacts, may be derived: PCL Coding: PCL distortions are visible regardless of the rendering solution and, thus, MOS are rather well distributed in the 1 - 5 range. This is mainly because a pure octree PC coding solution controls the decoded quality by limiting its maximum depth and, thus, decoded PC s have a lower number of points than the origina l PCs, sometimes significantly lower. Thus, larger point sizes for RPoint and RColor rendering are needed, creating a pixelated effect (perceptuall y unpleasant). Altho ugh a surface is reconstructed with RMesh rendering , wh en the number of points is r educed , detai ls are lost and some meshes even show geometric distortions due to t he surface reconstruction process . G- PCC Co ding: G- PCC distorti ons are less visible for RColor rendering compar ed to RPoint and RMesh , since the color masks the surface distortions . However, false edges, holes and geometric distortion s at boundaries are still visible for severe distortion cases. RPo int and RMesh follow a similar trend , with slight better scores for RMesh , since it mitigates the impact of some coding artifacts (e.g. holes or false edges) , thus offering a more visua lly appe aling sur face. V- PCC Cod ing: V- PCC di stortions are not very visible for RColor rende ring since they are not large enough to create strong deformations and the col or mask s most of the geometric distortions . D ue to t he V- PCC project ion onto 2D maps (t exture and depth) and the efficient HEVC coding process , most of the surfaces are consistently represented, although with some error regarding the original surface . V- PCC dist ortions are also less visible for RMesh than for RPoint rendering due to the impact of surface reconstruction - based re ndering on the perceived quality . 3) Statistical Significance Ana lysis of Subj ective Assessmen t This section pres ents a statis tical signifi cance analysis o f the subjective quality assessment. The goal is to evaluate if the difference s between the MOS for the three rendering approaches ( RPoint , RColor and RMesh ) ar e statistically significant at a given confidence level . Base on procedu res suggested in previ ous work [46][47][48] , three statistical tests were applied. For all tests, the full set of obtained scores was divided in three groups, one group of scores for each PC rendering approach, since the results being tested for statistical significance (sections IV.D.1 and IV.D.2) evaluate the impact of rendering. The selection of these test s was motivated by the f act t hat for V - PCC dat a the variance homogeneity test fails according to a Levene’s t est whi le the distribution of data is not normal for the All case according to the Shapiro - Wilk normality test. Welch ANOV A signi ficance test : T o evaluate if the dependency of MOS values on the rendering method is statistically significant, the Welch ANOVA significance test was applied, thus comparing groups of MOS values , one group for > REPLACE THIS LINE WITH YOUR PAPER IDENTIFICATION NU MBER (DOUBL E - CLICK HERE TO EDIT) < 10 each rendering method. This test measures the difference between the mean value s of each group with a 5% significance level without req uiring homog eneity of variances. The nu ll hypothesis assumes that MOS values for the various groups (rendering methods ) are drawn from a population with equal means. Table IV shows the p - values and associated MOS aver ages when considering all possibl e groups of scores for each codec (‘PCL’, ‘G - PCC’ and ‘V - PCC’ columns) and for all the codecs together (‘ALL’ column). When the p - value is lower than 0.05 (significance level), the separation between thes e rendering approaches is statistically significant . T ABLE IV . P- VALUES FOR THE W ELCH ANOVA S IGNIFICANCE T EST AND MOS AVERAGES FOR EACH SESSION , I . E . RP OINT , RC OLOR , RM ESH . Games - Howell post - hoc and Wilcoxon signed - rank tests: To compare the several possible pairs of rendering methods (i.e. perform a multiple - comparison statist ical test), the Games - Howell post - hoc test was sel ected since it also does not require the homogeneity of variances, again w ith a 5% sig nificance level. Table V shows the p - values obtained for this post - hoc test for al l possible rendering pairs. Moreover, since MOS values obtained do not follow a normal dist ribution (i.e. normalit y does not hold) for the ‘ALL’ case, the p - values obtained for the Wilcoxon signed - rank test (5% significance level) are shown in Table VI . The Wilcoxo n signed - rank test assesses whether th e group mean ranks differ; as it is non - parametric, i.e. it does not ass ume any data distribution, it is thus more suitable for this case. For the Games - Howell p ost - hoc and Wilcoxon signed - rank tests, when the p - value is lower than 0.05 (significance level ), there is statistical significance between groups of MOS. T ABLE V. P- VALUES FOR THE G AMES -H OWELL POST - HOC TEST FOR ALL RENDERING PAIRS ( PAIR ORDER IS IRRELEVANT ). T ABLE VI . P-V ALUES FOR THE W ILCOXON TEST FOR THE ‘A LL ’ CASE . Final remark s: From the analysis of t he results in Table IV and Tabl e V above, i.e. Welch ANOVA signifi cance and Games - Howell post - hoc tests, res pectively, the analysis of section IV.D.2 can be confirmed and new conclusions can be derived: PCL: The difference betw een the MOS for the three rendering approaches is not s tatistically si gnificant and thus, any rendering can be used . This was expected since PCL distortions are visible regardless of the renderin g solutions and, thus, sim ilar subjective scores were obtaine d for all rendering approaches . G- PCC: RColor is better than RPoint and, thus, if color is available, it should be used in point - based rendering soluti ons. There is no statistical differe nce between RPoint and RMesh and RColor and RMesh , meaning that there is no advantage in using mesh - based rendering (which may even require complex s urface reconstruction methods) . V- PCC: RColor is bet ter than RPoint and RMesh and, thus, color effectively masks the geometric distortions associated to the V- PCC coding artifacts . For the 2 nd best renderi ng method, there is no statistical difference between RPoint and RMesh and thus, this means that any of these two method s could be used. Finally, from the analysis of t he results in Table VI above, i. e. Wilcoxo n signed - rank test results, statistical significance was obtained for all rendering pairs (i.e. RPoint ↔ RColor , RPoint ↔ RMesh , and RColor ↔ RMesh ) for the ‘ALL’ case, meaning that a ranking orde r of the rende ring methods is established. The results for this test show t hat RColor is stat istically better than RMesh and RMesh is statistically better than RPoint . This confir ms the intuitive ordering shown in Fig. 6 and the conclusions in section IV.D.1. V. PC R ENDERING AFTER C ODING : O BJECTI VE M ETRICS P ERFORMANCE A SSESSMENT The main p urpose of t his secti on is to evaluate the performance of s everal PC obj ective metrics in the presence of coding artif acts. Only metrics accoun t ing for geom et ry error s are considered since this is the PC component where artifacts may cause a higher negative impact on the user quality of ex perience. First , th e objective m etrics that are e valuated are presented and then the correlation between the objective metrics and the MOS are reported and analyzed. This will allow to understand which objective metrics perform better, which type of coding degradations can be more appropriately accounted and the impact of the rendering solution on t he PC objective metrics accuracy . A. Geometry Obj ective Ass essment Metr ics Objective a ssessment metrics for PCs are ess ential for se veral tasks, notably : i) measur ing the PC fidelity and thus playing a part on the rate - distortion (RD) performance assessment of PC coding solutions; ii) optimizing PC coding solutions, e.g. allowing to make percept ual optimiz ations ; iii) measuring end - to - end quality in PC streaming solu tions, thus involving other degradations besides coding . In this section, the most popul ar geometry objective metrics for PC quality assessment adopted for this study are presented. These quality metrics a re full reference metrics and measure the lev el of similarity (impairment level) of the decoded PC (with some coding artifacts) with respect to t he original PC . Overall, t hey are based on est ablishing correspondences and computing distances between points of the original and decoded PCs . T he following classes of metrics can be defined : 1. Point - to - point (Po2Point) : S core depends on the di stance between corresponding points. 2. Point - to - plane (Po2Plane): S core depends on the distance between a point and a reference plane where this plane is a representation of the surface around a point in the original PC. 3. Plane - to - plane (Pl2Plane): S core depends on the similarity of the p lanes representing the surfaces near corresponding point s. While Po2Point metri cs a re r ather straight forward, Po2Plane metrics us e a plane t o repres ent the su rface aro und a point , under the assumption that this is a reason able representation of the PCL G- PCC V- PCC All p- value 0.98 0.019 0.0 0.002 MOS averages 3.0, 3.0, 3.1 2.8. 3.8, 3.2 3.1, 4.2, 3.5 3.0, 3.7, 3.2 PCL G- PCC V- PCC All RPoint ↔ RColor 0.998 0.011 0.000 0.002 RPoint ↔ RMesh 0.973 0.586 0.144 0.300 RColor ↔ RMesh 0.988 0.162 0.000 0.085 RPoint ↔ RColor RPoint ↔ RMesh RColor ↔ RMesh p- value 0. 0 0.023 0.003 > REPLACE THIS LINE WITH YOUR PAPER IDENTIFICATION NU MBER (DOUBL E - CLICK HERE TO EDIT) < 11 object surface in a specifi c region. The Pl2Plane metr ics ext end this concept and use two planes to represent the surfaces ar ound points, both in the origi nal and degraded PCs. 1) Point - to - Point (Po2Point) Objective Metri cs Point - to - point objective metrics establish point - wise correspondences in two directions: 1) direct / 7 8 : for each point in the ori ginal (as reference) PC 9 and the nearest neighbor (NN) point in the degraded ( as test) PC : [49] ; 2) inverse 8 7 / : correspondences are computed similarly to 1) but in the opposite direction , thus, from PC : to PC 9 . Assuming ; ! ) #< * $ = + % as an error vector between point < , in PC 9 and the < , nearest neighbor point = - in PC : , the Po2Point error vector length , i.e. the distance , ./0 12312456 between these two points is given by: , ./0 12312456 # > % 0 ?; @ 7 #< , $ = - %? 8 8 (1) This distance is computed for all t he points in both directi ons, i.e. from original to degraded PCs , , ./0 12312456 , and from degraded to original PCs , , 0/. 12312456 , for every point. There are three main approaches to aggregate or pool all the c omputed errors : • Mea n Squ ared Error (MSE): Average of th e squar ed dist ance between each point and their corresponding nearest neighbor , for all points , as defined in: ABC ./0 0 * D 9 E , ./0 12312456 # > % :; ! <= R (2) where D 9 is the number of poin ts in the original PC R. • Hausd orff (HAUS) distance: Maximum for all poi nts of the MSE dist ance as define d in: FGHB >/? 0 max ; ! <=@ I, . , 0 Po2Point # > % J (3) • Geometric PSNR: Geo metric PSNR met ric defin ed as: PSNR >/? " #$ log 10 K % L 2 ABC >/? M 1 with 1L 0 ( A; ) * (4) where L is the peak con stant value and N< the PC coordinates precision . The metrics abov e def ined just for one direction ( from PC R to T ) are computed al so in the other direction and , th us, the final metric value can be computed as : ABC " OPQ 1# ABC >/? $ ABC ?/> % (5) FGHB 0 OPQ R FGHB >/? $ FGHB ?/> S (6) TBU9 0 OVW R TBU9 >/? $ TBU9 ?/> S (7) The Po2Point PSNR metri c is used nowadays by the MPEG 3D Graphics Compression (3DGC ) group in the evaluation of PC coding methods such as G - PCC and V - PCC , labelled as D1 [42] . 2) Point - to - Plane (Po2Plane) Objective Metrics Point - to - plane metrics take into consideration the underlying object surface represented with the PC by fitti ng a plane to the local neighbo rhood of each point [50] . Considering the 3D point locations and their associated surface s , the normal for each point is equal to the norm al of the tangent plane to the surface. A po int and the corresponding normal vec tor can , thus , determine the tangent plane for each point. As for Po2Point metrics, Po2Pla ne metrics ar e also symmetrically computed for both directions, i.e. from original to degraded and from degraded to original PCs. However, P o2Plane me trics r equire th e computation of normals on the original PC, which are directly used in the direct direction ( / 7 8 % . For the opposite direction ( 8 7 / % , the n ormal for each point is estimated by averaging the normals of the nearest neighbor points from the original PC. The Po2Plane error distance between two points ; ! 3 #< * $ = + % is obtained by first computing the Po2Point error vector ; ! ) which is then projected onto the normal X B C Y Y Y @ . Thus, the Po2Plane distance , ./0 1231DE5F # > % that represent s the error betwe en a point and its corresponding surface is given by : , R,T Po2Plane # > % 0 ? ; @ 8 # & 𝑖 ' ( 𝑗 % ? 8 8 0 #; @ 7 R & 𝑖 ' ( 𝑗 S Z X B C Y Y Y @ % 8 (8) MSE distan ce, Hausdo rff distance and Geometri c PSNR may then be computed with the projected error distances as for Po2Point metrics (where the error vector is not projected). In this way, the degraded PC points that are closer to the refer ence surface have smaller projected dist ances even though they ar e farther from the corresponding point on the original PC. The Po2Plane PSNR metric is also us ed by MPEG for the evaluation of the G- PCC and V - PCC codecs , labelled as D2 [42] . 3) Plane - to - Plane (Pl2Plane) Objective Metrics Th is type of objective metric s es timate s the similarity of surfaces in the original and degraded PCs [51] . In this case, tangent planes are estimated for both the original and degraded points. As for Po2Pl ane metri cs, t angent planes are used as a local linear approximation of the underlying object surface but, in this case, planes are estimated for both the original and degr aded PCs. Again, to compute Pl2Plane metr ic s, the nearest neighbor correspondences are computed in bot h directions . The Pl2Plane metric s depend on the angular similarity (or di ssimilarity ) between the planes, i.e. the angular difference between local planes associated to the points in a correspondence. In this case, the so - called cosine similarity measure , [\ $ measuring the cosine of the angle between two vectors is used. The two vectors correspond to the normal vectors (perpendicular to the tangent planes) for the two points in a correspondence i n PCs 9 and : [51] , as in : [\ ) > * 0 cos # ] , % 0 X G ; Y Y Y Y @ Z X B C Y Y Y @ ?X G ; Y Y Y Y @ ? 8 ^X B C Y Y Y @ ^ 8 (9) where X G ; Y Y Y Y @ and X B C Y Y Y @ are normals for points < , and = - in PCs 9 and : , respectively . To c ompute t he angular difference (or distance) , , >/? 1D31DE5F , the inverse c osine is used as follow s : , >/? Pl2Plane #> % 0 * ) ( arccos # _ [\ #> % _ % ` ( 10 ) After determining the angular difference for all the points in the original PC, different st rategies for pool ing, i.e. for aggregating the angular difference s obtained for all point s , can be defined . In this case, three pooling strategies were defined: AGa @/H 0 * D 9 1 E , ./0 1D31DE5F # > % :; ! <=@ ( 11 ) > REPLACE THIS LINE WITH YOUR PAPER IDENTIFICATION NU MBER (DOUBL E - CLICK HERE TO EDIT) < 12 ABGa @/H 0 * D 9 1 E b , ./0 1D31DE5F # > % c 2 :; ! <=@ (12) +,-./ R,T " d ,-./ R,T 0 ( 13 ) MAD stands f or mean an gular di fferenc e, MSAD for mean squared angular difference and RMSAD as the square root of MSAD. As for the o ther ty pes of metrics, (11) - (13) ar e performed symmetrically, this means in both direct and inverse directions , and the minimum value is selected as the final (similarity) score. Since PCs have different precisions (depth) for the point coordinates, the error vectors for all these metrics may not be directly comparable. To overcome t his problem , all PCs are normalized to have coordinates in the &'$*+ range bef ore computing the metrics . The only exception is the PSNR for Po2Point and Po2Pl ane metric s, which include s the peak L that already plays the role of a scaling factor depend ing on the bit depth of each PC under evaluation. B. Experimental Resu lts and Analys is In this sectio n , th e selected objective metrics performance will be presented and anal yzed for the subjective scores obtained in the three test sessions , thus for different rendering approaches . As recommended in [44][52] , b efore assessing the objective met rics performan ce, a nonlinear logistic fitting has been applied on the objective scores to map them to the subjective scores scale. To assess the metrics performance, t he Pe arson Linear Correlation Coefficient (PLCC ) is computed as a measure of the linear dependence between the MOS and each obj ective metric . Table VII shows the PLCC for the 9 metric s descri bed in the previous se ction , for each rendering appr oach, independ ently computed for each PC codec and also considering all codec s simultaneously (column A ll) . With the se results, the perfor mance of each metric can be assessed for each of the three test sessions described in Section IV. B. A detail ed a nalysis of the r esults in Table VI I is presented in the following . First, from the perspective of the PC codec and coding distortions , aft er from the perspective of the rendering solution and , finally , assessing which metric pe rforms t he best and in wh ich condi tions. 1) Impact of Coding on the PC M etric A ssessmen t PCL Coding: For PCL coded data, the Po2P lane and Po2Point metrics have the best PLCC (overall , PSNR is the bes t) with high correlations for all rendering approaches as shown in Table VII . As PCL controls the rate by reducing the number of decoded points, large obj ective errors and perce ived distortions are visible for all sessions . This was expected since , when the compression ratio increases (lower rates) , more and mor e poin ts ar e dis carded (due to octree pruning) and the remaining points are represented farther away from the original surface. PCL artifacts are strong enough to be visible even after the RMesh surface reconstruction. G- PCC & V - PCC Coding: As shown in Table VII , t he objective metri cs performance f or G - PCC is slightly lower (4 to 5%) compared to PCL and shows the highest performance for Po2Point metrics ( only fo r RPoint and RColor sessions ). Moreover, n one of the selected object ive metrics p erforms well for V- PCC coded data. The s elected metrics unde restimate the perceived similarity between original and degraded PCs, especially for RPoint and RMesh renderings where the geometric errors are less visible, e.g. compared to RColor . Since both the G - PCC and V- PCC codecs tend to add point s with respect to the original PC (see Fi g. 9 ), the density of points is increased and, thus, the perceived quality is higher (higher MOS). However, the objective metrics ar e not able t o account for this effect and, thus, underperform for G - PCC and V - PCC codecs. In additio n, since a wide range of values is obt ained for the rati o of decod ed over original number of points, notabl y depending on the codec (and also coding parameters), it is rather difficult to map errors t o a perceptually meaningful metric; this makes the task of designing reliable objective metrics harder, especially when different types of codecs, with different coding artifacts, are jointly assessed (‘All’ column in Table VII ). The correlati on of the object ive metrics for V- PCC is much lower compared to G - PCC (cf. Table VII ). The projecti on - based V- PCC codec causes slight distort ions on the g eometry which are not very visible even for lower bitrates. On the other hand , G- PCC artifacts ar e more visible especially when the surface estimation (triangulation) process fails. T ABLE VII PLCC (%) BETWEEN O BJECTIVE G EOMETRY A SSESSMENT M ETRICS AND MOS FOR THE T HREE R ENDERING A PPROACHES . I N B OLD , THE B EST PLCC V ALUE BETWEEN THE S U BJECTIVE AND O BJECTIVE S CORES AND ALL THE OTHER PLCC V ALUES THAT DO NOT D EVIATE MORE THAN 0.02 FROM THE B EST PLCC. Type Metric RPoint RColor RMesh PCL G- PCC V- PCC All PCL G- PCC V- PCC All PCL G- PCC V- PCC All Point - to - Point MSE 84.5 53.7 26.3 51.9 84.1 85.5 44.1 64.3 90.5 32.7 7.5 39.0 HAUS 90.5 45.6 34.2 23.7 87.1 59.2 57.8 18.6 88.3 49.4 31.2 32.5 PSNR 87.4 86.5 55.0 66.9 89.8 71.1 72.3 78.3 91.6 51.7 18.3 68.8 Point - to - Plane MSE 84.4 50.2 32.8 46.9 84.7 80.6 18.3 60.2 88.5 37.1 12.4 34.5 HAUS 90.1 55.1 29.8 30.1 87.0 67.1 69.0 21.1 87.7 45.9 26.9 28.9 PSNR 90.1 82.4 52.1 69.7 90.3 54.6 61.4 78.2 91.0 63.2 28.0 72.1 Plane - to - Plane MAD 72.4 55.5 54.1 51.8 55.7 68.3 74.5 24.7 40.0 28.0 28.7 30.3 MSAD 72.4 55.4 52.6 51.8 55.7 68.3 74.5 24.6 40.0 27.9 27.1 30.5 RMSAD 71.7 55.6 51.8 51.5 55.0 68.0 72.9 24.7 39.8 26.2 30.4 31.1 - No. Points 65.2 21.8 27.9 12.3 69.0 27.1 60.6 43.1 68.6 35.1 28.9 2.3 > REPLACE THIS LINE WITH YOUR PAPER IDENTIFICATION NUMBER (DOUBLE - CLICK HERE TO EDIT) < 13 Fig. 9 . Average ratio of deco ded over the origin al number of poin ts (1 means the original and decoded number of points are the same). Fig. 10 shows the Po2Point RMSE distance errors histogram for all the points in two PCs coded with G- PCC and V- PCC for which th e same overall Po2Point PSNR (60 dB) was obtained. As shown, although t he PSNR is the same, the error distribution is very different between G- PCC and V- PCC . V- PCC er rors are closer to zero which makes them less perceptually visible while G- PCC errors have larger magnitudes and, thus, are more visible. This impli es that G- PCC has a lower subj ective similarity (MOS of 1.1) than V- PCC (MOS of 3.15) even when the Po2Point PSNR objec tive metric computes the same DSIS score ( in this case 60 dB). This observation happens also for other objective metrics, such as Po2Point and Po2Pla ne MSE. Fig. 10 . Po2Point RMSE histo grams for G - PCC and V - PCC. In summary, the objective metrics performance in terms of correlation with MOS highly depends on the coding dist ortions introduced, b eing satisfactory when PCs are coded with PCL and G- PCC and pe rforming poorly f or the V - PCC codec. Nat urally, no objective metric performs well for all codecs together, a real problem when comparing the RD per formance of very different coding paradigms. 2) Impact of Rendering on the PC Metrics Asse ssment As p reviously concluded, rendering can significa ntly influence the visibility o f coding artifac ts (i.e. the pe rceived similarity between ori ginal and decoded PCs ) and, thus, it is important to analyze the objective metrics performance for dif ferent rendering solutions. The PLCC correlation over all data for all sessions is rather low (less than 78.4% ) because the objective metrics cannot measure with ac curacy all different types of distortions. However, as shown in Tabl e VII , the best PLCC correlations occur for RColor rendering, for which higher MOS values were obtained. Thus, geometry metrics measur e the per ceived simil arity bet ter when color attributes are used . The main reas on is beca use subjects were able to better perceive degradations for medium and high qualit y ranges (which occur oft en wit h RColor , cf. Section IV. D ) compared to low and medium quality ranges (which occur more often with RPoint and RMesh , cf. Section IV. D ). For RMes h rendering , PLCC correlations are rather low comparing to the other rendering approaches , especially for G - PCC and V - PCC codecs. For RMesh , PC data is converted to a polygonal mesh (surface reconstruction) for rendering and most the objective metr ics have low correlation performance for this type of representation. In summary, objecti ve metrics account better distort ion artifacts and are more reliable when poi nt - based rendering ( with and without color , RPoint and RColor ) is used to process the decoded PCs befo re visualization. 3) PC Objective M etrics Corr elation A ssessment Po2Point metrics: Po2Point met rics have a high PLCC performance for many cases but are especially better than others for the PCL and G- PCC codec ( RColor and RPoint ) . This is because PCL and G- PCC to some extent are an octree - based PC codec and, thus, some distortions still come from the positioning error related to the 3D partitioning of space into voxels , the target of this type of metrics. T he Po2Point and Po2Plane Ha usdorff metrics can also reach high PLCC performan ce , especially for PCL data and for the RPoi nt session (90.07) . However, Hausdorff is not a very reliable metric when different types of coding distortion s (all data and G - PCC/V - PCC ) are considered tog ether . The main reason is that only the maxi mum error is accounted and , thus , it is too sensible to outliers; this problem h as been al ready observed in the literature [23] and can be mitigated using average pool ing as in MSE and PSNR metrics. Po2Plane metrics: Regarding Po 2Plane metri cs, the performance is very si milar to Po2Point metrics, slight ly better for some cases , since it considers the underlying surface f rom which the 3D poi nt locations wer e sampled. Mo reover , the Po2Plane PSNR metric excels , being rather reliable and consistent for many cases , outperforming t he corresponding MSE metric . The main reason is that the peak used ( computed f rom the geometry coordinate precision) to conver t MSE to PSNR values acts as a n important normalizer . Pl2Plane metrics: Pl2Plane metr ics have , in general , wor st PLCC performance wh en compared to Po2Point and Po2Plane metrics. Thi s is ma inly because i t i s rather diff icult to obtain reliable normals for the decod ed PC, especially when som e types of coding artifacts are present (e.g. holes) or when the decoded PC is rather sparse [51] . However, the se metrics seem to be the best choi ce for the V - PCC codec ( for RColor and RMesh renderings) where geometry errors mainly come fro m coding artifacts in the dep th maps and , thus , are more consis tent among different parts of the PC. As a curiosity, t he number of decoded points could also be used as an objective metric , see last line of Table VII . As expected, this metric performs very poorly, especially for V- PCC data where the number of decoded points is typically larger than the number of original points and critically depend s on som e coding parameters, e.g. B0 for the occupancy maps . 4) Statistical Significance Ana lysis of Obje ctive Assessment Besides the usual P LCC correlat ion evalua tion, the difference > REPLACE THIS LINE WITH YOUR PAPER IDENTIFICATION NUMBER (DOUBLE - CLICK HERE TO EDIT) < 14 in the performance of one objective metric with respect to another was assessed for statistically significan ce , using the procedure suggested in [53] . For that purpose, the prediction residuals were first calculated by subtracting the subjective scores from the predicted subject ive values, obtained by applying a nonlinear logistic fitting t o the objective scores. These prediction residuals were obtained fo r every PC objectiv e m etric. Then , the one - tailed F- test was applied to the prediction residuals, to assess if the difference in performance (PLCC) between any two given PC objective metri c s is statistically significant at some significance level. In gen eral, the significance le vel sh ould be se t based on the sample size (cardinality) being evaluated for an increased power of the test (i.e. probability of rejecting the null hypothesis when it is not true) [54] ; since the cardinality of the prediction residuals is 18 for a single PC codec (PCL, G - PCC and V - PCC), a 0.2 significance level was used [54] . T he F - test assumes that the samples are normally distributed, and thus the kurtosis test was used to verif y whether all prediction residu als followed a Gaussian distribution, which was t he case for all the o bjective metrics, except t he No. P oints. In this work, the F - test null hypothesis is that the prediction residuals for the two objective metrics being compared are obtained from normal d istributions with the same variance, which means that t he p air of obje ctive metrics under evaluation is statistically similar. The alternative hypothesis is that the prediction residual s for the two objective metrics being compared are obtained from nor mal distributions with di fferent var iances, which means that the pair of obj ective met rics und er evalua tion are statistically different. By computing the ratio between the variances of the two prediction r esiduals, the test stat istic, F, was obtained, which w as then compared to the F - test critical value, Fcritical; the F - test critical value depends on the significance level and on the sample sizes. When F is higher than Fcritical, then the null hypothesis can be rejected, which means that the objective metrics under eval uation are statistically different; otherwise, the null hypothesis cannot be rejected, meaning that the ob jective m etrics under evaluation are statistically indistinguishable. Since the test statistic F is always computed with the objective metric with larger prediction res idual variance in the numerator, objective metric in the denominator corresponds to the metric with the best per formance whenever the null hypothesis is rejected. T he statistical si gnificance tables obtained are presented in Section II of the supplementary material . T he results obtained confirm that P2Point and Po2Plane metrics have the best overall performance for many coding scenarios (PCL, G - PCC and for all codecs ), especially the PSNR based metrics which are c onsistently better than MSE or Hausdorff based metrics. Between the P2Point and Po2Plane PSNR ther e is no statistical difference , which means t hat both metrics achieve similar performance . Moreover, Pl2Plane metrics have the best perform ance for V - PCC deco ded data (for RColor rendering). In summary, the statistical significance results allow confirming that the conclusions drawn before ( Section V.B .1 - 3) are valid. In summary, when all codecs and all renderings are considered, the Po2Point and Po2Plane PSNR metric values have the highest correlation with subjective scores . These met rics correspond to the ones previously selected by MPEG for the PCC Call for Proposals and currently u sed in common test conditions [42] . To the best of the authors knowledge , this is the first time that th ese metrics choice h as been validated with MOS obtained with a well - defined procedure. Fr om the results present ed in this work , there is still significant room for improvement, especially if the goal is to achieve the same level of performance that past objective met rics (e. g. SSIM base d) have obt ained for 2D image and video representations. VI. F INAL R EMARKS The main objective s of t his paper are to study the imp act of the rendering process on the perceived quality of de co ded PCs and the performance of available PC geometry objective metrics . To achieve these objectives, three representative PC coding s olutions and three PC re ndering solutions were used as well as a wide set of o bjective metrics. The subjective experiments sugg est that geometric coding distortions can be masked by using the color attributes and (to a less extent ) by surface reconstruction methods. Moreo ver , PC codecs produce disti nct coding artifacts that have different impact s in ter ms of the final perceived quality, e.g. for PCL decoded data , geometric distor tions are clearly visible for all rendering methods. Regarding the o bjective metrics evaluation, the results show that a careful selection of the objective metrics is necessary to have a reliable measure of the decoded PCs quality. Also , for some codecs and rendering solutions , the current metrics are not very reliable, e.g. for V - PCC coded data ; this is rather critical since V - PCC is expected to become the first coding standard to be deployed in the market . Moreover , some of the objective metrics have a rather limited scope with signifi cantly degraded accu racy , for some specific rendering solutions . Regarding fut ure work, a natural extension of this w ork is rendering with color attributes coded at different rates/ qualities as it is critical to identify the best trade - off between geometry and color parts while maximi zing the user perceived quality. VII. PC Q UALITY A SSESSMENT : C HALLENGES AND W AYS F ORWARD The exp erimental results presented in this work allowed to derive several relevant conclusions to the PC codi ng and quality assessment fields. Establishing a bridge to those conclusions, this section identifies some challenges and suggests possible ways forward towards promoting a dvances on those fields, as follows: Advancing PC coding: The study reported in this work shows that the number of decoded points plays a rather important role in perceived quality. When the density of points is increased during PC decoding, the perceived quality is also increased and, thus, better subjective scores can be obtained (as shown in Section V.B.1). This eff ect i s clea r for the MPEG V - PCC coding solution, which produces decoded PCs with artifacts less visible (and thus less annoying) as shown in sections III.C and IV.D (Fig. 8). However, many practical applications may not afford this increas e on the size o f the decoded PCs (due to me mory an d computational speed constrains), and thus new coding methods that tightly couple the decoding and the rend ering processes are needed, e.g. PC rendering could render the polygons of the G - PCC Trisoup geometry representation directly. Moreover, PC > REPLACE THIS LINE WITH YOUR PAPER IDENTIFICATION NUMBER (DOUBLE - CLICK HERE TO EDIT) < 15 representations from which a varying number of decoded points can be sampled (e.g. from a set of triangles or 2D pro jection maps) c ould le ad to more ef ficient ways of achi eving g ains i n perceived quality, naturally without compromising the PC coding engine efficiency. Advancing PC s ubjective quality assessment: The study reported in this work shows the im portance of factoring the rendering process in the evaluation methodology. For example, if non - colored PCs are evaluated and a mesh - based rendering methodology is foll owed, some geometric artifa cts (as shown in Section IV.D.2) may be masked, which should be avoided when the final rendering method is unknown. This is an important insight for future subjective studies, which assumes particular relevance since both JPEG and MPEG groups have been performing often thi s type of subjective evaluations and PC subjective quality assessment standards are not yet defined. Moreover, it is now c lear from this work that the impact of color attributes in the overall perceived quality is high and masks geometry deformations (Sect ion IV.D.1), which is not adequate for several applications, such as geographical information systems or automotive applications. Clearly, for these applications, fidelity is an important factor and thus subjective studies should include both geometry and geometry plus color subjective assessments to measure the different aspects of PC quality. Advancing o bjective PC metric s: The s tudy report ed in this work sho ws that the final p erceived quality not only d epends on PC errors intr oduced by some processing st ep (in this case, coding) but also on the rendering process (see Section V.B.2 and Table VII ). This way, metrics that explicit c onsider the way that rendering is performe d are likely to perform better, for example, the distance between points (density) after projection could be considered for point - based rendering soluti ons. For mesh - based rendering solutions, suitable characterization of the surfaces using some statistica l information, e.g. perceptually relevant surface - based and color - based features, can be extract ed and used to predict the per ceived visual quality. This may lead to much needed improvements, consider ing that objectiv e metric s performance i s r ather poor fo r this type of rendering (as shown in Section V.B.3). R EFERENCES [1] H. Jung, H. Lee and C. E. Rhee, “ Flexibly c onnectable l ight f ield s ystem for f ree v iew e xploration, ” IEEE Trans. on Multimedia , doi: 10.1109/TMM.2019.2934819, Aug . 2019 [2] P. Rente, C. Brites, J. Ascenso and F. Per eira, “Graph -b ased s tatic 3D p oint c louds g eometry c oding,” IEEE Trans. on M ultimedia , vol. 21, no. 2, pp. 284 - 299, Feb. 2019. [3] J. Chen, C. Lin, P. H su and C. Chen, “ Point cloud encoding for 3D building model retrieval, ” IEEE Trans. on Multimedia , vol. 16, no. 2, pp. 337 - 345, Feb. 2014. [4] S. Par k and S. Lee, “ Mult iscale re presentation and c ompression of 3 - D p oint d ata, ” IEEE Trans. on Multimedia , vol. 11, no. 1, pp. 1 77 - 183, Jan. 2009. [5] J. Sim and S. Lee, “ Compression of 3 - D p oint v isual d ata u sing v ector q uantization and r ate -d istortion o ptimization, ” IEEE Trans. on Multimedia , vol. 10, no. 3, pp. 305 - 315, Apr . 2008. [6] R. Mekuria , C. Tulvan and Z. Li . “ Requiremen ts for p oint c loud c ompression, ” ISO/IEC MPEG N16330 , Gen eva, Switzerland, Fe b . 2016. [7] T. Ebrahimi, S. Foessel, F. Pereira and P. Schelkens, “ JPEG Pleno: t oward an e fficien t r epresentation of v isual r eality, ” IEEE Multimedia , vol. 23, no. 4, pp. 14 - 20, Oct .- Dec. 2016. [8] S. Schwarz et al., “Emerging MPEG standards for point cloud compression,” IEEE Journ al on Emerging and Selected Topics in Circuits and Systems , vol. 9, no. 1, pp. 133 - 148, Mar. 2019. [9] MPEG 3DG and Requirement s, “ Call for p roposals for p oint c loud c ompression, ” ISO/IEC MPEG N16763 , Hobart, Australia , Apr . 2017. [10] 3DG Group, “Text of ISO/IEC CD 23090 - 9 Geometry - based Point Cloud Compression, ” ISO/IEC MPEG N18478, Geneve, Switzerlan d , Mar . 2019 . [11] 3DG Group, “ Text of ISO/IEC CD 23090 - 5: Video - based Point Cloud Compression ,” ISO/IEC MPEG N18 030 , Macau , China , Oct . 201 8. [12] M. Schütz and M. Wimmer. “ High - quality point - based rendering using fast single - pass interpolation ,” IEEE Digital Heritage , Granada, Spain, Sep t. 2015. [13] P. Ros enthal and L. Linsen. “ Image - space point cloud rendering ,” Int. Conf. on Computer Graphics , Istanbul, Turkey, Ju n. 2008. [14] E. Alexiou, E. Upenik and T. Ebrahimi, “Towards subjective quality assessment of point cloud imaging in augmented reality,” IEEE W orkshop on Multimedia Signal Processing , Luton, UK, Oct. 2017. [15] E. Alexiou and T. Ebrahimi, “On the performance of metrics to predict quality in point c loud repr esentations,” Applications of Digital Image Processing XL (SPIE 10396) , San Diego, CA, USA , Sept. 2017. [16] E. Alexiou and T. Ebrahimi, “On subjective and objectiv e quality evaluation of point cloud geometry,” Int. Conf. on Quality of M ultimedia Expe r ience , Erfurt, Germany, M ay 2017. [17] E. Alexiou et al. , “Point c loud subjectiv e evaluation methodolog y based on 2D rendering,” Int. Conf. on Quality of Multimedia Experience , Sardinia, Italy, May 2018. [18] E. Alexi ou and T. Ebra himi, “ Impact of visualization stra tegy for subjective quality a ssessment of point clouds,” Int. Conf. on Multimedia & Expo Workshops, San Diego, CA, USA, Jul. 2018. [19] E. Alexiou et al. , “Point c loud subjectiv e evaluation methodolog y based on reconstructed surfaces” , Applications of Di gital Image Proc essing XL (SPIE 10752), San Diego, CA, USA, Sept. 2018. [20] E. Alexiou and T. Ebr ahimi, “Benchmarking of objecti ve quality met rics for colorless point clouds,” Picture Coding Symposium , San Francisco , CA, USA, Jun. 2 018. [21] J. Zhang, W. Huang, X. Zhu and J. Hwang, “ A subjective quality ev aluation for 3D point cloud models, ” Int. Conf . on Audio, Language and Image Processing , Shanghai, China, Jul . 2014. [22] R. Mekuria, K. Blom and P. Ces ar, “ Design, i mplementation , an d e valuation of a p oint c loud c odec for t ele -i mmersive v ideo, ” IE EE Trans. on Circuits and Systems for Video Technology , vol. 27, no. 4, pp. 828 - 842, Apr . 2017. [23] A. Javaheri, C. Brites, F. Pereira and J. Ascenso, “ Subjective and objective quality evaluation of 3D point cloud denoising algorithms, ” Int. Conf. on Multimedi a & Expo Workshops , H ong Kong, Ju l. 2017. [24] A. Javaheri, C. Brites, F. Pereira and J. Ascenso, “ Subjective and objective quality evaluation of compressed point clouds, ” IEEE Workshop on Multimedi a Signal Process ing , Luton, U K, Oct. 2017. [25] K. Christaki et al . , “ Subjective v isual q uality a ssessment of i mmersive 3D m edia c ompressed by o pen -s ource s tatic 3D m esh c odecs ,” Int. Conf. on Multimedi a Modeling , Thessaloniki, Greece , Jan . 2019. [26] E. Dumic, C. R. Duarte and L. A. da Si lva Cruz, “ Subjective evaluation and objective measures for point clouds — State - of - the - art, ” Int. Colloquium on Smart Grid Metrology , Split, Croatia, May 2018. [27] M. Pharr , W. Jakob and G. Humphreys, “ Physically based rendering: from theory to implementa tion , ” Morgan Kaufma nn , 201 6. [28] T. Akenine - Moller , E. Haines and N. Hoffman. “Real - time re ndering , ” AK Peters/CRC Press , 3rd edition, ISBN 987 -1- 56881 - 424 - 7, 2018. [29] V. S. Ramachandran , “ Perception of shape from shading,” Nature, vol. 331 , no. 6152 , pp. 163 - 166, Jan. 1988. [30] R. L. Graham and P. Hell, “On the history of the minimum spanning tree Problem,” Annals of the History of Computing , Jan. - Mar . , 1985. [31] M. Kazhdan , M. Bolitho and H. Hoppe, “Poisson surface reconstruc tion , ” Eurographics Symp. o n Geometry Processing , Sardinia, Italy, Jun. 2006. [32] A. Khatamian and H. R. Arabnia, “Survey on 3D surface reconstruction , ” Journal of Information Processing Systems , vol. 12, no. 3, pp. 338 - 357, Sep. 2016 [33] R. Zhang, P. - S. Tsai, J. E. Cryer and M. Shah, “Shape - from - shading: a survey,” IEEE Trans. on Pattern Analysis and M achine Intelligence , vo l. 21, no. 8, pp. 690 - 706, Aug. 1999. [34] D. F. Fouhey, A. Gupta and A. Zisserman, “From images to 3D shape attributes,” IEEE Trans. on Pattern Analysis and Machine Intelligence , vo l. 41, no. 1, pp. 93 - 106, Dec. 2017. [35] D. Girardeau - Mont aut, “Cloud Compar e — 3D point cloud and mesh processing software, ” Availab le : http://www.cloudcompare.org/ . [36] R.B. Radu and S. Cousins , “3D is h ere: Point Cloud Library (P CL) , ” IEEE Int. Conf. on Robotics and Automation , Shanghai, China, M ay 2011. [37] J. Kammerl, N. Blodow, R. B. Rusu, S. Gedikli , M. Beetz and E. Steinbach, “ Real - time compression of point cloud streams, ” Int. Conf. on Roboti cs and Automation , Saint Paul, MN, USA, M ay 2012. [38] G. Ni gel and N. Martin, “ Range enc oding: a n algorithm for removing redundancy from a digitized message, ” Video and Data Recording Conf. , Southampton, UK, Jul . 1979. > REPLACE THIS LINE WITH YOUR PAPER IDENTIFICATION NUMBER (DOUBLE - CLICK HERE TO EDIT) < 16 [39] K. Mammou et al. , “G- PCC c odec description v1 ,” ISO/IEC M PEG N18189 , Marrakec h, Morocco , Jan . 2019. [40] V. Zakharchenko et al. , “V- PCC codec description v1 .” ISO/IEC MP EG N18017 , Macau, China , Oct . 2018. [41] G. J. Sullivan , J. R. Ohm, W. Han and T. W iegand , “ Overview of the high efficiency video coding (HEVC) standard ,” IEEE Trans. on C ircuits and S ystems for V ideo T echnology , vol. 22, no. 12, pp. 1649 - 1668, Sept. 2012. [42] MPEG 3DG, “ Draft t est c onditions and c omplementary t est material ,” ISO/IEC MPEG N16716 , Geneva, Switzerl and, Jan . 2017. [43] 3DG Group, “ Common test conditions for point cloud compression ,” ISO/IEC MPEG N18474 , Geneva , Switzerland , Mar . 2019. [44] ITU - R Recommendation BT.500 - 13, “ Methodol ogy for the s ubjective a ssessment of the q uality of t elevision p ictures, ” International Telecommunications Union , Geneva, Switzerland, 2012. [45] A. Javaheri , “IST Rendering Point Cloud D ataset”, 201 9, [Online] Available: https://github.com/AlirezaJav/IRPC - Dat aset [Accessed: 23 - Apr - 201 9] [46] I. Viola and T. E brahimi, “An in - depth analysis of single - image subjective quality assessment of light field c ontents”, International Conference on Quality of Multimedia Experience , Berlin, Germany, June 2019 . [47] R. K. Mantiuk , A. Tomaszewska , R. Mantiuk , “Comparison of four subjective methods for image quality assessment”, Computer graphics forum , v ol. 31 , n o. 8 , pp. 2478 - 2491, December 2012. [48] Y. Nehm é , J. - P. Farrugia, F. Dupont, P. Le Callet, G. Lavou é , “ Comparison of subjective methods, with and without explicit reference, for quality assessment of 3D graphics ” , ACM Symposium on Applied Perception, Sep . 2019, Barcelona, Spain. [49] R. Mekuria et al. , “ Evaluation c riteria for PCC (Point Cloud C ompression) ,” ISO/IEC MPEG N163 32 , Geneva, Switze rland, Jun . 2016. [50] D. Tian, H. Ochimizu, C. Feng, R. Cohen and A. Vetro, “ Geometric distortion metrics for point cloud compression, ” Int. Conf. on Image Processing , Beijing, China, Sept . 2017. [51] E. Alexiou and T. Ebrahimi. “ Point cloud quality assessment metric based on angular similarity, ” In t. Conf. on Multimedia & Expo Workshops , San Diego, CA, USA, Jul . 2018. [52] ITU - T Tutorial, “ Objective p erceptual a ssessment of v ideo q uality: f ull r eference t elevision, ” ITU - T Telecommunication Standardization Bureau, Geneva, Swit zerland, 2005. [53] S. Athar and Z. W ang, “A c omprehensive p erformance e valuation of i mage q uality a ssessment a lgorithms”, IE EE Access , vol. 7, pp. 140030 - 140070 Sept . 2019. [54] J. H. Kim and I. Choi, “Choosing the l evel of s ignificance: a d ecision - theoretic a pproach , ” Journal of Accounting, Finance and Business Studies , doi:10.1111/abac.12172, Nov . 2019.
Original Paper
Loading high-quality paper...
Comments & Academic Discussion
Loading comments...
Leave a Comment