Binocular Rivalry Oriented Predictive Auto-Encoding Network for Blind Stereoscopic Image Quality Measurement
Stereoscopic image quality measurement (SIQM) has become increasingly important for guiding stereo image processing and commutation systems due to the widespread usage of 3D contents. Compared with conventional methods which are relied on hand-crafte…
Authors: Jiahua Xu, Wei Zhou, Zhibo Chen
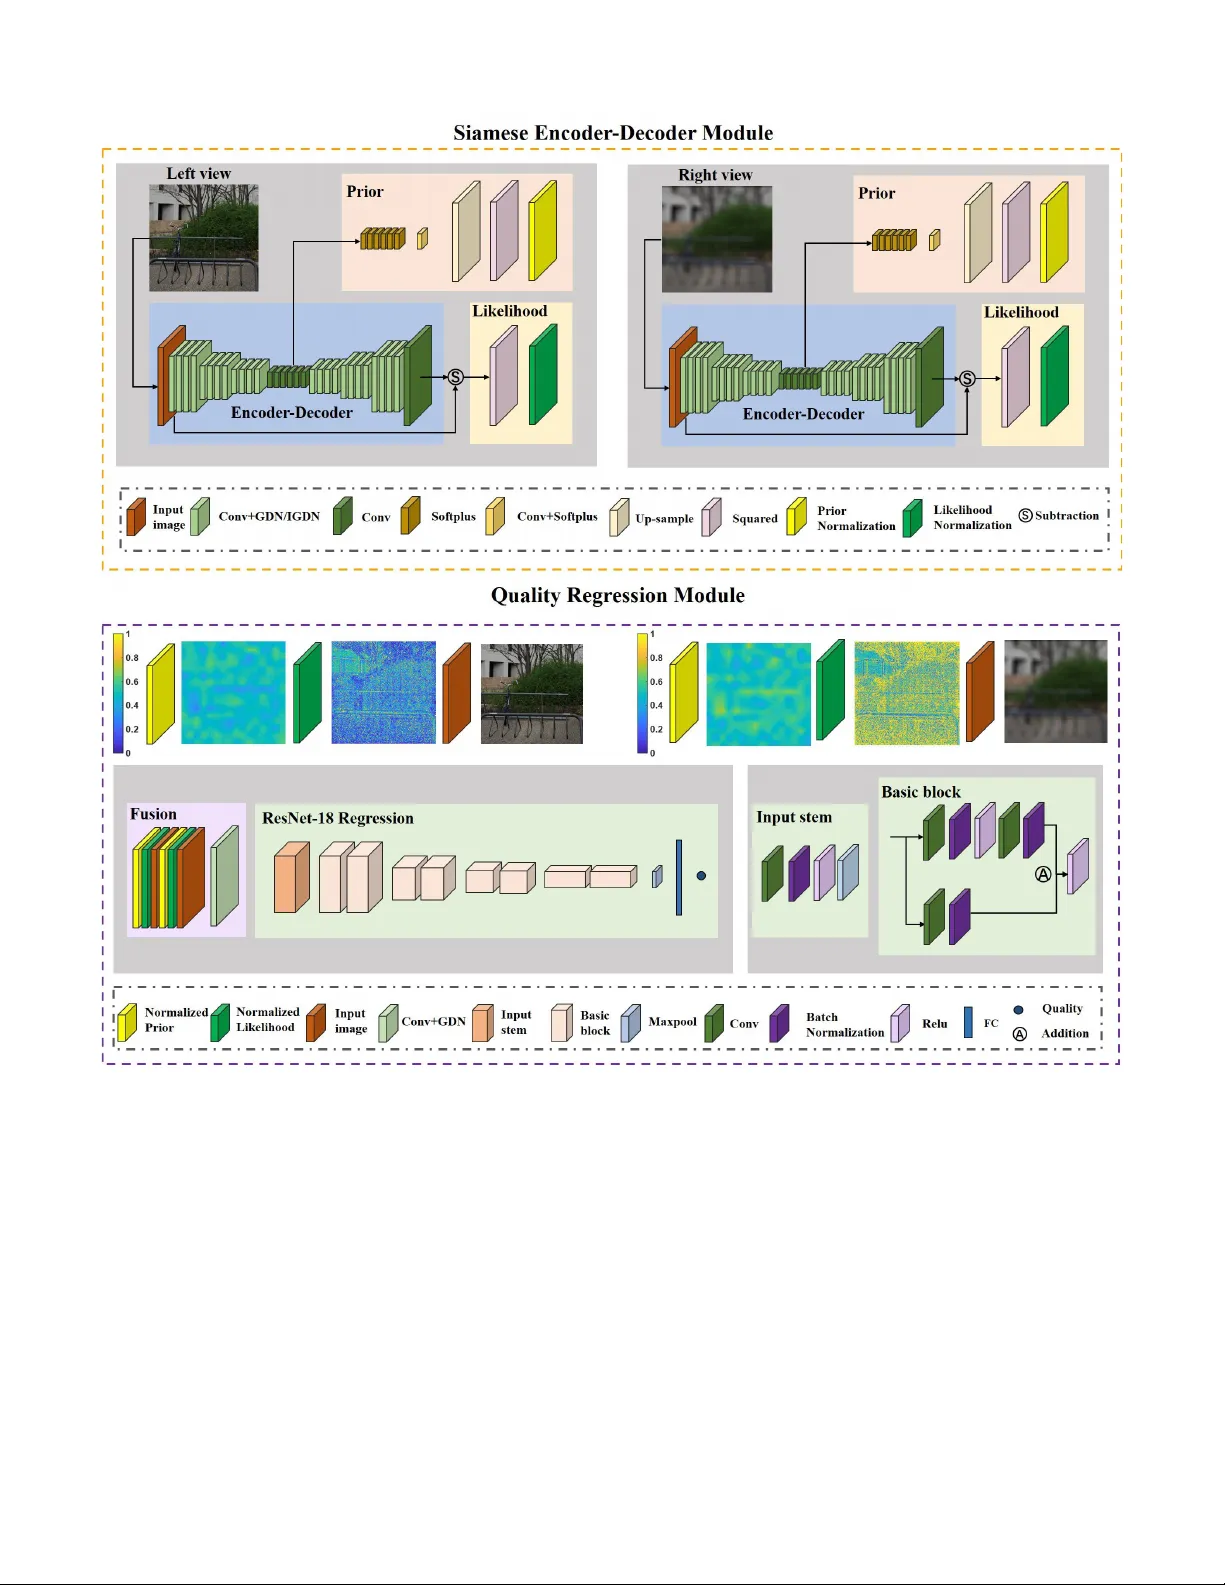
IEEE TRANSA CTIONS ON INSTR UMENT A TION AND MEASUREMENT 1 Binocular Ri v alry Oriented Predicti ve Auto-Encoding Network for Blind Stereoscopic Image Quality Measurement Jiahua Xu, W ei Zhou, Student Member , IEEE , Zhibo Chen, Senior Member , IEEE , Suiyi Ling, Member , IEEE , and Patrick Le Callet, F ellow , IEEE Abstract —Stereoscopic image quality measurement (SIQM) has become increasingly important for guiding stereo image processing and commutation systems due to the widespread usage of 3D contents. Compared with con ventional methods which are relied on hand-crafted features, deep learning oriented measure- ments hav e achiev ed remarkable perf ormance in r ecent years. Howev er , most existing deep SIQM evaluators are not specifically built f or stereoscopic contents and consider little prior domain knowledge of the 3D human visual system (HVS) in network design. In this paper , we develop a Predicti ve A uto-encoDing Network (P AD-Net) for blind/No-Reference stereoscopic image quality measurement. In the first stage, inspired by the predictive coding theory that the cognition system tries to match bottom-up visual signal with top-down predictions, we adopt the encoder - decoder architecture to reconstruct the distorted inputs. Besides, motivated by the binocular rivalry phenomenon, we leverage the likelihood and prior maps generated from the predictive coding process in the Siamese framework for assisting SIQM. In the second stage, quality regression network is applied to the fusion image for acquiring the perceptual quality prediction. The performance of P AD-Net has been extensively evaluated on three benchmark databases and the superiority has been well validated on both symmetrically and asymmetrically distorted stereoscopic images under various distortion types. Index T erms —Siamese encoder -decoder , stereoscopic image quality , 3D human vision, predictiv e auto-encoding, quality measurement. I . I N T R O D U C T I O N S TEREOSCOPY is a technology that can create or enhance the illusion of depth by means of stereopsis for binocular vision. Stereoscopic image, as a popular image format, usually presents two offset images separately to the left and right eye of the observers [1]. High-quality stereoscopic images increase the immersi ve feeling of consumers with the additional 3D depth perception and are essential for a wide scope of daily applications, e.g. 3D reconstruction [2], [3], depth estimation This work was supported in part by NSFC under Grant U1908209, 61632001 and the National K ey Research and Development Program of China 2018AAA0101400 and Alibaba Corporate. (Jiahua Xu and W ei Zhou contributed equally to this work.) (Corresponding anthor: Zhibo Chen.) J. Xu, W . Zhou and Z. Chen are with the CAS Key Laboratory of T echnol- ogy in Geo-Spatial Information Processing and Application System, Univer - sity of Science and T echnology of China, Hefei 230027, China (e-mail: xuji- ahua@mail.ustc.edu.cn; weichou@mail.ustc.edu.cn; chenzhibo@ustc.edu.cn). S. Ling and P . Le Callet are with the ´ Equipe Image, Perception et Interaction, Laboratoire des Sciences du Num ´ erique de Nantes, Univ er- sit ´ e de Nantes, 44300 Nantes, France (e-mail: suiyi.ling@uni v-nantes.fr; patrick.lecallet@univ-nantes.fr). [4], [5] and object detection [6]. Howe ver , through the process of acquisition, compression, transmission, display , etc. original reference stereoscopic images usually suffer from perceptual quality degradation caused by div erse distortion types and degrees [7]–[11]. Thus, to generate high-quality stereoscopic images and improve the user experience [12], [13], it is urgent to ef fecti vely measure the perceptual quality of stereoscopic images. Compared with the conv entional 2D image quality mea- surement (IQM) case, stereoscopic image quality measurement (SIQM) is more challenging owing to a wide v ariety of 2D and 3D influential factors, such as image spatial artifacts, depth perception, visual comfort, and so on [14]. These factors hav e different effects on ev aluating the quality of experience (QoE) for stereoscopic images. Except for [15] that considers image distortion and depth perception quality simultaneously , e xist- ing research works mainly focus on modeling each individual factor for 3D QoE [16]–[19]. In this paper , we aim to study the visually perceptual quality measurement of stereoscopic images. Similar to 2D IQM, according to the availability of orig- inal reference stereoscopic images, SIQM models are typi- cally di vided into three categories: full-reference (FR) [20]– [24], reduced-reference (RR) [25]–[27], and blind/no-reference (NR) [28]–[34] SIQM metrics. For FR SIQM algorithms, full information of the reference image is assumed to be exploited. The earliest FR IQM model in vestigated some of f-the-shelf 2D IQM metrics, such as structural similarity index (SSIM) [35], uni versal quality index (UQI) [36], C4 [37] and so on [38], to measure stereoscopic image quality [39]. Further, disparity information was integrated into the 2D IQM metrics to predict the 3D image quality [20], [21]. Apart from incorporating depth clues, the binocular vision characteristics of the human visual system (HVS) were combined with 2D IQM algorithms. F or example, Gorley and Holliman proposed a ne w stereo band limited contrast (SBLC) metric based on the HVS sensiti vity to contrast changes in high frequency regions [22]. Moreov er , Chen et al. [23] proposed c yclopean images according to the binocular riv alry in the human eyes. In addition, Lin and W u dev eloped a binocular integration based computational model for ev aluating the perceptual quality of stereoscopic images [24]. As for RR SIQM approaches, only part of original non- distorted image data is av ailable. Qi et al. utilized binocular IEEE TRANSA CTIONS ON INSTR UMENT A TION AND MEASUREMENT 2 Fig. 1: The architecture of our proposed P AD-Net. It consists of a Siamese encoder-decoder module and a quality regression module. For the entire netw ork, giv en paired distorted stereoscopic images and it will predict the perceptual quality score. In the Siamese encoder-decoder module, we calculate the prior and likelihood probability for each vie w image. Then, the left and right view images as well as their likelihood and prior probability maps are feed into the quality regression network for final score computation. perceptual information (BPI) to perform RR SIQM [25]. By characterizing the statistical properties of stereoscopic images in the reorganized discrete cosine transform (RDCT) domain, Ma et al. presented the RR SIQM method [26]. Furthermore, a new RR SIQM metric based on natural scene statistics (NSS) and structural degradation was proposed [27]. Howe ver , in most practical applications, the original pristine image cannot be accessible. Therefore, NR SIQM is inevitably required. Some research works ha ve been studied about NR SIQM. Akhter et al. extracted the local features of artif acts and disparity to ev aluate the perceptual quality of stereoscopic images [28]. Sazzad et al. also e xploited perceptual dif ferences of local features for NR SIQM [29]. Howe ver , these methods are distortion-specific NR SIQM approaches, which are only suitable for JPEG coded stereoscopic image pairs. Thus, sev eral general-purpose NR SIQM metrics have emerged. Chen et al. [30] extracted 2D and 3D NSS features from stereoscopic image pairs. The shape-parameter features were regressed onto subjectiv e quality scores by using the well- known support vector regression (SVR). Su et al. proposed IEEE TRANSA CTIONS ON INSTR UMENT A TION AND MEASUREMENT 3 the stereoscopic/3D blind image naturalness quality (S3D- BLINQ) index by constructing a con vergent cyclopean image and extracting bivariate and correlation NSS features in spatial and wav elet domains [31]. W ith the de velopment of deep learning techniques, deep neural networks (DNN) have achie ved remarkable advantages for many image processing and computer vision tasks [40]– [42]. It also brings improvement for the study on NR SIQM. Specifically , Shao et al. proposed a blind deep quality ev alu- ator for measuring stereoscopic image quality with monocu- lar and binocular interactions based on deep belief network (DBN) [16]. The deep NR stereoscopic/3D image quality ev aluator (DNR-S3DIQE) was proposed, which e xtracted local abstractions and then aggregated them into global features by employing the aggregation layer [32]. In addition, Y ang et al. took into account the deep perception map and binocular weight model along with the DBN to predict percei ved stereo- scopic image quality [33]. In [43], a deep edge and color signal integrity ev aluator (DECOSINE) w as proposed based on the whole visual perception route from e yes to the frontal lobe. Besides, Zhou et al. proposed a dual-stream interactiv e network called stereoscopic image quality assessment network (StereoQA-Net) for NR SIQM [34]. Ho we ver , the abov e- mentioned algorithms consider little prior domain kno wledge of the 3D HVS, and thus having difficulty in accurately predicting the perceptual quality of stereoscopic images with various distortion types and levels. Binocular vision is crucial to quality measurement for stereoscopic images, and can be mainly classified into three categories, namely binocular fusion, ri v alry and suppression [15]. Firstly , if the retina regions of left and right eyes receiv e the same or similar visual contents, binocular fusion happens and the two views are integrated into one single and stable binocular perception [44]. Secondly , binocular riv alry is a phenomenon in 3D vision, in which perception alternates between dif ferent views when two eyes see dif ferent scenes [45]. Thirdly , binocular suppression occurs since the HVS cannot tolerate binocular riv alry for a long time. During binocular suppression, one vie w may be inhibited by the other entirely [15]. Existing researches consider either one or multiple binocular vision mechanisms to assist SIQM and in this paper , we primarily focus on modeling binocular riv alry for SIQM. In con ventional perspecti ve, binocular ri v alry is simulated by low-le vel competition between the input stimulus and it is related to the energy of the stimulus [46], [47]. Recently , more literatures try to e xplain binocular ri valry by the predictive coding theory [48], [49]. It is a popular theory about ho w brain process sensing visual stimuli. According to predictive coding theory , the cognition system tries to match bottom-up visual signal with top-down predictions [50]. Different from the traditional statements that binocular ri v alry is low-le vel inter-ocular competition in early visual cortex, binocular ri valry mechanism based on predictive coding theory (BRM-PC) stresses both on the low-le vel and high-lev el com- petition [48]. Moreover , the BRM-PC is the HVS guided and more inline with human cognition system [49]. Therefore, we believ e that introducing BRM-PC will be beneficial to SIQM. In this paper, we propose a generic architecture called Predictiv e Auto-encoDing Network (P AD-Net), which is an end-to-end network for general-purpose NR SIQM. Our con- tributions of the proposed method are summarized as follows: • W e propose a biologically plausible and explicable pre- dictiv e auto-encoding network through combining the network design with the binocular riv alry mechanism based on predictiv e coding theory [49] which helps to explain the binocular riv alry phenomenon in 3D vision. Specifically , we adopt the encoder -decoder architecture to reconstruct the sensory input and further exploit the Siamese network to generate the corresponding lik elihood as well as prior maps for modeling binocular riv alry in the cognition system. The source code of P AD-Net is av ailable online for public research usage 1 . • W e demonstrate that we can obtain the fusion information to reflect the percei ved differences for symmetrically and asymmetrically distorted stereoscopic image pairs under various distortion types and levels. • Compared with state-of-the-art SIQM metrics, the pro- posed P AD-Net provides more precise quality estimation, especially for those stereopairs under asymmetric distor- tions thanks to the well consideration of binocular riv alry based on predictive coding theory . The remainder sections of this paper are organized as follows. Section II explains the proposed Predictiv e Auto- encoDing Network (P AD-Net) for NR SIQM in details. Sec- tion III presents the experimental results and analysis. In Section IV , we conclude the paper with an outlook on the future work. I I . B I N O C U L A R R I V A L RY M E C H A N I S M B A S E D O N P R E D I C T I V E C O D I N G T H E O RY In this section, we will first describe the predictiv e coding theory and then introduce the binocular riv alry mechanism based on predictive coding theory (BRM-PC) in details. A. Predictive Coding Theory According to [51], the core task of brain is to represent the en vironmental causes of its sensory input. In other words, giv en a sensory input, the cognition system of human brain will predict the en vironmental cause, and gives a hypothesis. The final perceptual content is determined by the hypothesis that generates the best prediction [49]. Numerous predicti ve coding models hav e been proposed, and the simplest is the linear predictiv e coding (LPC) in digital signal processing [53]. Then, the predictiv e coding theory has been applied to efficient encoding in the retina. Rao et al. [52] proposed a hierarchical model to represent the principle of human brain in Fig. 2. The feedback pathways carry the prediction from higher-le vel and the feedforward pathways return the prediction errors between the prediction and sensory input to update the prediction and get the best hypothesis. The model mentioned here is for monocular vision, and it is the basis of binocular ri valry model. 1 http://staff.ustc.edu.cn/ ∼ chenzhibo/resources.html IEEE TRANSA CTIONS ON INSTR UMENT A TION AND MEASUREMENT 4 Fig. 2: Predicti ve coding theory based hierarchical represen- tation of the sensory input [52]. In this model, the feedback pathways carry the prediction from higher-le vel. In addition, the feedforward pathways return the prediction errors between the prediction and sensory input to update the prediction and get the best hypothesis. B. Binocular Rivalry Mechanism Based on Pr edictive Coding Theory According to [45], binocular ri val ry appears when left and right views are gi ven different images, and the perception al- ternates between the two views. It is an important phenomenon when e v aluating the quality of stereoscopic images due to the existence of asymmetrical distortion which means left and right vie ws may suffer from different le vels of distortion. Thus, employing binocular riv alry mechanism is beneficial to the improv ement of stereoscopic image quality measurement. Fig. 3: Simplified schematic of the binocular riv alry mech- anism based on predicti ve coding theory [49]. The black solid arro w is the top-do wn prediction from higher-le v el and the blue dotted arrow is the bottom-up error signals. The hypothesis for left and right view will compete with each other to generate the final perceptual content. Introducing predicti ve coding theory to explain binocular riv alry phenomenon has attracted greater attention from the community in recent years [49]. Compared with the con- ventional perspecti ve that belie v es binocular riv alry is lo w- lev el inter -ocular competition in early visual cortex, BRM-PC stresses both on the low-le vel and high-level competition [54]. In this paper , we adopt the general theoretical framew ork in [49], [55] for SIQM. On the basis of BRM-PC, we percei ve the content since the corresponding hypothesis has the higher posterior probability from the Bayesian perspecti ve [56], [57]. As sho wn in Fig. 3, gi ven a stereoscopic image, our brain normally first determines a hypothesis that can best explain the corresponding stimulus. The perceptual inference depends on the likelihood as well as the prior probability of the hypotheses. Note that we are not going to calculate real probabilities in the proposed method, b ut just try to model the likelihood and prior with a quantity that has similar physical meaning in the BRM-PC described in [49]. The likelihood p ( I | H ) is about how well the hypothesis H predicts the input I . Therefore, we apply the error between the sensory input and the prediction to compute the likelihood map. Specifically , small error denotes large likelihood. Besides, the prior p ( H ) is related to empirical kno wledge (shape, material, lighting) which comes from hypothesis on higher-le vel [57], [58] and is about how probable the hypothesis is. Thus, we generate the prior map with the high-le v el features. Then, the hypotheses for left and right views will compete with each other according to the posterior probability p ( H | I ) computing from prior and likelihood. According to the above analysis, we can conclude that the likelihood and prior are important to obtain perceptual inference during binocular riv alry . The details about how BRM-PC related to our proposed model is presented in the next section. I I I . P R O P O S E D M E T H O D Inspired by the BRM-PC [49], we design the no-reference P AD-Net to automatically predict the perceptual quality of stereoscopic images. The proposed P AD-Net is a Siamese based end-to-end network, including auto predictiv e coding and quality regression modules. Gi ven paired distorted 3D images, they are divided into sub-images with size 256x256 first, then the quality scores of these sub-images are estimated through P AD-Net and aggre gated as a final one as done in [59]. W e pre-train the proposed ‘auto-encoder’ and quality regression module on W aterloo Exploration Database [60] and LIVE 2D Database [61], respecti vely . After that, the entire network is jointly optimized using 3D IQM databases [23], [62] to generate more accurate predictions. In this section, the architecture of our proposed P AD-Net is described first as sho wn in Fig. 1. Then, we introduce the Siamese encoder -decoder module and quality regression module in details. Finally , the training and testing methods of our P AD-Net are presented. A. Overview The architecture of the P AD-Net is depicted in Fig. 1, which contains a Siamese encoder-decoder module and a qual- ity regression module. The Siamese encoder -decoder module represents the processing procedure of left and right view images. It is inspired by the predictive coding theory that the human brain tries to match bottom-up visual stimuli with top-do wn predictions [50]. In Section II, an empirical Bayesian framew ork based on BRM-PC is introduced and the riv alry dominance is calculated from the likelihood and prior probability [63]. Correspondingly , the likelihood and prior are IEEE TRANSA CTIONS ON INSTR UMENT A TION AND MEASUREMENT 5 inferred through the Siamese encoder-decoder in our proposed P AD-Net. In Fig. 1, the normalized prior and likelihood maps are visualized. The higher the value (from blue to yello w) is, the larger the probability . Fig. 1 giv es an example of asymmetrically blurred image, the left view is undamaged while the right view is blurred. Observed from the prior map, the discrepancy between normalized left and right vie w prior maps is not significant since we can still recognize the scene for both vie ws. For image blur , it is reported in [45] that 3D image quality is more af fected by the high-quality vie w . As indicated in the likelihood map, strong edges in the undistorted view tend to gain more probability (yello w color) in binocular riv alry , which demonstrates that subjecti ve judgments are more affected by structural information [35]. For each branch of the Siamese encoder-decoder , four times down conv olution and up conv olution with a stride of 2 pixels are performed to reconstruct the distorted images. Non-linear activ ation function layers follow the first three down conv olution and up con v olution layers to enhance the representation ability of our neural network. W e square the error between the input and reconstructed image as the residual map and utilize this map for likelihood calculation. Moreov er , the high-lev el features are conv olved with a stride of one pixel to change the channel size and upscaled to the same resolution as the input image. In the P AD-Net, we use the reconstruction error to obtain likelihood probability map and the high-lev el representation after four times down con volution to generate prior probability map. The reasons will be giv en in Section III B. Once we get the left and right view images as well as their likelihood and prior probability maps, we can put them into the quality regression module and compute the final quality score. It can be seen from the bottom of Fig. 1 that the quality regression module is composed of 1) fusion for input images and probability maps, 2) ResNet-18 without last tw o layers as feature e xtractor and 3) the final max pooling and fully connected layer . Note that fusion in Fig. 1 includes a one stride con v olution layer and activ ation function layer to match the input size with ResNet-18. The output of the proposed P AD- Net is the predicted quality score of the input stereoscopic image. B. Siamese Encoder -Decoder Module The Siamese encoder-decoder module is inspired by the BRM-PC, which is the HVS guided and able to generate more reliable and interpretable results. Based on the predictiv e coding process in BRM-PC, we adopt the encoder-decoder network structure for image compression from [64], [65], which is a hierarchical structure. In Fig. 2, prediction is adjusted with residual errors to obtain better hypothesis, thus, we employ the squared error between predicted (decoded) image and input image [52] as our loss function l 1 to pre- train the encoder-decoder network as follows: l 1 = 1 M × N × C × K X x,y ,c,k ( I ( k ) ( x, y , c ) − b I ( k ) ( x, y , c )) 2 , (1) b I ( k ) = f 1 ( I ( k ) ; w 1 ) , (2) w 0 1 = arg min w 1 l 1 , (3) where I ( k ) and b I ( k ) represent the k -th input and predicted image. M , N and C are the width, height and channel of I ( k ) and b I ( k ) . K is the batch size of a mini-batch training data. b I ( k ) is estimated via the encoder -decoder netw ork f 1 with weight w 1 . w 0 1 is the weight for encoder -decoder after loss minimization. During the training stage, the output of decoder can be viewed as the feedback prediction in Fig. 2, and the loss is defined as the prediction error between distorted and reconstructed images which can be assumed as the feedforward error signal in Fig. 2. Then, we use the gradient descent algorithm to update w 1 and generate better prediction. Finally , the prediction error will con v erge and reach a stable value. The decoded image w ould not change greatly . Thus, the updating policy of the encoder-decoder network is similar to the prediction coding theory of human brain. Note that the encoder-decoder netw ork is pre-trained on the W aterloo Exploration Database [60], therefore the training data includes both reference and distorted images. T ABLE I: D E TA I L E D C O N FI G U R AT I O N S O F T H E E N C O D E R - D E C O D E R N E T W O R K . Layer Input Shape C × H × W Output Shape C × H × W Kernel size/ Stride/Padding Encoder Con v1+GDN1 3, 256, 256 128, 128, 128 5x5/2/2 Con v2+GDN2 128, 128, 128 128, 64, 64 5x5/2/2 Con v3+GDN3 128, 64, 64 128, 32, 32 5x5/2/2 Con v4 128, 32, 32 192, 16, 16 5x5/2/2 Decoder Uncon v1+IGDN1 192, 16, 16 128, 32, 32 5x5/2/2 Uncon v2+IGDN2 128, 32, 32 128, 64, 64 5x5/2/2 Uncon v3+IGDN3 128, 64, 64 128, 128, 128 5x5/2/2 Uncon v4 128, 128, 128 3, 256, 256 5x5/2/2 1 Con v: Con volution 2 Uncon v: Fractionally-strided con volution 3 GDN: Generalized divisi ve normalization 4 IGDN: In verse generalized di visiv e normalization 5 C × H × W : Channel × Height × Width The structure of the encoder-decoder network is listed in T able I. It is composed of con volution and fractionally-strided con v olution layers [66], generalized divisi ve normalization (GDN) transform and in verse generalized di visiv e normal- ization (IGDN). GDN is inspired by the neuron models in biological visual system and pro ves to be effecti ve in density estimation [67], image compression [65] and image quality assessment [59]. The GDN and IGDN operations are gi ven by: y i ( m, n ) = x i ( m, n ) ( β i + P j γ ij x j ( m, n ) 2 ) 1 2 , (4) b x i ( m, n ) = b y i ( m, n ) · ( b β i + X j b γ ij x j ( m, n ) 2 ) 1 2 , (5) where x i means the i -th channel of x and it is the input of GDN transform. y i is the i -th channel of normalized activ ation feature map and it is the output of GDN operation. Moreover , β and γ are the parameters to be updated in GDN function. Like wise, b x i , b y i , b β and b γ share the same meaning as x i , y i , β and γ for IGDN transform. The goal of our encoder- decoder module is to reconstruct the input sensory instead of IEEE TRANSA CTIONS ON INSTR UMENT A TION AND MEASUREMENT 6 compressing it. Therefore, we remove the quantization step in [65] for better reconstruction. By now , we can get the high-level causes (high-level fea- tures) and reconstructed image from the input sensory in the proposed Siamese encoder-decoder module. Then, according to the BRM-PC [49], the left and right views will compete with each other to obtain the best hypothesis which is related to prior and lik elihood. T o be specific, the likelihood is about how well the hypothesis predicts the input and the prior is about how probable the hypothesis is and concern with empirical knowledge [57]. Corresponding to the physical meaning of likelihood and prior , we first obtain the k -th squared residual error map E ( k ) in the mini-batch of a size of K to calculate likelihood as follows: E ( k ) = 1 C X c ( I ( k ) c − b I ( k ) c ) 2 , (6) where I ( k ) c and b I ( k ) c denote the c -th channel of the input and predicted image. C equals 3 in Eq. 6. The likelihood is used to measure the similarity between I ( k ) c and b I ( k ) c and it is in versely proportional to errors. The training stage of encoder-decoder network can be regarded as the procedure of prediction error minimization. In the Siamese encoder-decoder module, the prior is mod- eled with the high-le vel representation of the sensory input [58] since the prior comes from high-levels in the cognition system, as assumed in empirical Bayes [49], [68]. Thus, the high-lev el features are utilized to generate the k -th prior map P ( k ) . Before being fed into the quality regression module, the squared error map E ( k ) and the prior map P ( k ) are normalized between left and right view as follows: P ( k ) nl = P ( k ) l P ( k ) l + P ( k ) r and P ( k ) nr = P ( k ) r P ( k ) l + P ( k ) r , (7) L ( k ) nl = E ( k ) r E ( k ) l + E ( k ) r and L ( k ) nr = E ( k ) l E ( k ) l + E ( k ) r , (8) where P ( k ) l , P ( k ) r , E ( k ) l and E ( k ) r are the prior and error maps for the k -th left view and right view images in a mini-batch. P ( k ) nl , P ( k ) nr , L ( k ) nl and L ( k ) nr indicate the normalized prior and likelihood probability maps. Note that the error is opposite to the likelihood, that is to say , if the error is large, the likelihood will be small. For example, when computing the likelihood map for left view , the error map of right view is adopted and vice versa. T ABLE II: D E TA I L E D C O N FI G U R AT I O N S O F T H E P R I O R A N D L I K E L I H O O D G E N E R A T I O N N E T W O R K . Layer Input Shape C × H × W Output Shape C × H × W Kernel size/ Stride/Padding Prior Softplus4 192, 16, 16 192, 16, 16 - Con v5+Softplus5 192, 16, 16 1, 16, 16 1x1/1/0 Up-sample6 1, 16, 16 1, 256, 256 - Square7a 1, 256, 256 1, 256, 256 - Normlization8a 1, 256, 256 1, 256, 256 - Likelihood Square7b 1, 256, 256 1, 256, 256 - Normlization8b 1, 256, 256 1, 256, 256 - 2 Normlization: Normalization between left view and right view The detailed structure of prior and likelihood creation is giv en in T able II. W e employ the Softplus activ ation function [69] in prior generation to av oid square negati ve v alues to positiv e values. It is defined as: s ( x ) = log(1 + e x ) . (9) The Softplus function can be regarded as the smoothing version of ReLU function which is similar to the way cerebral neurons being activ ated [70]. C. Quality Re gression Module Based on the distorted stereoscopic images as well as the obtained prior and likelihood probability maps from the Siamese encoder -decoder module, we fuse them as a 3-channel feature map and further feed the 3-channel feature map into the ResNet-18 quality regression network to extract discriminativ e features for quality estimation. ResNet-18 is chosen for its excellent ability of feature extraction [41], [71]. The last two layers including average pooling and fully connected layer are removed for regressing the feature map into a quality score. T able III illustrates the architecture of quality regression network. The input stem and basic block of the ResNet-18 structure are shown in Fig. 1. T ABLE III: D E TA I L E D C O N FI G U R AT I O N S O F T H E Q U A L I T Y R E G R E S S I O N N E T W O R K . Layer Input Shape C × H × W Output Shape C × H × W Kernel size/ Stride/Padding Fusion Conv9+GDN9 10, 256, 256 3, 256, 256 1x1/1/0 Regression ResNet-18 3, 256, 256 512,8,8 - Maxpool10 512,8,8 512,1,1 8x8/8/0 Fc11 512 1 - 3 Fc: Fully connected layer D. T raining and T esting Owing to the limited size of av ailable 3D image quality measurement database, we train the P AD-Net on the sub-image pairs with the resolution of 256 × 256 , the MOS v alue for the entire image is assumed as the quality scores for sev eral sub-images as done in [59]. Thus, sub-images coming from the same test image share the same labels. Moreov er , transfer learning is adopted to solve the problem of lacking labeled data and enhance the prediction accuracy of the network [72]. In blind stereoscopic image quality measurement, it is difficult to predict the MOS v alue precisely [59]. Therefore, we di vide the training stage into three steps: 1) pre-training of encoder-decoder on the pristine and distorted 2D images of W aterloo Exploration Database [60]; 2) pre-training ResNet-18 regression on the pristine and distorted 2D images of LIVE 2D Database [61]; 3) joint optimization on the 3D IQM database. Firstly , encoder-decoder is trained to minimize the differ - ence between predicted and input images which is described in Section III B. Then, we get the weight w 1 for the Siamese encoder-decoder as follo ws: w 0 1 = arg min w 1 l 1 . (10) IEEE TRANSA CTIONS ON INSTR UMENT A TION AND MEASUREMENT 7 Secondly , we utilize the original and distorted 2D images along with the associated MOS scores to pre-train the ResNet- 18 regression network. It is aimed to map the 2D image into a quality score. In addition, ResNet-18 with pre-trained weight on ImageNet is adopted for better initialization. Then, the loss function l 2 for second step pre-training is defined as: l 2 = 1 K X k ( q ( k ) 2 d − b q ( k ) 2 d ) 2 , (11) b q ( k ) 2 d = f 2 ( I ( k ) ; w 2 ) , (12) where q ( k ) 2 d and b q ( k ) 2 d indicate the real MOS and predicted score for the k -th input 2D sub-image I ( k ) in a mini-batch. The weight w 2 for the ResNet-18 regression network f 2 is updated by minimizing l 2 as follows: w 0 2 = arg min w 2 l 2 . (13) Finally , the Siamese encoder-decoder and quality regression module are jointly optimized using stereo image pairs. Since the ultimate purpose of P AD-Net is to estimate the perceptual quality of 3D images, we ag ain adopt the l 2 -norm between the subjectiv e MOS value q 3 d and predicted score b q 3 d as loss function: l 3 = 1 K X k ( q ( k ) 3 d − b q ( k ) 3 d ) 2 , (14) b q ( k ) 3 d = f ( I ( k ) l , I ( k ) r ; w 1 , w 2 , w 3 ) , (15) where I ( k ) l and I ( k ) r represent the input 3D sub-image pairs. f indicates the P AD-Net with encoder -decoder weight w 1 , ResNet-18 regression weight w 2 and weight w 3 which is trained from scratch. Specifically , w 3 includes the parameters in prior generation part of Siamese encoder-decoder module and fusion part of quality regression module. At the joint optimization step, ( w 1 , w 2 ) are initialized with pre-trained weight ( w 0 1 , w 0 2 ) and updated with w 3 through final loss minimization: w ∗ 1 , w ∗ 2 , w ∗ 3 = arg min w 1 , w 2 , w 3 l 3 . (16) In the testing stage, the stereo image is divided into sub- image pairs with a stride of U to cov er the whole content. The predicted qualities of all sub-image pairs are averaged to compute the final perceptual quality score. I V . E X P E R I M E N TA L R E S U LT S A N D A NA LY S I S In this section, we first introduce the databases and per- formance measures used in our experiment. Then, the ex- perimental results of the proposed P AD-Net on the entire LIVE databases and indi vidual distortion type are illustrated. Meanwhile, the visualization results are provided for better explanation. Finally , we conduct the ablation study to verify the effecti veness of each component in our model and measure the computation complexity . A. Databases and P erformance Measures Three benchmark stereoscopic image quality measurement databases are used in our e xperiment including LIVE Phase I [62], LIVE Phase II [23], [30] and W aterloo IVC Phase I [45]. LIVE Phase I [62]: This database contains 20 original and 365 symmetrically distorted stereo image pairs. Fiv e distortion types are included in this database, namely JPEG2000 com- pression (JP2K), JPEG compression (JPEG), additi ve white noise (WN), Gaussian blur (BLUR) and Raleigh fast fading channel distortion (FF). Subjectiv e differential mean opinion score (DMOS) is provided for each degraded stereo image. Higher DMOS value means lower visual quality . LIVE Phase II [23], [30]: It includes 120 symmetrically and 240 asymmetrically distorted stereopairs deri ved from 8 reference images. This database contains the same distortion types as LIVE Phase I. For each distortion type, the pristine image pair is degraded to 3 symmetrically and 6 asymmetri- cally image pairs. Subjectiv e scores are also recorded in the form of DMOS. W aterloo IVC Phase I [45]: This database originates from 6 pristine stereoscopic image pairs. The reference image is altered by three types of distortions, namely WN, BLUR, and JPEG. Altogether , there are totally 78 symmetrically and 252 asymmetrically distorted stereopairs. Subjecti ve mean opinion score (MOS) and individual scores are provided for each stereoscopic image in this database, while higher MOS value means better visual quality . Perf ormance Measure: Three commonly used criteria [73] are utilized in our experiment for performance ev alua- tion, including Spearman’ s rank order correlation coefficient (SR OCC), Pearson’ s linear correlation coefficient (PLCC) and root mean squared error (RMSE). SR OCC is a non-parametric measure and independent of monotonic mapping. PLCC and RMSE e v aluate the prediction accuracy . Higher SR OCC, PLCC and lower RMSE indicate better correlation with human judgements. Before calculating PLCC and RMSE, a fi ve- parameter logistic function [61] is applied to maximize the correlation between subjective ratings and objective metrics. One of the main issues of PLCC and SROCC is that they neglect the uncertainty of the subjecti ve scores [74]. Thus, we also employ the Krasula methodology [74], which could be used to better assess the capabilities of objecti ve metrics by considering the statistical significance of the subjecti ve scores and getting rid of the mapping functions. The basic idea of this model is to determine the reliability of objecti ve models by checking whether they are capable of well 1) distinguishing the significantly dif ferent stimuli from the similar ones, and 2) indicating whether one stimulus are of better/worse quality than the other . T o this end, in the Krasula framework, pairs of stimuli are selected from the database to compute the area under ROC curve of the ‘Different vs. Similar’ cate gory (A UC-DS), area under R OC curv e of the ‘Better vs.W orse’ category (A UC-BW), and percentage of correct classification (CC). Higher A UC-DS and A UC-BW mean more capability to indicate different/similar and better/worse pairs. Higher CC represents better prediction accurac y . Please refer to [74] for IEEE TRANSA CTIONS ON INSTR UMENT A TION AND MEASUREMENT 8 more details. B. P erformance Evaluation In the experiment, the distorted stereo pairs are randomly split into 80% training set and 20% testing set according to [34]. W e adopt the Adam algorithm in the pre-training and joint optimization step. During pre-training, the learning rate α is set as 10 − 4 and lo wered by a f actor of 10 e very 50 epochs. The pre-trained weights are obtained after 100 epochs. Since encoder-decoder should retain its function, the learning rate α 1 for encoder -decoder weight w 1 is set as 10 − 5 to a void drastic change when conducting joint optimization. Moreo ver , the learning rate α 2 for ResNet-18 re gression w 2 is set as half of α 3 for w 3 . α 3 is initialized as 10 − 3 and scaled by 0.25 e very 50 epochs. The learning rate remains unchanged after 200 epochs. W e apply data augmentation by randomly cropping, horizontal and vertical flipping in the training stage [75]. The results are obtained after 300 epochs. During testing, the stride U is set as 192 for width and 104 for height in a slight ov erlapping manner to cov er the whole resolution in LIVE databases as sho wn in Fig. 4. Fig. 4: Crop in a slight overlapping manner during the testing stage. W e compare the proposed P AD-Net with sev eral classic FR, RR and NR SIQM metrics on the LIVE Phase I and II database. The competing FR and RR models include Gorley’ s method [22] , Y ou’ s method [21], Benoit’ s method [20], Lin’ s method [24], Cyclopean MS-SSIM [23], RR-BPI [25], RR- RDCT [26] and Ma’ s method [27]. For NR metrics, some hand-crafted features based algorithms including Akhter’ s method [28], Sazzad’ s method [29], Chen’ s method [30], S3D-BLINQ [31], DECOSINE [43] and deep neural netw ork based models including Shao’ s method [16], CNN [76], DNR- S3DIQE [32], DBN [33], StereoQA-Net [34] are considered in the performance comparison. Note that CNN [76] is computed for left and right view images separately and then av erage the scores for both vie ws. The SROCC, PLCC and RMSE performance for the above metrics and proposed P AD-Net are listed in T able IV where the best results are highlighted in bold. It could be observed from the table that the proposed method outperforms state-of-the-art SIQM metrics, especially on LIVE Phase II database. Since there are more asymmetri- cally distorted images in LIVE II, the proposed P AD-Net is more ef fecti ve for the challenging asymmetric distortion which will be explained in Section III D. T o employ the Krasula methodology [74], significance anal- ysis of the subjective scores are required. Among the three considered 3D IQM databases [23], [30], [45], [62], only the T ABLE IV: O V E R A L L P E R F O R M A N C E C O M PA R I S O N O N L I V E P H A S E I A N D I I D AT A B A S E S . T H E B E S T P E R F O R M I N G R E S U LT S A R E H I G H L I G H T E D I N B O L D . LIVE Phase I LIVE Phase II T ype Metrics SR OCC PLCC RMSE SR OCC PLCC RMSE FR Gorley [22] 0.142 0.451 14.635 0.146 0.515 9.675 Y ou [21] 0.878 0.881 7.746 0.786 0.800 6.772 Benoit [20] 0.899 0.902 7.061 0.728 0.748 7.490 Lin [24] 0.856 0.784 - 0.638 0.642 - Cyclopean MS-SSIM [23] 0.916 0.917 6.533 0.889 0.900 4.987 RR RR-BPI [25] - - - 0.867 0.915 4.409 RR-RDCT [26] 0.905 0.906 6.954 0.809 0.843 6.069 Ma [27] 0.929 0.930 6.024 0.918 0.921 4.390 NR Akhter [28] 0.383 0.626 14.827 0.543 0.568 9.294 Sazzad [29] 0.624 0.624 - 0.648 0.669 - Chen [30] 0.891 0.895 7.247 0.880 0.895 5.102 S3D-BLINQ [31] - - - 0.905 0.913 4.657 Shao [16] 0.945 0.957 - 0.911 0.927 - CNN [76] 0.896 0.933 5.948 0.633 0.634 8.632 DNR-S3DIQE [32] 0.935 0.943 - 0.871 0.863 - DBN [33] 0.944 0.956 4.917 0.921 0.934 4.005 DECOSINE [43] 0.953 0.962 - 0.941 0.950 - StereoQA-Net [34] 0.965 0.973 4.711 0.947 0.957 3.270 Proposed P AD-Net 0.973 0.975 3.514 0.967 0.975 2.446 T ABLE V: S R O C C , P L C C , R M S E A N D K R A S U L A P E R F O R M A N C E E V A L UAT I O N O N T H E W A T E R L O O I V C P H A S E I D A TA BA S E . T H E B E S T P E R F O R M I N G R E S U LT S A R E H I G H L I G H T E D I N B O L D . Metrics SR OCC PLCC RMSE StereoQA-Net 0.955 0.970 4.350 Proposed P AD-Net 0.974 0.979 3.696 Metrics A UC DS A UC BW CC StereoQA-Net 0.894 0.998 0.979 Proposed P AD-Net 0.925 0.999 0.993 W aterloo IVC Phase I [45] is equipped with individual scores. Furthermore, the e xcusable/source code of most of the state- of-the-art NR 3D metrics are not released. Therefore, we could only conduct the Krasula analysis on the W aterloo IVC Phase I dataset and compare the proposed P AD-Net with StereoQA- Net [34], which obtains the best performance on both LIVE Phase I [62] and LIVE Phase II [23], [30] databases. T able V lists the results of SR OCC, PLCC, RMSE and Krasula performance ev aluation, it can be observed from the table that the proposed P AD-Net achiev e the best performance in terms of SR OCC, PLCC, RMSE, A UC-DS, A UC-BW and CC. The results of Krasula performance criteria demonstrate that P AD-Net is the most promising metric in distinguishing stereo images with different qualities. T ABLE VI: R E S U LT S O F T H E T- T E S T O N T H E L I V E P H A S E I A N D I I D A TA BA S E . LIVE Phase I / II Cyclopean MS-SSIM [23] CNN [76] StereoQA-Net [34] Proposed P AD-Net Cyclopean MS-SSIM [23] 0 / 0 -1 / 1 -1 / -1 -1 / -1 CNN [76] 1 / -1 0 / 0 -1 / -1 -1 / -1 StereoQA-Net [34] 1 / 1 1 / 1 0 / 0 -1 / -1 Proposed P AD-Net 1 / 1 1 / 1 1 / 1 0 / 0 Moreov er , we conduct significance t-tests using the PLCC values of 10 runs [32] to verify whether our proposed model is statistically better than other metrics. T able VI list the results of t-tests on LIVE Phase I and II where ‘1’ or ‘-1’ indicate that the metric in the row is statistically superior or worse than IEEE TRANSA CTIONS ON INSTR UMENT A TION AND MEASUREMENT 9 T ABLE VII: S R O C C P E R F O R M A N C E C O M PA R I S O N F O R I N D I V I D U A L D I S T O RT I O N T Y P E O N L I V E I A N D I I D A TA BA S E S . LIVE Phase I LIVE Phase II T ype Metrics JP2K JPEG WN BLUR FF JP2K JPEG WN BLUR FF FR Gorley [22] 0.015 0.569 0.741 0.750 0.366 0.110 0.027 0.875 0.770 0.601 Y ou [21] 0.860 0.439 0.940 0.882 0.588 0.894 0.795 0.909 0.813 0.891 Benoit [20] 0.910 0.603 0.930 0.931 0.699 0.751 0.867 0.923 0.455 0.773 Lin [24] 0.839 0.207 0.928 0.935 0.658 0.718 0.613 0.907 0.711 0.701 Cyclopean MS-SSIM [23] 0.888 0.530 0.948 0.925 0.707 0.814 0.843 0.940 0.908 0.884 RR RR-BPI [25] - - - - - 0.776 0.736 0.904 0.871 0.854 RR-RDCT [26] 0.887 0.616 0.912 0.879 0.696 0.879 0.737 0.732 0.876 0.895 Ma [27] 0.907 0.660 0.928 0.921 0.792 0.868 0.791 0.954 0.923 0.944 NR Akhter [28] 0.866 0.675 0.914 0.555 0.640 0.724 0.649 0.714 0.682 0.559 Sazzad [29] 0.721 0.526 0.807 0.597 0.705 0.625 0.479 0.647 0.775 0.725 Chen [30] 0.863 0.617 0.919 0.878 0.652 0.867 0.867 0.950 0.900 0.933 S3D-BLINQ [31] - - - - - 0.845 0.818 0.946 0.903 0.899 CNN [76] 0.857 0.477 0.874 0.782 0.670 0.660 0.598 0.769 0.317 0.476 DNR-S3DIQE [32] 0.885 0.765 0.921 0.930 0.944 0.853 0.822 0.833 0.889 0.878 DBN [33] 0.897 0.768 0.929 0.917 0.685 0.859 0.806 0.864 0.834 0.877 StereoQA-Net [34] 0.961 0.912 0.965 0.855 0.917 0.874 0.747 0.942 0.600 0.951 Proposed P AD-Net 0.969 0.889 0.968 0.917 0.996 0.959 0.882 0.962 0.867 0.945 T ABLE VIII: P L C C P E R F O R M A N C E C O M P A R I S O N F O R I N D I V I D UA L D I S T O RT I O N T Y P E O N L I V E I A N D I I D AT A B A S E S . LIVE Phase I LIVE Phase II T ype Metrics JP2K JPEG WN BLUR FF JP2K JPEG WN BLUR FF FR Gorley [22] 0.485 0.312 0.796 0.852 0.364 0.372 0.322 0.874 0.934 0.706 Y ou [21] 0.877 0.487 0.941 0.919 0.730 0.905 0.830 0.912 0.784 0.915 Benoit [20] 0.939 0.640 0.925 0.948 0.747 0.784 0.853 0.926 0.535 0.807 Lin [24] 0.799 0.196 0.925 0.811 0.700 0.744 0.583 0.909 0.671 0.699 Cyclopean MS-SSIM [23] 0.912 0.603 0.942 0.942 0.776 0.834 0.862 0.957 0.963 0.901 RR RR-BPI [25] - - - - - 0.858 0.871 0.891 0.981 0.925 RR-RDCT [26] 0.918 0.722 0.913 0.925 0.807 0.897 0.748 0.810 0.969 0.910 Ma [27] 0.940 0.720 0.935 0.936 0.843 0.880 0.765 0.932 0.913 0.906 NR Akhter [28] 0.905 0.729 0.904 0.617 0.503 0.776 0.786 0.722 0.795 0.674 Sazzad [29] 0.774 0.565 0.803 0.628 0.694 0.645 0.531 0.657 0.721 0.727 Chen [30] 0.907 0.695 0.917 0.917 0.735 0.899 0.901 0.947 0.941 0.932 S3D-BLINQ [31] - - - - - 0.847 0.888 0.953 0.968 0.944 CNN [76] 0.956 0.630 0.983 0.862 0.846 0.685 0.567 0.855 0.455 0.662 DNR-S3DIQE [32] 0.913 0.767 0.910 0.950 0.954 0.865 0.821 0.836 0.934 0.915 DBN [33] 0.942 0.824 0.954 0.963 0.789 0.886 0.867 0.887 0.988 0.916 StereoQA-Net [34] 0.988 0.916 0.988 0.974 0.965 0.905 0.933 0.972 0.955 0.994 Proposed P AD-Net 0.982 0.919 0.978 0.985 0.994 0.981 0.898 0.973 0.997 0.986 the competitiv e metric in the column. The number ‘0’ means that the two metrics are statistically indistinguishable. From T able VI, we can see that our proposed metric is statistically better than other metrics both on LIVE Phase I and II. C. P erformance Evaluation on Individual Distortion T ype W e further inv estigate the capacity of our proposed P AD- Net for each distortion type, the SR OCC and PLCC per- formance are illustrated in T able VII and VIII. The best performing results across listed metrics are highlighted in boldface. As sho wn in T able VII and VIII, our proposed model achiev es competiti ve performance for most of the distortion types. In addition, the scatter plots of DMOS v alues versus objectiv e scores predicted by P AD-Net for each distortion type on LIVE Phase I and II are presented in Fig. 5(a) and 5(b). The linear correlation between DMOS v alues and predicted scores demonstrates the great monotonicity and accuracy of P AD-Net. DMOS value range of JPEG compressed images is roughly narrower than those of other distortion types, making it more difficult to estimate the perceptual image quality . Thus, the PLCC and SR OCC performance for JPEG distortion is generally lower than the other four . (a) (b) Fig. 5: Scatter plots of DMOS v alues against predictions by P AD-Net for individual distortion type on (a) LIVE Phase I and (b) LIVE Phase II. D. P erformance Evaluation for Symmetric/Asymmetric Distor- tion Our proposed P AD-Net is based on the predictive coding theory and applies deep neural networks to model binocular riv alry mechanism for better prediction of the stereo image quality . Binocular riv alry seldom happens in symmetrical dis- tortion but plays an important role in asymmetrically distorted IEEE TRANSA CTIONS ON INSTR UMENT A TION AND MEASUREMENT 10 T ABLE IX: S R O C C P E R F O R M A N C E F O R S Y M M E T R I C A L L Y A N D A S Y M M E T R I C A L LY D I S T O RT E D I M A G E P A I R S O N L I V E P H A S E I I A N D W A T E R L O O I V C P H A S E I D A TA BA S E S . T H E B E S T P E R F O R M I N G R E S U LT S A R E H I G H L I G H T E D I N B O L D . LIVE Phase II W aterloo IVC Phase I T ype Metrics Symmetric Asymmetric Symmetric Asymmetric FR Gorley [22] 0.383 0.056 0.566 0.475 Y ou [21] 0.914 0.701 0.752 0.571 Benoit [20] 0.860 0.671 0.728 0.577 Lin [24] 0.605 0.668 0.688 0.592 Cyclopean MS-SSIM [23] 0.923 0.842 0.924 0.643 NR Akhter [28] 0.420 0.517 - - Chen [30] 0.918 0.834 0.934 0.907 CNN [76] 0.590 0.633 - - S3D-BLINQ [31] 0.937 0.849 - - StereoQA-Net [34] 0.979 0.927 0.957 0.940 Proposed P AD-Net 0.982 0.954 0.985 0.978 image quality measurement. T able IX presents the SR OCC performance for symmetrically and asymmetrically distorted images in LIVE Phase II and W aterloo IVC Phase I databases. P AD-Net demonstrates the extraordinary ability to predict the perceived quality of asymmetrically distorted stereo pairs by well consideration of the visual mechanism in binocular riv alry . W e provide some visualization results of the P AD-Net for better explanation. The fusion maps of distorted images, normalized prior and likelihood from left and right vie ws are depicted in Fig. 6. The colors of fusion map for symmetrically and asymmetrically distorted images are easy to be distin- guished. For symmetrical distortions, the color of fusion maps is gray tone, which means the ri v alry dominance for left and right views are similar . While for asymmetrical distortions, the fusion maps appear green or pink. 3D image quality is more affected by the poor -quality vie w for noise contamination as described in [45]. On the contrary , the perceptual quality is more af fected by high-quality vie w for image blur [45], thus the color tone of fusion maps for noise and blur are visually different. T o be specific, for asymmetrically distorted images, white noise is dif ferent from the other four distortion types since noise tends to introduce high-frequenc y information while the other four distortion types are apt to remove details that correspond to high-frequenc y information. E. Cross Database T ests W e conduct cross database tests to verify the generalization ability of our proposed P AD-Net. Models to be compared are trained on one database and tested on another . T able X presents the PLCC performance for cross database validation. Although P AD-Net does not sho w the best performance when trained on LIVE Phase II and tested on LIVE Phase I, it outperforms other metrics in the second round which is a more challenging task. Since LIVE Phase I only consists of symmetrical distortion while more than half of the 3D pairs in LIVE Phase II are asymmetrically distorted. P AD-Net trained on LIVE Phase I is able to handle the asymmetrical distortion in LIVE Phase II ne ver met before. The PLCC performance on LIVE Phase II not only prov es the generalization and robustness of P AD-Net but also demonstrates the effecti veness Fig. 6: Fusion maps for symmetrically and asymmetrically degraded stereo images under v arious distortion types. of the binocular riv alry mechanism based on predictive coding theory for asymmetric distortion in the proposed method. T ABLE X: P L C C P E R F O R M A N C E O F C R O S S D A TAB A S E R E S U LT S . T H E B E S T P E R F O R M I N G R E S U LT S A R E H I G H L I G H T E D I N B O L D . Metrics T rain LIVE II/T est LIVE I T rain LIVE I/T est LIVE II Shao [16] 0.894 0.779 Chen [30] 0.865 - CNN [76] 0.713 0.656 DBN [33] 0.869 0.852 DECOSINE [43] 0.916 0.846 StereoQA-Net [34] 0.932 0.710 Proposed P AD-Net 0.915 0.854 F . Effects of Network Structur e T ABLE XI: P E R F O R M A N C E E V A L UAT I O N O F D I FF E R E N T S T R U C T U R E A S Q UA L I T Y R E G R E S S I O N N E T W O R K . T H E B E S T P E R F O R M I N G R E S U LT S A R E H I G H L I G H T E D I N B O L D . LIVE Phase I LIVE Phase II Regression Structure SR OCC PLCC RMSE SROCC PLCC RMSE VGG-16 0.913 0.924 5.945 0.858 0.869 5.506 ResNet-18 0.973 0.975 3.514 0.967 0.975 2.446 ResNet-34 0.970 0.974 3.537 0.960 0.961 2.871 ResNet-50 0.968 0.974 3.588 0.963 0.965 2.727 T o explore the influence of different network structures as quality regression network, VGG-16 [40], ResNet-18, 34 and 50 [41] are adopted to make comparisons. The SR OCC, PLCC and RMSE performance on LIVE Phase I and II are reported in T able XI. Firstly , ResNet has superior capability to extract discriminati ve features for quality prediction than VGG structure. Moreover , with the increased depth of ResNet, the performance does not improv e. The possible explanation is that the limited training data requires shallo w architecture. IEEE TRANSA CTIONS ON INSTR UMENT A TION AND MEASUREMENT 11 Generally , very deep networks need a huge amount of training data to achiev e high performance. Howe ver , there are only hundreds of distorted images in LIVE Phase I and II, even with data augmentation, it is far from enough for deeper networks. Lack of training data may cause ov er -fitting problems for deeper neural networks. As a result, ResNet-18 is chosen in this paper to reach better tradeof f. G. Ablation Study Furthermore, ablation study is conducted to v erify the effecti veness of each component in P AD-Net. W e first feed the distorted left and right view images into quality regression module as the baseline. Then, normalized likelihood and prior maps are introduced to provide additiv e information for computing riv alry dominance of both views. Moreover , we compare different fusion methods. Fig. 7: Ablation Study on LIVE Phase I and Phase II Databases. As shown in Fig. 7, simply fusing left and right vie ws can achie ve promising performance on LIVE Phase I which only consists of symmetrically distorted pairs. Ho wev er , the performance degrades seriously on LIVE Phase II ow- ing to the existence of asymmetric distortion. According to the BRM-PC, prior and likelihood probability maps are necessary for 3D image quality estimation. The perfor- mance impro vement on LIVE Phase II v erify the effec- tiv eness of prior and likelihood probability maps obtained through Siamese Encoder -decoder network and further demon- strate the superiority of the HVS guided binocular riv alry mechanism based on predicti ve coding theory . In addition, we compare the Con v+GDN fusion method with the intu- itiv e addition+multiplication method which denotes we ob- tain the posterior probability by multiplying prior and lik e- lihood probabilities. Note that Con v+GDN fusion means GD N ( C onv ( C oncat ( P nl , L nl , I l , P nr , L nr , I r ))) and Addi- tion+Multiplication represents P nl × L nl × I l + P nr × L nr × I r , where I l and I r denote left and right view images, P nl , P nr , L nl , L nr indicate the normalized prior and lik elihood maps for both vie ws. It is shown in Fig. 7 that our proposed method benefits a lot from the Con v+GDN fusion method since the parameters of fusion operation are updated during the training stage to generate the most discriminative feature maps for quality prediction. Therefore, the HVS guided Siamese encoder-decoder module to generate prior and likelihood map and the Con v+GDN fusion method are keys to the success of P AD-Net. H. Computation Comple xity A good metric for blind SIQM should have high prediction accuracy as well as low computational cost. In the experiment, the models are tested on the NVIDIA GTX 1080ti GPU with 11GB memory . The running time for our proposed P AD-Net and other metrics are listed in T able XII. Note that we record the time for predicting quality scores of 50 stereo images with the resolution of 360 × 640 and then average to obtain the time for each 3D image. The results in T able XII sho w that P AD-Net only needs around 0.906 seconds per image which is significantly lower than other metrics. T ABLE XII: T H E C O M P U TA T I O N T I M E O N N V I D I A G T X 1 0 8 0 T I G P U . T H E B E S T P E R F O R M I N G R E S U LT S A R E H I G H L I G H T E D I N B O L D . Metrics CNN [76] StereoQA-Net [34] Proposed P AD-Net T ime(sec) 8.308 2.377 0.906 V . C O N C L U S I O N S In this paper , we explore a no vel deep learning approach for blind stereoscopic image quality measurement according to the binocular ri v alry mechanism based on predicti ve coding theory . Our proposed predicti ve auto-encoding network is an end-to-end architecture inspired by the human brain cognition process. Specifically , we adopt the Siamese encoder-decoder module to reconstruct binocular counterparts and generate the corresponding likelihood as well as prior maps. Moreov er , we incorporate the quality regression module to obtain the final estimated perceptual quality score. The experimental results demonstrate that our proposed P AD-Net correlates well with subjectiv e ratings. In addition, the proposed method out- performs state-of-the-art algorithms for distorted stereoscopic images under a variety of distortion types, especially for those with asymmetric distortions. Furthermore, we also show that the proposed P AD-Net has a promising generalization ability and can achie ve lower time complexity . In future work, we intend to apply PredNet [77] to mimic predictiv e coding theory in our frame work and extend the method to blind stereoscopic video quality measurement. Except for image visual quality , we plan to in vestigate other 3D quality dimensions such as depth perception and visual comfort. R E F E R E N C E S [1] “Stereoscopy . ” [Online]. A vailable: https://en.wikipedia.org/wiki/ Stereoscopy [2] T . Xue, L. Qu, and B. W u, “Matching and 3-d reconstruction of multibubbles based on virtual stereo vision, ” IEEE T ransactions on Instrumentation and Measur ement , vol. 63, no. 6, pp. 1639–1647, 2013. [3] R. Anchini, C. Liguori, V . Paciello, and A. Paolillo, “ A comparison be- tween stereo-vision techniques for the reconstruction of 3-d coordinates of objects, ” IEEE T ransactions on Instrumentation and Measur ement , vol. 55, no. 5, pp. 1459–1466, 2006. IEEE TRANSA CTIONS ON INSTR UMENT A TION AND MEASUREMENT 12 [4] A. Rajagopalan, S. Chaudhuri, and U. Mudenagudi, “Depth estimation and image restoration using defocused stereo pairs, ” IEEE T ransactions on P attern Analysis and Machine Intelligence , vol. 26, no. 11, pp. 1521– 1525, 2004. [5] R. S. Allison, B. J. Gillam, and E. V ecellio, “Binocular depth discrimina- tion and estimation beyond interaction space, ” Journal of V ision , vol. 9, no. 1, pp. 10–10, 2009. [6] Y . Guo, M. Bennamoun, F . Sohel, M. Lu, and J. W an, “ An integrated framew ork for 3-d modeling, object detection, and pose estimation from point-clouds, ” IEEE Tr ansactions on Instrumentation and Measurement , vol. 64, no. 3, pp. 683–693, 2014. [7] A. De Angelis, A. Moschitta, F . Russo, and P . Carbone, “ A vector approach for image quality assessment and some metrological considera- tions, ” IEEE T ransactions on Instrumentation and Measur ement , vol. 58, no. 1, pp. 14–25, 2008. [8] L. Angrisani, D. Capriglione, L. Ferrigno, and G. Miele, “ An internet protocol packet delay variation estimator for reliable quality assessment of video-streaming services, ” IEEE T ransactions on Instrumentation and Measur ement , vol. 62, no. 5, pp. 914–923, 2013. [9] G. Y ue, C. Hou, T . Zhou, and X. Zhang, “Ef fectiv e and ef ficient blind quality ev aluator for contrast distorted images, ” IEEE T ransactions on Instrumentation and Measur ement , vol. 68, no. 8, pp. 2733–2741, 2018. [10] Q. Jiang, W . Gao, S. W ang, G. Y ue, F . Shao, Y .-S. Ho, and S. Kwong, “Blind image quality measurement by exploiting high order statistics with deep dictionary encoding network, ” IEEE T ransactions on Instru- mentation and Measurement , 2020. [11] Q. Jiang, W . Zhou, X. Chai, G. Y ue, F . Shao, and Z. Chen, “ A full- reference stereoscopic image quality measurement via hierarchical deep feature degradation fusion, ” IEEE Tr ansactions on Instrumentation and Measur ement , 2020. [12] F . Rus so, “ Automatic enhancement of noisy images using objective ev aluation of image quality , ” IEEE transactions on Instrumentation and Measur ement , vol. 54, no. 4, pp. 1600–1606, 2005. [13] Y . Que, Y . Y ang, and H. J. Lee, “Exposure measurement and fusion via adaptive multiscale edge-preserving smoothing, ” IEEE T ransactions on Instrumentation and Measurement , vol. 68, no. 12, pp. 4663–4674, 2019. [14] B. Series, “Subjectiv e methods for the assessment of stereoscopic 3dtv systems, ” 2012. [15] Z. Chen, W . Zhou, and W . Li, “Blind stereoscopic video quality assess- ment: From depth perception to overall experience, ” IEEE T ransactions on Image Processing , vol. 27, no. 2, pp. 721–734, 2017. [16] F . Shao, W . Tian, W . Lin, G. Jiang, and Q. Dai, “T oward a blind deep quality ev aluator for stereoscopic images based on monocular and binocular interactions, ” IEEE T ransactions on Imag e Pr ocessing , vol. 25, no. 5, pp. 2059–2074, 2016. [17] W . Zhou, N. Liao, Z. Chen, and W . Li, “3d-hevc visual quality as- sessment: Database and bitstream model, ” in 2016 Eighth International Confer ence on Quality of Multimedia Experience (QoMEX) . IEEE, 2016, pp. 1–6. [18] J. W ang, S. W ang, K. Ma, and Z. W ang, “Perceptual depth quality in distorted stereoscopic images, ” IEEE T ransactions on Imag e Processing , vol. 26, no. 3, pp. 1202–1215, 2016. [19] J. Chen, J. Zhou, J. Sun, and A. C. Bovik, “V isual discomfort prediction on stereoscopic 3d images without explicit disparities, ” Signal Pr ocess- ing: Image Communication , v ol. 51, pp. 50–60, 2017. [20] A. Benoit, P . Le Callet, P . Campisi, and R. Cousseau, “Quality assess- ment of stereoscopic images, ” EURASIP journal on image and video pr ocessing , vol. 2008, no. 1, p. 659024, 2009. [21] J. Y ou, L. Xing, A. Perkis, and X. W ang, “Perceptual quality assessment for stereoscopic images based on 2d image quality metrics and disparity analysis, ” in Pr oc. Int. W orkshop V ideo Process. Quality Metrics Con- sum. Electr on , vol. 9, 2010, pp. 1–6. [22] P . Gorle y and N. Holliman, “Stereoscopic image quality metrics and compression, ” in Stereoscopic Displays and Applications XIX , vol. 6803. International Society for Optics and Photonics, 2008, p. 680305. [23] M.-J. Chen, C.-C. Su, D.-K. Kwon, L. K. Cormack, and A. C. Bovik, “Full-reference quality assessment of stereopairs accounting for riv alry , ” Signal Pr ocessing: Imag e Communication , v ol. 28, no. 9, pp. 1143– 1155, 2013. [24] Y .-H. Lin and J.-L. W u, “Quality assessment of stereoscopic 3d image compression by binocular integration behaviors, ” IEEE transactions on Image Processing , vol. 23, no. 4, pp. 1527–1542, 2014. [25] F . Qi, D. Zhao, and W . Gao, “Reduced reference stereoscopic image quality assessment based on binocular perceptual information, ” IEEE T ransactions on multimedia , vol. 17, no. 12, pp. 2338–2344, 2015. [26] L. Ma, X. W ang, Q. Liu, and K. N. Ngan, “Reorg anized dct-based image representation for reduced reference stereoscopic image quality assessment, ” Neurocomputing , vol. 215, pp. 21–31, 2016. [27] J. Ma, P . An, L. Shen, and K. Li, “Reduced-reference stereoscopic image quality assessment using natural scene statistics and structural degradation, ” IEEE Access , vol. 6, pp. 2768–2780, 2017. [28] R. Akhter, Z. P . Sazzad, Y . Horita, and J. Baltes, “No-reference stereoscopic image quality assessment, ” in Ster eoscopic Displays and Applications XXI , v ol. 7524. International Society for Optics and Photonics, 2010, p. 75240T . [29] Z. Sazzad, R. Akhter , J. Baltes, and Y . Horita, “Objecti ve no-reference stereoscopic image quality prediction based on 2d image features and relativ e disparity , ” Advances in Multimedia , vol. 2012, p. 8, 2012. [30] M.-J. Chen, L. K. Cormack, and A. C. Bovik, “No-reference quality assessment of natural stereopairs, ” IEEE T ransactions on Image Pr o- cessing , vol. 22, no. 9, pp. 3379–3391, 2013. [31] C.-C. Su, L. K. Cormack, and A. C. Bovik, “Oriented correlation models of distorted natural images with application to natural stereopair quality ev aluation, ” IEEE T ransactions on image pr ocessing , vol. 24, no. 5, pp. 1685–1699, 2015. [32] H. Oh, S. Ahn, J. Kim, and S. Lee, “Blind deep s3d image quality ev aluation via local to global feature aggregation, ” IEEE T ransactions on Image Processing , vol. 26, no. 10, pp. 4923–4936, 2017. [33] J. Y ang, Y . Zhao, Y . Zhu, H. Xu, W . Lu, and Q. Meng, “Blind assess- ment for stereo images considering binocular characteristics and deep perception map based on deep belief network, ” Information Sciences , vol. 474, pp. 1–17, 2019. [34] W . Zhou, Z. Chen, and W . Li, “Dual-stream interacti ve networks for no- reference stereoscopic image quality assessment, ” IEEE T ransactions on Image Processing , 2019. [35] Z. W ang, A. C. Bovik, H. R. Sheikh, E. P . Simoncelli et al. , “Image quality assessment: from error visibility to structural similarity , ” IEEE transactions on imag e pr ocessing , vol. 13, no. 4, pp. 600–612, 2004. [36] Z. W ang and A. C. Bovik, “ A univ ersal image quality index, ” IEEE signal pr ocessing letters , vol. 9, no. 3, pp. 81–84, 2002. [37] M. Carnec, P . Le Callet, and D. Barba, “ An image quality assessment method based on perception of structural information, ” in Proceed- ings 2003 International Confer ence on Ima ge Pr ocessing (Cat. No. 03CH37429) , vol. 3. IEEE, 2003, pp. III–185. [38] Z. W ang and E. P . Simoncelli, “Reduced-reference image quality assess- ment using a wavelet-domain natural image statistic model, ” in Human V ision and Electr onic Imaging X , vol. 5666. International Society for Optics and Photonics, 2005, pp. 149–159. [39] P . Campisi, P . Le Callet, and E. Marini, “Stereoscopic images quality assessment, ” in 2007 15th Eur opean Signal Pr ocessing Conference . IEEE, 2007, pp. 2110–2114. [40] K. Simonyan and A. Zisserman, “V ery deep con volutional networks for large-scale image recognition, ” arXiv pr eprint arXiv:1409.1556 , 2014. [41] K. He, X. Zhang, S. Ren, and J. Sun, “Deep residual learning for image recognition, ” in Pr oceedings of the IEEE conference on computer vision and pattern reco gnition , 2016, pp. 770–778. [42] W . Zhou, Q. Jiang, Y . W ang, Z. Chen, and W . Li, “Blind quality as- sessment for image superresolution using deep two-stream conv olutional networks, ” Information Sciences , 2020. [43] J. Y ang, K. Sim, X. Gao, W . Lu, Q. Meng, and B. Li, “ A blind stereo- scopic image quality e v aluator with segmented stacked autoencoders considering the whole visual perception route, ” IEEE Tr ansactions on Image Processing , vol. 28, no. 3, pp. 1314–1328, 2018. [44] I. P . Ho ward, B. J. Rogers et al. , Binocular vision and stereopsis . Oxford Univ ersity Press, USA, 1995. [45] J. W ang, A. Rehman, K. Zeng, S. W ang, and Z. W ang, “Quality prediction of asymmetrically distorted stereoscopic 3d images, ” IEEE T ransactions on Image Pr ocessing , vol. 24, no. 11, pp. 3400–3414, 2015. [46] I. Ohzawa, “Mechanisms of stereoscopic vision: the disparity energy model, ” Current opinion in neurobiolo gy , vol. 8, no. 4, pp. 509–515, 1998. [47] W . J. Levelt, “On binocular rivalry , ” Ph.D. dissertation, V an Gorcum Assen, 1965. [48] P . Dayan, “ A hierarchical model of binocular riv alry , ” Neural Computa- tion , vol. 10, no. 5, pp. 1119–1135, 1998. [49] J. Hohwy , A. Roepstorf f, and K. Friston, “Predictive coding explains binocular riv alry: An epistemological re view , ” Cognition , v ol. 108, no. 3, pp. 687–701, 2008. [50] M. W . Spratling, “ A revie w of predictiv e coding algorithms, ” Brain and cognition , vol. 112, pp. 92–97, 2017. [51] D. Hume, A tr eatise of human natur e . Courier Corporation, 2003. IEEE TRANSA CTIONS ON INSTR UMENT A TION AND MEASUREMENT 13 [52] R. P . Rao and D. H. Ballard, “Predictive coding in the visual cortex: a functional interpretation of some extra-classical receptive-field effects, ” Natur e neur oscience , vol. 2, no. 1, p. 79, 1999. [53] J. Makhoul, “Linear prediction: A tutorial review , ” Pr oceedings of the IEEE , vol. 63, no. 4, pp. 561–580, 1975. [54] D. A. Leopold and N. K. Logothetis, “ Activity changes in early visual cortex reflect monkeys’ percepts during binocular ri valry , ” Natur e , vol. 379, no. 6565, pp. 549–553, 1996. [55] Z. Chen, J. Xu, C. Lin, and W . Zhou, “Stereoscopic omnidirectional image quality assessment based on predictive coding theory , ” IEEE Journal of Selected T opics in Signal Pr ocessing , 2020. [56] K. Friston, “Functional integration and inference in the brain, ” Pro gr ess in neur obiology , vol. 68, no. 2, pp. 113–143, 2002. [57] D. K ersten, P . Mamassian, and A. Y uille, “Object perception as bayesian inference, ” Annu. Rev . Psychol. , vol. 55, pp. 271–304, 2004. [58] D. Ulyanov , A. V edaldi, and V . Lempitsky , “Deep image prior, ” in Pr oceedings of the IEEE Conference on Computer V ision and P attern Recognition , 2018, pp. 9446–9454. [59] K. Ma, W . Liu, K. Zhang, Z. Duanmu, Z. W ang, and W . Zuo, “End-to- end blind image quality assessment using deep neural networks, ” IEEE T ransactions on Imag e Pr ocessing , vol. 27, no. 3, pp. 1202–1213, 2017. [60] K. Ma, Z. Duanmu, Q. W u, Z. W ang, H. Y ong, H. Li, and L. Zhang, “W aterloo exploration database: New challenges for image quality assessment models, ” IEEE Tr ansactions on Image Pr ocessing , vol. 26, no. 2, pp. 1004–1016, 2016. [61] H. R. Sheikh, M. F . Sabir, and A. C. Bovik, “ A statistical ev aluation of recent full reference image quality assessment algorithms, ” IEEE T ransactions on image processing , v ol. 15, no. 11, pp. 3440–3451, 2006. [62] A. K. Moorthy , C.-C. Su, A. Mittal, and A. C. Bovik, “Subjectiv e ev aluation of stereoscopic image quality , ” Signal Processing: Imag e Communication , vol. 28, no. 8, pp. 870–883, 2013. [63] F . T ong, M. Meng, and R. Blake, “Neural bases of binocular riv alry , ” T rends in cognitive sciences , vol. 10, no. 11, pp. 502–511, 2006. [64] J. Ball ´ e, V . Laparra, and E. P . Simoncelli, “End-to-end optimized image compression, ” arXiv preprint , 2016. [65] J. Ball ´ e, D. Minnen, S. Singh, S. J. Hwang, and N. Johnston, “V ari- ational image compression with a scale hyperprior , ” arXiv preprint arXiv:1802.01436 , 2018. [66] A. Radford, L. Metz, and S. Chintala, “Unsupervised representation learning with deep con volutional generative adv ersarial networks, ” arXiv pr eprint arXiv:1511.06434 , 2015. [67] J. Ball ´ e, V . Laparra, and E. P . Simoncelli, “Density modeling of images using a generalized normalization transformation, ” arXiv pr eprint arXiv:1511.06281 , 2015. [68] C. Summerfield, T . Egner , J. Mangels, and J. Hirsch, “Mistaking a house for a face: neural correlates of misperception in healthy humans, ” Cer ebral Cortex , vol. 16, no. 4, pp. 500–508, 2005. [69] X. Glorot, A. Bordes, and Y . Bengio, “Deep sparse rectifier neural networks, ” in Proceedings of the fourteenth international conference on artificial intelligence and statistics , 2011, pp. 315–323. [70] V . Nair and G. E. Hinton, “Rectified linear units impro ve restricted boltz- mann machines, ” in Pr oceedings of the 27th international confer ence on machine learning (ICML-10) , 2010, pp. 807–814. [71] K. He, X. Zhang, S. Ren, and J. Sun, “Identity mappings in deep residual networks, ” in European conference on computer vision . Netherlands: Springer , 2016, pp. 630–645. [72] S. J. Pan and Q. Y ang, “ A survey on transfer learning, ” IEEE Tr ans- actions on knowledge and data engineering , vol. 22, no. 10, pp. 1345– 1359, 2009. [73] V ideo Quality Experts Group et al. , “Final report from the video quality experts group on the validation of objective models of video quality assessment, phase ii, ” 2003 VQEG , 2003. [74] L. Krasula, K. Fliegel, P . Le Callet, and M. Kl ´ ıma, “On the accuracy of objectiv e image and video quality models: Ne w methodology for performance evaluation, ” in 2016 Eighth International Conference on Quality of Multimedia Experience (QoMEX) . IEEE, 2016, pp. 1–6. [75] A. Mikołajczyk and M. Grocho wski, “Data augmentation for impro ving deep learning in image classification problem, ” in 2018 international inter disciplinary PhD workshop (IIPhDW) . IEEE, 2018, pp. 117–122. [76] L. Kang, P . Y e, Y . Li, and D. Doermann, “Conv olutional neural networks for no-reference image quality assessment, ” in Pr oceedings of the IEEE confer ence on computer vision and pattern r ecognition , 2014, pp. 1733– 1740. [77] W . Lotter , G. Kreiman, and D. Cox, “Deep predictive coding net- works for video prediction and unsupervised learning, ” arXiv preprint arXiv:1605.08104 , 2016.
Original Paper
Loading high-quality paper...
Comments & Academic Discussion
Loading comments...
Leave a Comment