Advanced Python Performance Monitoring with Score-P
💡 Research Summary
The paper addresses a growing gap in high‑performance computing (HPC) where Python, despite its increasing popularity in scientific simulations, machine learning, and data analysis, lacks robust performance‑analysis tools that can handle the multi‑level parallelism (node, core, accelerator) typical of HPC workloads. Traditional Python profilers such as cProfile or pyprof2calltree are limited to single‑node, single‑process analysis and cannot trace MPI, OpenMP, or CUDA activity. To bridge this gap, the authors present Python bindings for Score‑P, a mature, scalable instrumentation and measurement framework widely used in the HPC community.
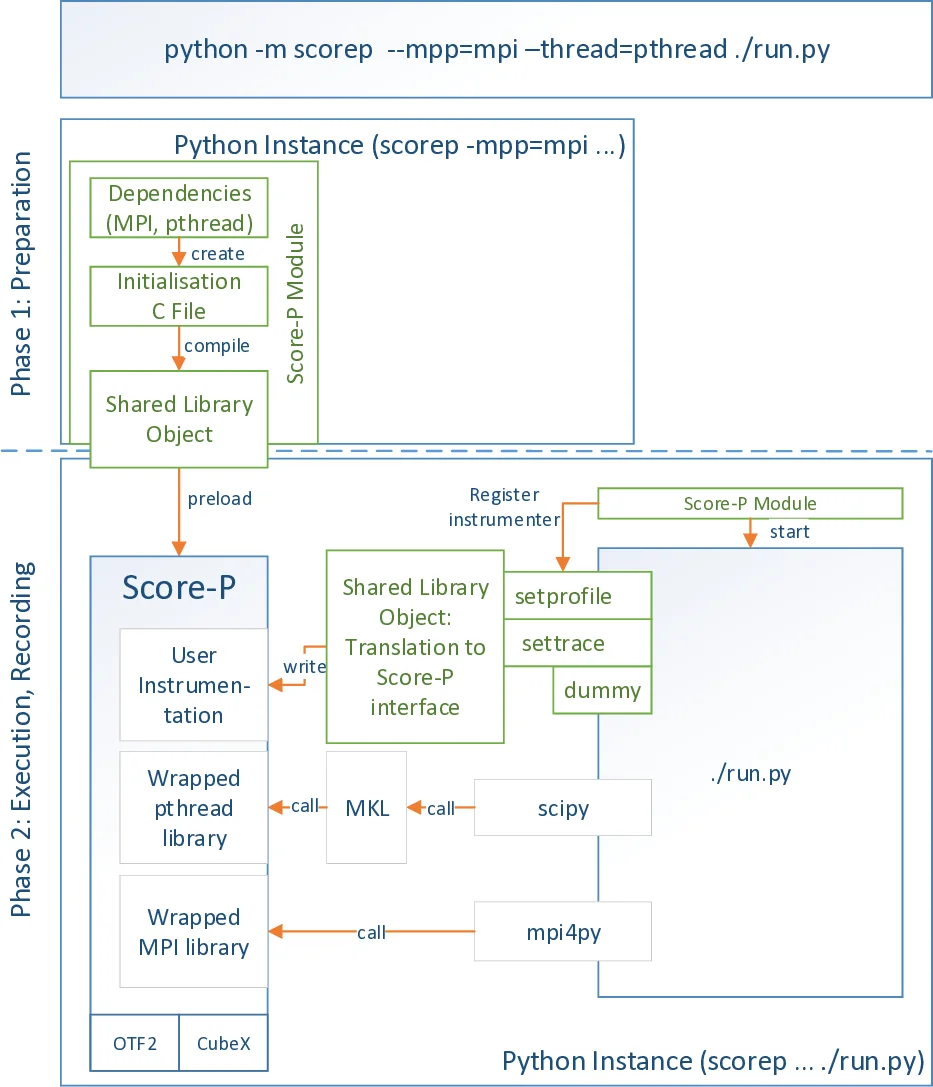
The implementation is divided into two distinct phases. In the preparation phase, users invoke the Score‑P Python module with command‑line options (e.g., –mpp=mpi –thread=pthread) that specify which parallel models should be monitored. The module parses these options, generates the necessary Score‑P initialization code, compiles it into a shared library, and injects the library via the LD_PRELOAD environment variable. Because LD_PRELOAD is processed by the dynamic linker, the Python interpreter must be restarted; this is achieved with os.execve. This phase sets up the measurement environment, attaches the Score‑P runtime, and registers the instrumenter.
During the execution phase, the actual Python script runs under the control of the instrumenter. The instrumenter can be registered using either sys.setprofile() or sys.settrace(), two CPython callbacks that differ in granularity. sys.setprofile() captures function entry/exit events and also C‑function calls (e.g., MPI, pthread, CUDA) through the C‑API, while sys.settrace() records line‑by‑line execution. Both callbacks receive a Python frame object containing the current line number, file path, and other context, which the instrumenter forwards to the Score‑P C‑bindings. These bindings translate the events into Score‑P’s internal representation, enabling the generation of OTF2 traces, Cube profiles, or online analysis via plugins. The resulting data can be visualized with tools such as VAMPIR, showing a combined view of Python function calls, MPI messages, and CUDA kernels.
To quantify the overhead introduced by the instrumentation, the authors designed two micro‑benchmarks. Test case 1 consists of a tight loop that performs only arithmetic, allowing measurement of the per‑iteration cost when no Python functions are entered. Test case 2 adds a simple function call inside the loop, exposing the cost of function‑level instrumentation. Experiments were conducted on the Haswell partition of the TAURUS cluster at TU Dresden (2 × Intel Xeon E5‑2680 v3, 12 cores per socket, ≥64 GB RAM). Each configuration (no instrumentation, sys.setprofile, sys.settrace) was repeated 51 times, and median runtimes were used for linear interpolation of the form t = α + β N, where α is the one‑time setup cost and β is the per‑iteration overhead.
Results show a constant setup overhead of approximately 0.6 seconds for both instrumenters, independent of the chosen callback. The per‑iteration overhead for sys.setprofile is modest: 0.17 µs for the loop‑only test and 0.30 µs when function calls are present. In contrast, sys.settrace incurs a larger per‑iteration cost (0.98 µs for the loop‑only case, rising to 17.9 µs when function calls are traced). The additional cost of sys.settrace stems from its line‑level callbacks, which are invoked for every executed line, whereas sys.setprofile only triggers on function boundaries. Consequently, the authors select sys.setprofile as the default instrumenter, reserving sys.settrace for scenarios where detailed line‑level information is essential and the overhead can be tolerated.
The related‑work section surveys existing Python profiling tools (cProfile, pyprof2calltree, SnakeViz) and HPC tracing frameworks (Extrae, TAU). While cProfile is implemented in C and offers low overhead, it lacks support for MPI/OpenMP/CUDA. Extrae and TAU provide Python bindings via ctypes or the C‑API, but their integration with the broader Score‑P ecosystem is limited. The presented Score‑P Python bindings thus fill a unique niche by offering seamless, scalable tracing of both Python and native HPC constructs within a single, well‑supported analysis pipeline.
In conclusion, the paper demonstrates that Python applications can be instrumented with Score‑P to obtain high‑fidelity performance data across multiple parallel layers without prohibitive overhead. The bindings are open‑source (https://github.com/score‑p/scorep_binding_python) and ready for community adoption. Future work includes exploring sampling‑based instrumentation to further reduce overhead, adding optional capture of exceptions and line‑level events, and providing user‑controlled mechanisms to balance detail against runtime cost.
Comments & Academic Discussion
Loading comments...
Leave a Comment