XGBOD: Improving Supervised Outlier Detection with Unsupervised Representation Learning
A new semi-supervised ensemble algorithm called XGBOD (Extreme Gradient Boosting Outlier Detection) is proposed, described and demonstrated for the enhanced detection of outliers from normal observations in various practical datasets. The proposed fr…
Authors: Yue Zhao, Maciej K. Hryniewicki
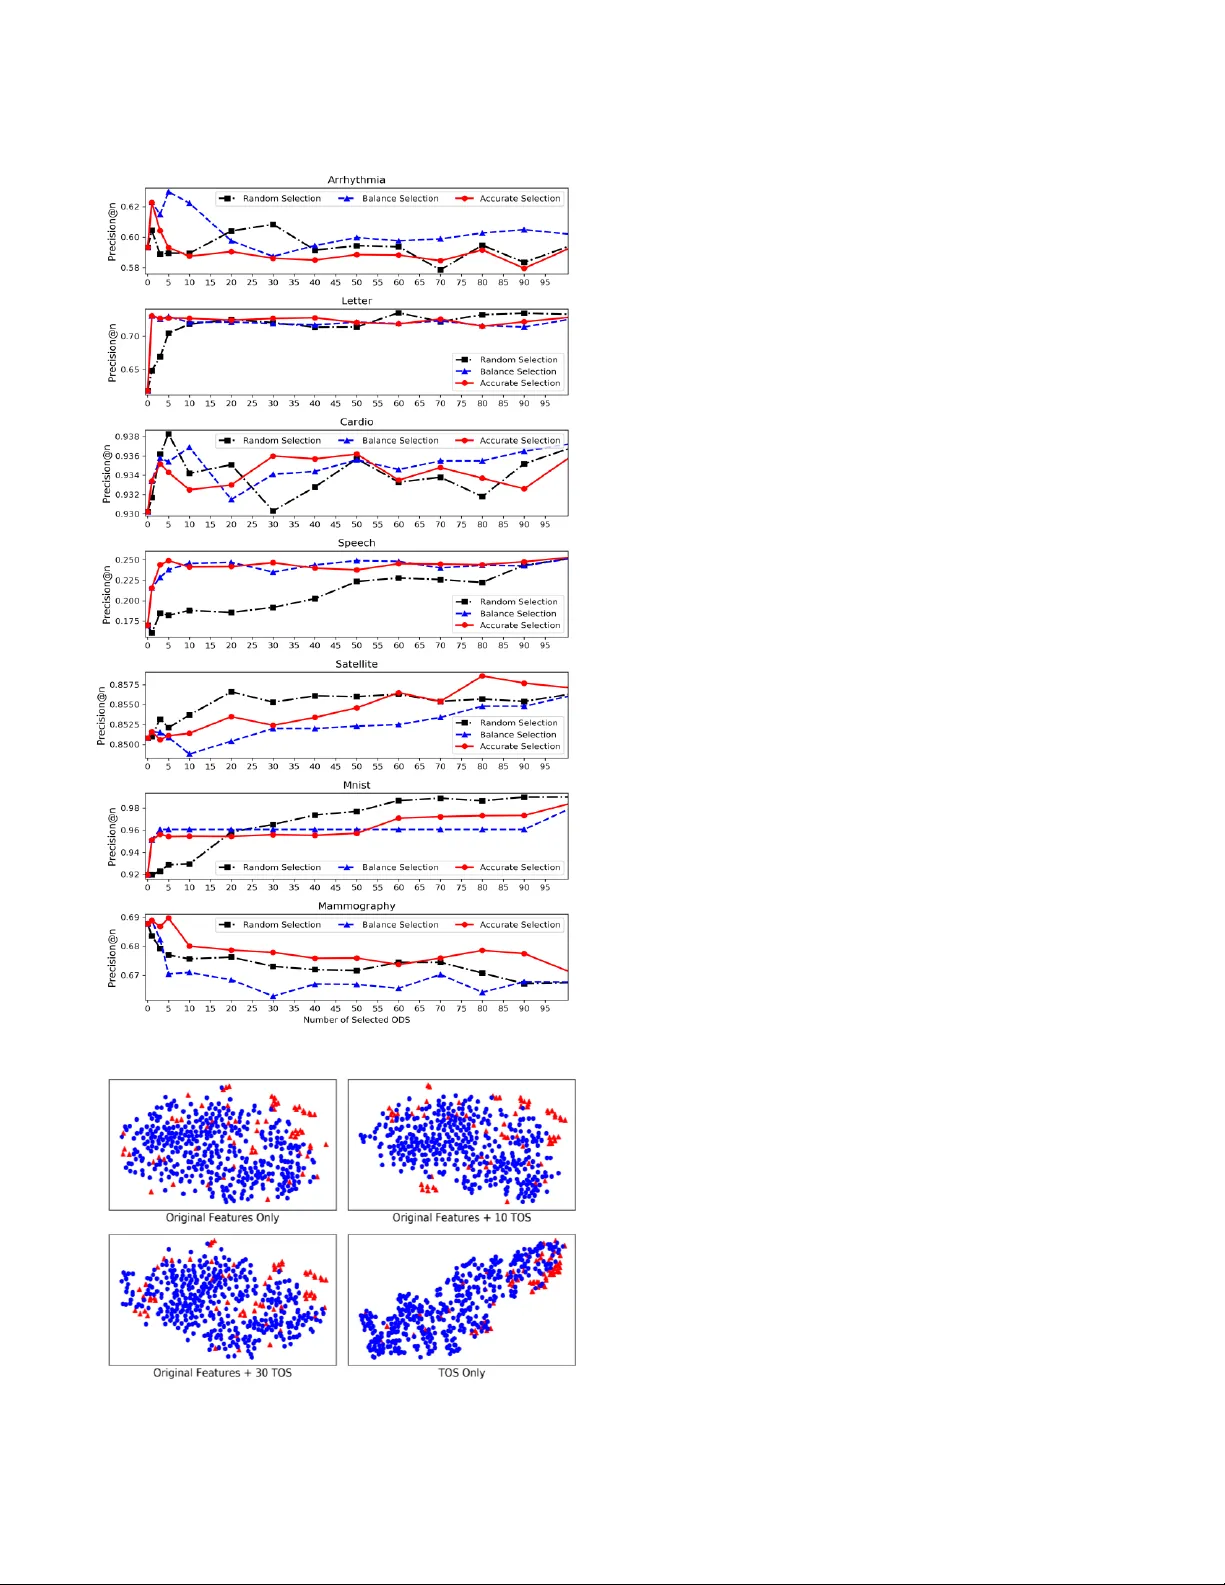
XGBOD: Improving Supervised Outlier Detection with Unsupervised Representation Learning Yue Zhao University of Toronto PricewaterhouseCoopers Toronto, Canada yuezhao@cs.toronto.edu Maciej K. Hryniewicki Data Assurance & Analytics PricewaterhouseCoopers Toronto, Canada maciej.k.hryniewicki@pwc.com Abstract — A new semi-supervised e nsemble algorithm called XGBOD (Extreme Gradient Boosting Outlier Detection) is proposed, described and d emonstrated for the enhanced detection of outliers from normal observations in various practical data sets. The proposed framework combines the strengths of both supervised and unsupervised machine lea rning methods by creating a hybrid approach that exploits each of their individual performance capabilities in outlier detectio n. XGB OD uses multiple unsupervised outlier mining algorithms to extract useful representations from the underlying data that augment the predictive capabilities of an embedded supervised classifier on an improved feature space. The novel a pproach is shown to provide superior performance in comparison to competing individ ual detectors , the full ensemble and two existing representation learning based algorithms across seven outlier datasets. Keywords — semi-supervised m achine learning; data mining; anomaly detection, outlier detection; outlier ensemble; ensemble methods; stacking ; representation learning I. I NTRODUCTION Outlier detection methods are widely used to identify anomalous obser vations in data [1] . However, using supe rvised outlier detection is not tri vial, as outliers in data typically constitute only small proporti ons of the ir encom passing datasets . In additi on, unlike traditional classifica tion methods, the ground truth is often un availabl e in outlier detection [2] – [4] . For super vised algo rithms, such highly imbalanc ed datasets and i nsufficie ntly labeled dat a ha ve le d to limited generaliz ation ca pabilit ies of t hese met hods [2] . Over t he years , numerous unsupervise d algorithms have b een developed for outlier detecti on. These methods speciali ze in explori ng outlier- related in formation such as local de nsities , global correlati on and hie rarchi cal rel ationshi ps for unl abeled data. Ensemble met hods combine multiple base classifie rs to create algorithms that are more ro bust th an t heir i ndivi dual counterpa rts [5] . In the past several decades, numerous ensemble f ramewor ks have been pr oposed, s uch as bagging [6], boosting [7] and stacking [8]. Although ensemble meth ods have been explo red for bot h supervise d and unsupe rvised applicati ons, outl ier ensem ble techniqu es have been rar ely studied [3]. As outli er detection algorithms are typical ly unsupervise d and lack true labels , their co nstructi on is not trivial [ 2], [4] . Most existi ng outlie r ensembl e methods are unsupervise d, using either bagging approach es such as Feat ure Ba gging [9] or boosting ap proaches suc h as SELEC T [3]. However , the predictive capa biliti es of supervised methods are often far too reliant on the proportio n of labelle d data that may exist within the d ataset. Therefore , stacking-bas ed outlier ensembles may be used to leverage both the label -related informatio n using supervised learning as well as the compl ex data repres entat ions with unsuper vised outlie r met hods. The research presented herein extends and i mproves the work of Micenková et al. [10], [11] and Aggarwal et al. [12] t o propose a semi-s upervise d ensemble framew ork for outlier detecti on. T he origi nal feature s pace is augmented by applying various unsupervised outlier detection functions on i tself . Transfor med outlier scores (TOS) gene rated by uns upervi sed outlier detection functio ns are viewed as richer representati ons of the data . Greedy TOS selecti on algorit hms are then applied to prune the augmented feature space, in order to co ntrol the computatio nal complexit y and improve the accuracy of the predicti on. Finally, the supervised ensemble method XGBoost [13] is used as the f inal output classier o n the refined feature space. Th is combi nation of ori ginal feat ures with the outputs of various base unsupervised outlier d etecti on algorith ms allo ws for a better representation of the data , simi lar to the classifi cation meta -framew ork stackin g [8]. The motivati on behin d this resea rch is that unsu pervised outlier detecti on algorithms are better at learning complex patterns in extremely imbalanced datasets than supe rvised methods. The strat egy of takin g the output o f unsupervis ed methods as the input to the supe rvised classifier is regarde d as a process of representati on learning [10], [11] or unsuper vised feature engine ering [12] . Stackin g is used as a combina tion framework to learn the weights of original features and newly generate d TOS automatically . Compare d to existin g works [10], [11] , the approach presented in this researc h does not rely on the costly EasyEnsembl e [14] method to handle data imbalance by building multi ple ba lanced s amples; rat her, it uses XGBoost [13] instead . In addition , mult iple TOS sele ction methods are designed, evalua ted and compared to achieve a n efficient co mputatio nal budget . Mor eover , XGBO D does not require data pre-processin g in feature combinati on, i.e., feature scaling for logistic r egressi on in [10 ], [11] , leadin g to an easier setup. Lastl y, a tentat ive theoretical explanati on of XGBOD is provided under a recentl y proposed framewor k by A ggarwal and Sathe [15] . Overall, XGBOD is easy to use, effici ent to implement, and em piricall y effectiv e for outlier det ection . II. R ELATED WORK A. Rep resentation Learn ing The effective ness of a machine learni ng algorithm reli es heavily on se lected data represent ations or features [16] , wherein abundant and effective representa tions tend to produce good predict ion results. Som e machine learni ng algorit hms , such as de ep learn ing, are ca pable of learning b oth the mapping from r eprese ntations to outputs as well as the represe ntati ons themselves. However, these algori thms require a large amount of data to extract u seful re pre sentatio ns, which is not typically available in outlier mining . Nonetheless , the concept is easily transfe rable to outlier detection : unsupervised outlier detection methods could be viewed as instru ments to extract richer represent ations from limi ted da ta , which is also known as unsupervise d feature enginee ring [12 ] . This appro ach has been proven to be effective in enriching the data e xpressi on and improvin g the su pervised le arnin g [17] . B. Da ta Imbalance and Extreme Gradien t Boosting Data imbalan ce occurs when a given class (or subset) within the dataset represents an underwhelm ing minority of the overall populati on of classes [ 18]. When dat a imbalance is present, the p erfor mance o f a classifier is generally d egrad ed. Outlier detecti on is a binary classificati on task that is relatively imbalanced [15]. The outliers are inheren tly the minority class , which ma kes the detec tion of outliers pro hibitiv ely diffi cult. To treat data imbalance, bootst rap aggregati ng (Bagging) or EasyEnsem ble methods are involved in o utlier detection [ 10], [11] . EasyEnsembl e builds multiple balan ced subsam ples by down-sampli ng the majority class, and combines th e base classifi er outputs trained o n subsamples , such as majority vote. However, these methods are expensive to execute and t heir performa nce is pro blem-spec ific [19] . Extreme G radient Boosting, comm only refe rred t o as XGBoost, is a tree-based ensemble method develope d b y Chen [13]. It is a scalable and accurat e implementati on of gradi ent boosted trees, explicitly desig ned for optimizi ng the computatio nal s peed and model perform ance. C ompared to establish ed boostin g algorit hms li ke gradie nt boosti ng, XGBoost utilizes a regular izati on term to reduce t he over- fitting effect, yielding better predictions [13] and shorter executio n times [20]. Recent research shows that ensem ble methods with XGBoost have the greatest ability to handle imbalance d datasets r elativ e to other ensemble methods [ 18] . As a result, XGBoost is selecte d as the f inal supervis ed classifier to replace EasyEnse mble in this study. Additionally , XGBoost coul d automatical ly generat e feature importan ce rankings while fittin g the data [20], which is us eful for implement ing a feature pruning scheme to impro ve the computatio nal effi ciency of the a lgorith m presen ted her ein. C. Unsupervised Outlier Detection Method s Unsupervis ed methods do not rely on label informati on and could learn outlier characteris tics throu gh various approac hes , such as local densit y. Developed unsupe rvised outl ier detecti on methods may be categorize d in to four groups [21]: (i) lin ear models such as Princip al Component Analysis; ( ii) Proxi mity- Based Outlie r models, incl uding densit y- or distance-ba sed methods; (iii) statistic al and probabilistic models that rely on value analysis; and (iv) high-di mensional o utlier models such as Isolation Forest . These models are based on different assumpti ons, and yield superior results on certain datasets when the corresp onding assu mptions are met. In this researc h , various types of unsu pervised outlier det ection methods ar e used as b ase detect ors to constru ct a n effectiv e ense mble. D. Outlier Ensemble Numerous ensemble metho ds have b een introduced previously in t he cont ext of outli er det ection [2] , [4] , [12] . The se studies have either combined the outputs of constituent detectors or induced the diversity among different constitu ent detectors with potentially independe nt errors [ 3]. The most straight forwar d combinat ion strategy is aver aging the outputs of various base detec tors aft er the no rmalizat ion, also know n as Full Ensemble. One of the earliest works, Feature Baggi ng [9] , induces diversity by buildin g on a rando mly select ed su bset of features. Rayana and Akogl u adapt the boosti ng approa ch into outlier mi ning [3]. Their alg orithm, S ELECT, gener ates pseudo label informatio n to perform sequential learni ng [3]. It is notewort hy that these frameworks are unsuper vised, and similar to bagging an d boosting methods in traditio nal classifi cation tasks. In this study, we combine th e results o f various unsuper vised detectors v ia a similar supervised approach called Stacking [8]. Stacking has been used recently in combing super vised and unsu pervised ens embles in knowledge base populati on task s [22] . As mentioned by Aggarwal et al. in [12], the key differe nce between classifi cation stac king an d the outlier Sta cking prese nted in t his researc h is that the former utiliz es su pervised methods for represent ation learn ing, whereas this approach relies on unsupervise d methods inst ead. In both ca ses, the final output classier however is s uper vised. E. S emi-supervised Ou tlier Ensemble with Feature Learning Micenková et al. have proposed a semi-supervis ed framework called BORE to leverage the strength of both supervise d and unsupervised metho ds [10 ], [11] . BORE first uses v arious unsupervised outlie r detection methods to generate outlier sco res on the trai ning data. These unsu pervised outlier scores are then combined with the original features to construct the new feature spac e. To combat the data imbalance in outlier data, they use EasyEnsemble [14] to create multiple balanced training samples an d they then average the results of the sampl es. Logistic regress ion with L 2 regularizat ion is applied on the subsamples to identify outliers. To measure the computatio nal cost, they simulate a cost-aware feature selectio n that takes the randoml y generated running cost into account. Simila r to Micenková ’s work, Aggarwal and Sathe discuss a semi-supe rvised outlie r ensemble framewo rk that uses mild super vision in combining with unsupervise d ou tlier models [12]. With access to a small number of outlier labels, they state that one could us e logisti c regress ion or su pport vector mac hines to lea rn the weig hts of bas e detectors. L 1 regulari zation is suggested to prevent overfitting and perform feature selectio n while many d etectors are presented. We include both BORE (logistic regression with L2 regula rization) and logist ic r egressi on with L 1 regularizat ion in this study as baseline algorit hms. III. A LGORITHM DESI GN XGBOD is a th ree-phase framewor k, as depicted in Fig. 1 . In the first phase, new data represen tations are generated . Specific ally, various unsupervise d outlier detectio n methods are applied to the original data to get transforme d outlier scores as new d ata representati ons. In the second phase, a selecti on process is performe d on n ewly generated outlier scores to keep the useful ones . The selected outlier scores are then combined with the original features to become the new feature space. Finally, an XGBoost class ifier is trained on the n ew feature space, an d its output is r egarde d as th e predicti on resul t. A. Ph ase I: Unsupervised Rep resentation Learn ing The propose d approac h is based o n the notion that unsupervise d outlie r scores c an be viewed as a form of learned represent ations o f the origin al data [10] – [12] . Alterna tively, these can also be understood as a form of unsu pervise d feature engineerin g, to au gmen t t he origi nal feat ure space as well. Let the original f eature spa ce nd X denote a set of n data p oints wit h d features. As outlier dete ction is a bi nary classifi cation, vector { 0 ,1 } y assigns outlier labels, where 1 represents outliers and 0 represents n ormal points. Let L be a set of la beled o bservatio ns of X , such th at: 11 ( , ), ..., ( , ) nd nn L x y x y = (1) The outlier scoring functio n is defined as a mappin g functio n () , where each scoring function would outp ut a real-val ued vector ( ) 1 n i X on dataset X as the transfor med outlier scores (TOS) to descri be th e degree of outlyin gness . Outlier scoring functions coul d be any unsupervise d outlier detectio n method. The outputs, TOS, are used as new features to augme nt the original feat ure space . Co mbining k outlier sco ring functio ns togeth er cons tructs a transfor mation function matrix: 1 , ..., k = which generates the outlier score matrix of k base scoring functi ons on the origina l feature space X . Applying ( ) on the original data X , the o utlier sc oring mat rix ( ) X is then gi ven as: ( ) ( ) ( ) 1 , ..., TT nk k X X X = (2) As mentione d above, any unsupervis ed outli er detecti on method could be used as a base outlier s coring function for feature trans formations . However , hete rogene ous base functio ns tend to yield better results, as identical outputs from base functi ons do not greatly contribute to the ense mble [1], [12]. The diversit y among base functions encourages d isti nct data characteris tics to be learne d, leading to an improved generaliz ation abilit y of the ensemble. Furth ermore, highl y correlate d base estimators result in similar errors and d o not contrib ute to the prediction; rath er, they bring unnecessar il y high compu tational burdens t o the overall soluti on . Meanwhile, outlier scoring functions should be accurate as well, as inaccurate o nes degrade the prediction. As a result , there is an inhe rent tr adeoff between diversit y and a ccuracy: Fig. 1. Illustration of XGBOD’s sem i -supervised ap proach using distinct but inaccu rate detectors improves the diversity at the risk of degrad ing the overall predicti ve capabilities . Therefore, a balance b etween diversity and accu racy should be maintai ned to gain an i mproved predic tion result [1], [4]. In this stud y, different types of unsupervise d outlier methods are used as the base outlier scori ng functions, and their parameters are also twea ked to genera te further variation . This design yields a varied collecti on of both acc urate a nd inacc urate TO S. B. P hase II: TOS Selection Once the outlier score matrix ( ) X is generated , it is ready to b e combined with the original features X . In the work of Micenková et al. [11] , X is directly combine d with the entire newl y gener ated dat a represe ntatio n s ( ) X as: ( ) Fe a tur e Spa ce [ , ] nl new XX = (3) where () l d k =+ is the dim ension of t he c ombined feat ure space with d original features and k newly gen erated TOS. Compared to the approach prese nted herein, multiple TOS selectio n methods are desig ned to pick only p ( pk ) TOS from ( ) X for combining with the original features. The reason is closel y related to feature sele ction in machine learning : not all TOS would contribut e to the predicti on . Additiona lly, reducin g the number of selected TOS would speed up the execution as ( i) there are fewer transformati ons to apply on the o riginal data and (ii) the combined f eature spa ces are smaller to lear n on . Three selecti on methods are defin ed , and an empt y set S is initi alized to store the sele cted TOS. Random Selection picks p TOS from ( ) X randomly and adds to S without replacem ent . Accurate Selec tion sele cts the top p most accurate TOS. The accuracy measure could be any appropriate evaluation metric, suc h as the area under receiver operating characteristic curve ( ROC), among others . Let ( ) i AC C denote the ROC of ( ) T i X measured by the grou nd tr uth y . It t hen it eratively selects the most accurate TOS in ( ) X based on the valu e of ( ) i AC C using: ( ) ( , ) T ii ACC ROC X y = (4) Algorithm 1 Balance Selectio n Input : 1 , ..., k = , ground t ruth y , # of TO S = p Output : The Set of Select ed TOS : S Initialize : Select ed TOS : {} S = 1. ( ) ( ) ( ) ( ) m ax X ma x ACC X = /* most accurate* / 2. ( ) m ax S S X /*add s elected TOS to set S */ 3. ( ) ( ) ( ) ma x \ X X X /*remove from t he pool* / 4: while #( ) Sp do 5: for ( ) ( ) i XX do 6. ( ) E q . (5 ) i /*discou nted acc uracy*/ 7. ( ) ( ) ( ) max ma x i XX = 8. ( ) m ax S S X /*add t he curre nt best to set S */ 9. ( ) ( ) ( ) m ax / X X X /*remove from t he pool */ 10. end f or 11. end while 12. return S Balance Sele ction maintains the balance between diversit y and accura cy by p icking the TOS that are both accura te and diverse. For each ( ) ( ) i XX , a gre edy selection is executed based on T OS accuracy calculat ed by Eq. ( 4). To improve diversit y in S at the same time, a d iscounte d accuracy functio n ( ) i is devloped on the basis of Eq. ( 4) as : ( ) #( ) 1 ( , ) subje ct to , 0 i i S ij j ji ACC S ACC = = (5) The Pearson correlati on ( , ) ij is u sed to measure the correlati on between a pair of TOS . The Pea rson correlati on between a TOS and all selected TOS in S is aggregated as #( ) 1 ( , ) S ij j = . If a TOS is highly correlated to the TOS that have already been selec ted in S , a larger denom in ator would be assig ned in Eq. ( 5) to disco unt its a ccuracy . The discounte d accura cy funct ion fav ors accurate TOS that ha ve low correla tions with already select ed TOS in S , thereby discoura ging the with -in set simil arity in S . Until the size of set S equals p , TOS in ( ) X will be evaluate d iterativel y by Eq. (5) . Each time, the TOS with the largest discounted accuracy ( ) ( ) i ma x X is added to S and removed from the candidate pool ( ) X . The work flow is given in Al gorit hm 1. With running one of the TOS selectio n algorit hms above , p TOS are selected as np S . Then the refined feature space, Fe ature Spac e comb , is cre ated by concatenati ng t he original features X by S , as () Fe a tur e Spa ce , n d p com b XS + = . It is noted that () kp − TOS are discarded to improve the algorith m efficie ncy and predicti on. C. Phase III: Prediction with XGBoost A n XGBoost classifie r is applie d on Fe ature Spac e comb to generate the final outpu t. Leveraging XGBoost, the run-time efficienc y and predic ti ve capability of the algo rithm are enhanced d ue to its robus tness to data imbalance and overfitti ng. Addit ionall y, a post-pruning process may be performe d by XGBoost ’s internal feature importan ce . The feature importance is calculated on the feature count s in node splitti ng, when the model is fitted. More aggressi ve TOS pruning is thus possi ble , i.e. selecti ng top q most import ant TOS from S by t he inter nal fea ture ra nking. D. Theoretical Fou ndations Bias-Varia nce tra deoff is widely used to u nderstan d the ge nera lizatio n error of a classificat ion algorithm. Recentl y, Aggarwal and Sathe h ave point ed out that a similar theoretical framework is also applicab le to outlier ensemble [15]. In this view, an outlier ensemble ha s two types of reducible errors: (i) squared bias , cause d by limited ability to fit the data and (ii) variance, caused by the se nsitivit y to the training data . An effective outlier ensemble should successfully control the reducibl e error, g iven that reducin g bias may increase variance and vice versa. In this research, various unsupervised outlier detecti on algorith ms are used to enrich the feature space, which inje cts diversit y in to the model and then combines the results. This is considere d as a variance re duction approach, as combin ing diverse base detectors reduces the variance of outlier ensemble [3], [12] , [15] . However, this may cause inaccura te TOS to be included i n the ensemble , incurring higher model bias. This explains why the full ensemb le (averagi ng all TOS) does not perform well — it may include some inaccurate base d etecto rs with high bias [3 ] . Thus, the TOS design sel ection algorith ms only keep the u seful ones for reducing the bias. Moreover, the ensemble and regulariz atio n mechan isms in XGBoost coul d achieve low varia nce without int roducing much bi as [20] . With various instruments t o redu ce bias and variance, XGBOD is considere d to impr ove the g eneraliz atio n abili ty in all stages. However, the performan ce of XGBOD may be heuris tic and unpredicta ble wi th pathological datasets or a b ad selecti on o f base unsu pervised outlier dete ction fun ctions. IV. E XPERIMENT D ESI GN Two comparison analyses are c onducted with various baselines included . ROC [1], [10], [11] and Precision@ n (P@N) [12] are widel y used for evalu ation in outlier detection ; both are include d herei n. The final sc ores are calculate d by averaging the results of 30 independent trials. To further compare t he perf ormance d ifferenc e, vari ous statis tical tests a re introduce d. Speci fically , the non-parametr ic Friedma n test [23] followed by Nemenyi post-h oc test [24] is used to analyze the differe nces among multiple algorithms, while Wilcoxon rank- sum test is u sed to conduct the p airwise comparisons. In this study, 0.0 5 p is regar ded as s tatisti cally si gnificant . Dataset Points ( n ) Features ( d ) Outliers Arrhythmia 452 274 66 (15%) Letter 1600 32 100 (6.25%) Cardio 1831 21 176 (9.6%) Speech 3686 600 61 (1.65%) Satellite 6435 36 2036 (31.64%) Mnist 7603 100 700 (9.21%) Mammography 11863 6 260 (2.32%) TABLE I. S UMMARY OF D ATASETS A. Ou tlier Datasets Table I summarizes seven real-world datasets used in this study. All da tasets are widely used in outlier research [2], [11], [15], [25], and are public ly accessible wit hin an outlier detecti on repositor y called Odds [26] . The d atasets are split into trai ning sets (60%) a nd tes ting sets ( 40%). B. Ba se Outlier Scoring Function and Parameter Settin g The effecti veness of XGBOD depends o n both the acc uracy and diversit y of the base outli er scoring functions. Therefor e, a wide r ange of unsupe rvised o utlier detec tion algorithms are included. The pruning proces s then selects the most useful on es . In this research, seve n base outlier scoring functions are used : (i) k NN (t he Euclidean distance of the k th nearest neighbor as the outli erness score); (ii) k -Median; (i ii) Avg- k NN (average k nearest neighbor distance as the outlierness score); (iv) L OF [27]; (v) LoOP [28]; (vi) One-Class SVM [29] and (vii) Isolation Forests [25] . The description of these algorit hms is omitted due to brevity . However , it is noted th at k NN, k - Median, Avg- k NN and One-Class SVM herei n are all unsupervise d with no re quireme nts of the g round t ruth . To further induce diversi ty, the parameters of thes e base scori ng functio ns are var ied. For nearest neigh bor-based algori thms includin g k NN, k -Median , Avg- k NN, LOF and LoOP , the range of k is defined as 1 , 2 , 3 , 4 , 5 , 1 0 , 1 5 ,. .. , 1 0 0 . Given that the LoOP algorit hm is comput ationally expensive on large datasets, the narrow er k range of [1 , 3, 5 , 1 0 ] is used . For One- Class SVM, the kernel is fixed to radi al b asis function, and differe nt upper bounds on the fracti on of tr aining errors are used. For Isolati on Forest, the num ber of base estimat ors v aries at 1 0, 3 0 , 5 0 , 7 0 , 1 0 0 , 1 5 0, 20 0 , 2 5 0 . In total, 107 TOS is built fo r each dataset. C. Experiment Setting Experiment I compar es t he performance of d ifferen t frameworks . They use either all TOS or n one TOS (on the original data); no TOS sele ction is in cluded. For example , in the proposed method, XGB_Comb , applies XGB oost directl y on the combined data constructed by the original features and all TO S . Multiple baselin es a re incl uded: (i) Bes t_TOS : the highest sco re among all TO S (unsupervis ed); (ii ) Full_TOS : the average of all TOS scores, equive lent to Full Ensemble (unsuperv ised); (iii) XGB_Orig : XGBoost on the original data with no TOS; (iv) XGB_New : XGBoost on newl y generated TOS only; (v ) L2 _Comb : 2 L logistic regressi on with EnsyEnsem ble on the combined data, also known as BORE in [10] and (vi) L1_Comb [12] : 1 L logisti c regression with EnsyEnsem ble on the combined data. Both L2_Comb and L1_Comb are using EasyEns emble ( 50 bags). XGBoost in both Experiment I and II uses 100 b ase estimators w ith max tree depth at 3 by defa ult. Experiment II analyzes the effect of TOS selecti on . XGBoost is used as t he only classif ier in a ll sett ings . Therefo re, selectin g zero TOS is equivale nt to XGB_Orig and selectin g all TOS is equivalent to XGB_Comb in Experime nt I. From selectin g zero TOS ( XGB_Orig ) to all TOS ( XGB_Com b ) , it would res ult in d istinct feature s paces. The results of selecting differe nt numbers of TOS are analyzed. Besides the number of selected TOS, the results of different selection algorit hms (Random Selecti on , Accurate Selection and Bala nce Selection) are also co mpared. It is noted th at selecting one TOS wi th Accurate S electi on is sam e as usi ng Balance S electi on. V. R ESULTS AND DI SCUSSIO NS A. P rediction Performan ce Ana lysis Table II shows the results of E xperime nt I , which directly compares different classificat ion methods without any TOS selectio n . For clarity, all unsuper vised approac hes are marked with *, and all m ethods applie d on the combined feature space are mar ked wi th # in Table II . The best perf ormer for each dataset is highli ghted i n bold. The F riedman test illustrates that th ere is a sta tistical ly signific ant differe nce among seven algorithms for both ROC ( 2 32 .4 5 = , 0. 00 1 p ) and P@N ( 2 32 .8 8 = , 0. 00 1 p ). However, Nemenyi test is not strong enoug h to show pairw ise differe nces. XGB_C omb achieves the best result on six out of seven datasets except Mammograph y , for both ROC and P@N . For Mammography , XGB_Com b is inferi or to XGB_Orig ; incorp orating TOS does not improve the result in this ca se. One p otential explanati on is t hat Mammography only has 6 features so that not all chosen unsupe rvised met hods can extract useful represe ntations out of such a limited feature space. I n contrast , unsupervise d representati on learni ng markedl y improves the supervised classifier on datasets wit h a high d imensi on feature spa ce, such as Arrhythmia (274 features) , Mnist (10 0 features) and Spee ch (600 featu res). Therefore , uns upervise d repr esentati on lea rning tends to be more use ful whe n a high feature dimensio n is p resente d. It is noted that the final output classifi er should be careful ly chosen while using unsuperv ised represe ntati on learning. One view is that simple linear m odels, such as logistic regression, should be used as the final classifi er for the augmented feature space. In this situation, Easy Ensemble should be used to construct balanced subsamples , since simple model could n ot handle the data imbalance . In contrast, we argue that the combinati on of a simpl e model and E asyEns emble could b e replaced by t he ensemble algorithms with s trong regularizat ion, like XGBoost, for better performance. The experiment result confirms our view . XGB_Comb , L1_Comb and L2_Comb are all applied on the combined feature spa ce (the origi nal featu res + newly gene rated TOS). However, only XGB_Comb has an edge over th e supervised approach with n o TOS ( XGB_Orig ), whil e L 1_Comb and L2_Comb are even inferior to XGB_Orig on Arrhyth mia , Cardio, Satellite and Mnist . Datasets ROC P@N Best_ TOS * Ful l_ TOS * L1 _ Comb # L2_ Comb # XGB_ Orig XGB_ New XGB_ Comb # Best_ TOS * Full_ TOS * L1 _ Comb # L2_ Comb # XGB_ Orig XGB_ New XGB_ Comb # Arrhythmia 0.8288 0.7750 0.8537 0.8545 0.8698 0.8110 0.8816 0.5345 0.4088 0.5530 0.5449 0.5932 0.45 68 0.6002 Letter 0.9368 0.8897 0.9653 0.9685 0.9399 0.9593 0.9729 0.5655 0.3450 0.6653 0.6874 0.6181 0.6679 0.7320 Cardio 0.9449 0.8411 0.9953 0.9879 0.9966 0.9868 0.9976 0.5972 0.3478 0.8925 0.8508 0.9302 0.8477 0.9377 Speech 0.7673 0.5009 0.8515 0.8534 0.7593 0.7819 0.8591 0.1677 0.0441 0.1569 0.2082 0.1696 0.1502 0.2561 Satellite 0.7534 0.6992 0.9156 0.9096 0.9656 0.9254 0.9666 0.6188 0.5040 0.7566 0.7508 0.8508 0.7769 0.8568 Mnist 0.9184 0.8526 0.9890 0.9880 0.9963 0.9980 0.9999 0.4368 0.4147 0.8409 0.8379 0.9195 0.9302 0.9901 Mammography 0.8759 0.8617 0.9410 0.9415 0.9515 0.9105 0.9431 0.3152 0.2609 0.6013 0.5754 0.6877 0.4707 0.6677 Dataset XGB_ Orig XGB_ New XGB_ Comb L1 _ Comb L2_ Comb Arrhythmia 0.3963 0.2693 0.6181 1.5521 0.6281 Letter 0. 1520 0.9048 1.0286 1.2231 0.5719 Cardio 0.1456 0.1046 1.1174 3.1053 0.6215 Speech 8.1853 2.2833 10.177 5.9067 2.2505 Satellite 0.5018 3.7720 4.1570 144.79 28.252 Mnist 1.6107 3.5495 4.9213 19.359 26.428 Mammography 0.2968 5.2578 5.4165 38.182 1.9436 TABLE II . M ODEL P ERFORMANCE (A VERAGE OF 30 T RIALS ) TABLE III . T RAINING AND P REDIC TION E FFICIENCY (S ECONDS ) Compared with L1_Co mb [12] and L2_Com b [10] , XGB_Comb outp erforms regardin g both ROC and P@N; it brings more than 10% improved P@N on four datasets and even 23.05% improveme nt on Speech . It has been found that L1_Comb an d L2_Comb ha ve clos e perf ormance, co nfirmed by the Wilcox on rank-sum test on L1_Comb and L2_Comb with no statis tic ally signi ficant diffe rence. The analysis of execution ti me is conducted on selected algorith ms, and the TOS generati on stage is n ot measur ed since it de pends strongly on the choice of base algorithm and th e implement ation. T able II I sho ws the exe cution ti me (a verage of 30 trials), and the most efficie nt method with the full combi ned feature space is highlig hted in bold. Clearl y, L1_C omb is generall y leas t efficient an d markedly slower t han L2 _Comb and XGB_Comb ; it is not recommen ded to use for this task. However, t here is no clear winner between L2_Comb and XGB_Comb regarding runnin g efficiency. L 2_Comb is fas ter on four datasets and 2 to 3 times faster than XGB_Comb , while XGB_Comb is the mo st e fficient algorithm on three datasets that is 5 to 7 times faste r than L2_Comb . It is not ed XGB_Comb is the most efficient one on time consuming datasets ( Satellite and Mnist ). Additionally , the authors have not measu red the data pre processing ti me for L 1_Comb and L2_Comb , such as data scalin g, which is not required for XGB_Comb . Combini ng with the analysis of the detect ion performa nce, it is ass umed that XGB_Comb is still a st able choice that brings consistent efficie ncy improvement ove r L1_Comb and m eaning ful improvement o ver L2_Com b o n time-cons uming tas ks. B. Numb er of Selected TOS Fig ure 2 illustrates the XGBoo st’s P@N performance when differe nt numbers of TOS are used to enrich the original feature space, fr om zero ( XGB_Orig ) to all TO S ( XGB_Comb ). Detailed performance metrics are omitt ed for brevity . In general, using a subset of TOS usually generates better results than using all TOS. For insta nce, the best P@N is achieve d by selectin g 5 TOS on Arrhy thmia , 60 TOS on Letter , 5 TOS on Cardio , 80 on Satellit e and 5 o n M ammography . Using all TOS on Mammography even leads to degraded performance which is worse t han no TOS ( XGB_Orig ) . In cont rast, if 5 most accurate TOS ( Accurate _5 ) are selected, the p redicti on performa nce is impr oved. Surprisingly , combinin g only a small number of TOS with the original featu re may still improve the results signi ficantl y. For instance, using the most accurate TOS ( Accurate _1 ) would improve P@N from 0.6181 to 0.7307 on Letter , and improve from 0.7673 to 0.8338 on Speech . This observati on can be e xplained by t he design of XGBoost: it learns the import ant features au tomatical ly by identifyin g most frequent features to split on in base trees [20] . Although only a small number of useful TOS included, XGBoost assigns highe r weights to these key featu res in predicti on. Using t-distri buted stochastic neighbor embeddin g (t-SNE) [30], two-dime nsional visualiza tions of Arrhythmia are presented wi th four distinct feature spaces in Fig. 3 . Augmentin g t he or igin al f eature space with 1 0 TOS ( upp er right) and 30 TOS (lowe r left) improves the data expression over the origin al feature space (upper left), since outliers (red triangles) are more separate d from normal points (blue dots) with TOS. The visualizati on of u sing TOS only (lower right) demonstr ates that TO S are g ood representati ons of the data where outlie rs are easier to be identified . However, deciding the best n umber of TOS to use is non -trivial and possibly data- dependent ; Friedma n Test does not show a statis tical di fferen ce regardi ng the number of TOS. It is underst ood that select ing too few TOS is risky with high model variance, which can be controll ed by selecting more TOS. As a rule of thu mb, includin g all TOS is a safe choice; it often results in decent, if not the b est, pe rforma nce. Besides using the combin ed feature space (the original feature space along with the n ewly generated TOS), usi ng newly g enerate d TOS alone achie ves excelle nt resu lts occasional ly. On Letter and Speech data, using TOS alone outperfo rms the original feature s pace. This does not only prove that TOS can effectively express the data but also implies that the original features may not be necessary for the final classifi er. However, this perfo rmance improvement is in consiste nt. For example, althoug h Fig . 3 suggests using TOS alone results in better data representatio n, using TOS alone has lower ROC than u sing the origi nal f eature space on Arrhyth mia . The same phenomenon has been observed in [10], [11] as well. Thus, the original features cannot be fully replaced by TOS as the qua lity of TOS is heuris tic in the current approac h . Despite, the possibili ty still exists if effecti ve represent ation e xtracti on methods c an be pr oposed. Fig. 2. The effect of number of TOS a nd selection m ethod Fig. 3. t-SNE visualization on Arrhythmi a C. TOS Selection Method Fig ure 2 also shows the comparison of three selection me tho ds r egar ding P@N . On Letter , Card io and Mnist , the Friedman test d oes not show a significant diffe rence. On the remainin g four datasets, the selecti on method performan ces tend to be more arbitrary with signi ficant differe nces, althou gh no algorit hm c onsistentl y outper form ed . Random Selection comes with more uncertaint y. Its performa nce is severel y degraded on Speech by sele cting only one TOS ( 0.1604 ), even wors e than not using TOS (0.1696). Additiona lly, Random Selecti on performs worse than Accurate Selectio n and Bala nce Selecti on on all datasets if onl y selecti ng one TOS. Howe ver, Rando m Selectio n also has pr omising results; it ranks highest on Cardio (10 TOS) and Mnist (90 TOS) . Micenková ’s work [10] a nalyzed the performa nce of Random Selecti on and found it is consistentl y poor. The results presented herein agree that Random Selection is less predicta ble and stable , but it could occasio nally lead to dece nt results. The authors assume the d iscrep ancy is becaus e (i) EasyEnsem ble in [10], [11] is less stable than built-in b agging of XGBoost and (ii) differe nt outl ier datasets have disti nct character istics . While more resea rch is nee ded, it is possible th at Rand om Selecti on exhibi ts a heuristic result . Choosing from Bal ance Selec tion and Accurat e Selection may depen d on the dime nsion of the origi nal feat ure spa ce. Empiricall y, Balance Selection seems to work b etter on the datasets with more features, such as Speech (600 features ) and Arrhyth mia (274 features) . In contrast, Accurat e Selection outperfo rms on Mammograp hy (6 features) and Satellite (36 features) . One assumpti on is Accurate Selection tends to pick TOS generated by a specific type o f outlier detection method with differ ent p arameters, but it is hard f or this type of m ethod to extract distinct but useful representatio ns on high dimensio nal data . Alternati vely, Bala nce Selec tion favors diversit y, leadi ng to g ood results by selecti ng different types of TOS wit h in dependent e rrors. Accurate Selection might be appropria te when the original feature space dimension is low , as emphasis on di versity might not be critica l in t his sit uation. With the number of selected T OS increases, all three selectio ns methods become more compara ble because the number of overlapping TOS r ises as well. As discussed, Random Selecti on is riskie r, and its performance is usually the worst of all thre e algorithms. It is not recommende d especially while sel ecting f ew TOS. How ever, it ma y give s uperio r resu lts sometimes due t o its he uristic nature . Accu rate S electi on is suggested when the d imensi on of the original f eatur es is low , and Balance Selection might be useful with a comple x origin al feature space. Using all TOS like the def ault setting of XGB_Comb coul d be a s afe c hoice in most of the cases. D. Limitations and F uture Directions Numerous studies are underway . Firstly , T OS are extracted from t he original features directly. However, making feature selectio n on the origi nal data ma y eliminate some unnecess ary ones, and TOS can th en be built on the selected features. Secondly, more TOS sele ction methods can be incor parated in future studies, such as post-pruni ng on XGBoost ’s feature importance . Additionally, TO S Selec tion may be replace d by dimensio nality reduction methods, like principal components analysis; TOS coul d be c ombined i nstead of being s elected. VI. C ONCLUSI ONS A new semi-su pervised outlie r ensemble method, XGBOD (Extreme Gradi ent B oostin g O utlier Detectio n), has been proposed, descri bed and demonstrate d for the detection o f outliers in various benchmarked datasets. XGBOD is a thre e- phase system that (i) u ses unsupervise d outlier detection algorith ms to improve data r eprese ntation (ii ) leverages greedy selectio n to keep useful representati ons and the n (iii ) applies an XGBoost class ifier to predict on th e improved feature space. Numerical ex periments on sev en outlier datasets show that XGBOD achieves markedly impro ved results compar ed to competing ap proaches. T his is su pported by the the oretical considera tions t hat indicat e re ductions in vari ance an d bias. The design of XGBOD is motiv at ed by the previo us work of Micenk ová et al. [10], [11] and Aggarwal et al. [12] , whi ch proposed that unsupe rvised outlier detection methods can extract richer outlier data representatio ns than the original feature space . Specificall y, appl ying various establis hed unsupervise d outlier detecti on algorit hms on the original data could generate TOS wit h potential ly better repres entati ons . Furtherm ore, c ombini ng these TOS with the original feature space co uld then i mprove t he ove rall outli er pre diction . This research ext ends these previ ous studies to show that using even very few T OS signific antly improves the outlier detecti on rate. The t-SN E visualizati ons on different feature spaces confirm that TOS help to separate outliers from normal observati on s. To control the computatio nal expense, three TOS selectio n algorit hms hav e been desi gned and tested herein . Recommen dations regarding the sele ction, use and interpret ation of these algorithms have also been provided. In general, Balance Selecti on is p roposed for high-dimensio nal feature spaces a nd A ccurate Selectio n is suggested for da ta with few er features . Random Selection may b e useful in so me cases; h owever, th e resul t is gene rally u npredictab le. Compared to other semi-superv ised outlier ensemble methods, XGBOD provid es better predicti ve capa biliti es , eliminat es the dep endency o f buildi ng balance d subsamples and avera ging the results, and improves efficien cy with more stable execut ion. It is robust enough to handle a n increased range of input features, in that it does not require any feature scaling or missing value imputatio n in data preprocessi ng. To the aut hors’ best knowle dge, XGB OD is t he fi rst complete framework that combi n es un supervise d outlie r representati on with supervised machine learning methods that use ensemble trees . Lastl y, it should be noted that all source codes, datasets and figu res used in t his study are op enly sha red and avail able 1 . R EFERENCES [1] J. R. Pasillas- Dí az and S. Ratté, “An Unsupervised Approach for Combining Scores of Outlier Detection Techniques, Based on Similarity Measures,” Electro n. Notes Theor. Co mput. Sci. , vol . 329, pp. 61 – 77, 2016. [2] C. C. Aggarwal, “Outlier e nsembles: position paper,” SIGKDD Explorations , v ol. 14, no. 2, pp. 49 – 58, 2013. [3] S. R ayana and L. Akoglu, “Less i s More: B uilding Selective Anomaly Ensembles,” TKDD , vol. 10, no. 4, pp. 1 – 33, 2016. [4] A. Zimek, R. J. G. B. Campello, and J. Sander, “Ensembles for unsupervi sed outlier detection: Challenges and research q uestions,” SIGKDD Explor ations , vol. 15, n o. 1, pp. 11 – 22, 2 014. [5] T. G. D ietterich, “Ensemble Methods in Machine Learning,” Mult. Classif. Syst. , vol. 1857, pp. 1 – 15, 2000. [6] L. Breiman, “ Bagging predictors,” Mach. L earn. , vol. 2 4, n o. 2, pp. 123 – 140, 1996. [7] Y. Freund and R. E. Schapire, “A Decision -Theoretic Generalization of On - Line Learning and an Applicati on to Boosting,” J. Comput. Syst. Sci. , vol. 55, no. 1, pp. 119 – 139, 1 997. [8] D. H. Wolpert, “ Stacked generali zation,” Neural Networks , vol. 5, no. 2, pp. 241 – 259, 199 2. [9] A. Lazarevic and V. Kumar, “Feature bagging for outlier detection,” KDD , p. 157, 2005. [10] B. Micenková, B . McWilliams , and I . Assent, “Learnin g Representations f or Outlier D etec tion on a Bud get.” 29 -Jul-2015. [11] B. Micenková, B. McWilliams, and I. Assent, “Learning Outlier Ensembles : The Best o f Both Worlds – Supervised and U nsupervised,” ODD Worksho p on SIGKDD , pp. 1 – 4, 2014. [12] C. C. Aggarwa l and S. Sathe, Outlier ensembles: An i ntroduction . 2017. [13] T. Chen and C. Guestrin, “XGBoost: A Scala ble Tree Boosting System,” KDD , pp. 785 – 794, 201 6. [14] T. Y. Liu, “EasyEnsemble and feature selecti on for imbalance data sets,” in Proceedings - 2009 International Joint Conference on Bioinformatics, Systems Biology and Intelligent Computing, IJCBS 2009 , 2009, pp. 5 17 – 520. [15] C. C. Aggarwal a nd S. Sathe , “Theor etical Foundations and Algorithms for Outlier Ensembl es?,” S IGKDD Explorations , vol. 17, no. 1, pp. 24 – 47, 2015. [16] Y. Bengio, A. Courville, and P. Vin cent, “Representation learning: A review and new perspec tives,” PAMI , vol. 35, no. 8, pp. 1798 – 1828, 2013. [17] G. Forestier and C. Wemmert, “Semi -supervised learning using multiple clusterings with limited labeled data,” Inf. Sci. , vol. 361 – 362, pp. 48 – 65, Sep. 2016. [18] N. Moniz and P. Branco, “Evalu ation of Ensemble Methods in Imbalanced Regression Tasks,” Proc. First Int. Work. Learn. with Imbalanced Dom ains Theory Appl. , vol. 74, pp. 129 – 140, 2017. [19] N. García-Pedrajas, J. Pérez-Rodríg uez, M . García-Pedrajas, D. Ortiz- Boyer, and C. Fyfe, “Class imbalance methods for translation initiatio n site reco gnition in DNA sequences,” Knowledge-Based Syst. , vol. 25, no. 1, pp. 22 – 34, F eb. 2012. [20] D. Nielsen, “Tree Boosting W ith XGBoost Why Does XGBoost Win ‘Every’ Machine Learning C ompetition?,” 2 016. [21] C. C. Aggarwa l, Outlier analysis , vol. 9781461463. 2 013. [22] N. F. Rajani and R. J. Mooney, “Supervised and Unsupervised Ensembling for Knowled ge Base Population,” Proc. 2016 Conf. Empir. Methods Nat. L ang. Process. , pp. 1 943 – 1948, 20 16. [23] M. Friedman, “The Use of Ra nks to Avoid the Assump tion of Normality Implicit in the Analysis of Variance,” J. Am. Stat. Assoc. , vol. 32, no. 200, pp. 675 – 701, 1937. [24] P. Nemenyi, “D istributio n- free Multiple Comparis ons,” Princeton University, 1 963. [25] F. T. Liu, K. M. Ting, and Z. H. Zhou, “Isolation forest,” ICDM , pp. 413 – 422, 2008. [26] S. Rayana, “ODDS Library,” 2016. [Online]. Availabl e: http://odds.cs.sto nybrook.edu. [27] M. M . Breunig, H.- P. K riegel, R. T. Ng, and J. Sander, “LOF: Identifying De nsity- Based Local O utliers,” SIGMOD , pp. 1 – 12, 2000. [28] H. - P. Kriegel, P. Kröger, E. Schub ert, and A. Zimek, “LoOP: l ocal outlier probabil ities,” CIKM , pp. 1649 – 1652, 200 9. [29] J. Ma and S. Perkins, “Tim e -series novelty detection using one-class support vector m achines,” IJCNN , vo l. 3, pp. 17 41 – 1745, 2003. [30] L. Van Der Maaten and G. Hinton, “ Visualizi ng Data using t - SNE,” JMLR , vol. 9, pp. 2579 – 2605, 200 8. 1 https://githu b.com/yzhao062/XG BOD
Original Paper
Loading high-quality paper...
Comments & Academic Discussion
Loading comments...
Leave a Comment