3D Contouring for Breast Tumor in Sonography
Malignant and benign breast tumors present differently in their shape and size on sonography. Morphological information provided by tumor contours are important in clinical diagnosis. However, ultrasound images contain noises and tissue texture; clin…
Authors: Dar-Ren Chen, Yu-Chih Lin, Yu-Len Huang
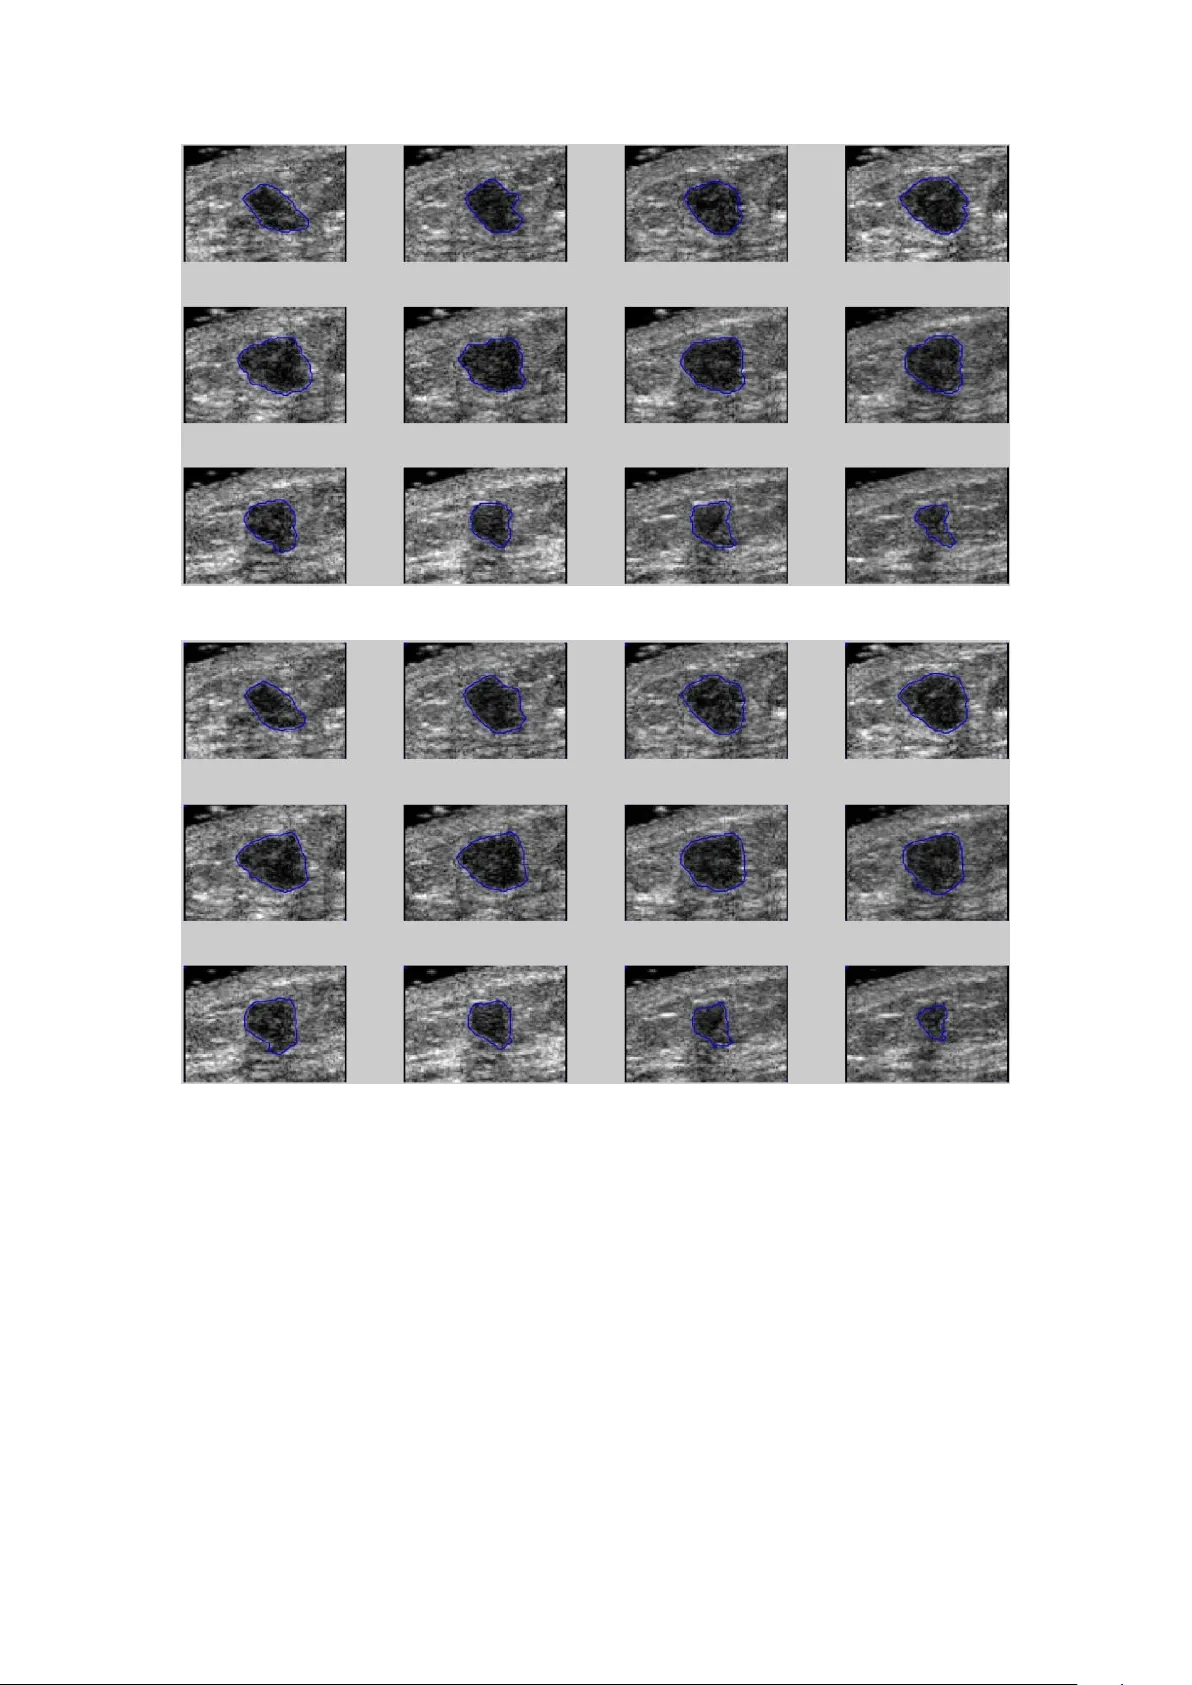
January 17, 2020 3D Contouring for Breas t Tumor in Sonog raphy Dar-Ren Chen, MD † , Yu -Chih Lin * Yu -Len and Hu ang, PhD * * Department of Computer Science, T unghai Universit y , T aichung, T aiwan † Comprehensive Breast Cancer Center , Laboratory of Cancer Research , Changhua Christian Hospital, Changhua, T aiwan Running title: Breast tumor segmentation The total number of words of the manuscript, including entire text from title page to figure legends: 4986 The number of words of the abstract: 177 The number of tables: 1 The number of figures: 8 Addre ss correspondence and r eprint r equests to : Professor , Y u-Len Huang Department of Computer Science T un ghai University No.1727, Sec.4, Taiwan Boulevard , Xitun District, T aichung 407, T aiwan T el: (886)-4-23590121 ex t. 33800 Fax: (886)-4-23591567 E-mail: ylhuang@thu.edu.tw Abstract Malignant and benign brea st tumors present differently in their shape and size on sonography . Morphological information provide d by tumor contour s are important in clinical diagnosis. However , ultrasound images contain noises and tissue texture; clinical diagnosis thus highly depends on the expe rience o f ph y sicians. The manual way to sketch three-dimensional (3D) contours of breast tumor is a time-consuming and complicate task. If auto matic contouring could provide a precise breast tumor contour that mi ght assist phy sicians in making an accurate diagnosis. This stud y presents an efficient method for automatically contourin g breast tumors in 3D sonogra ph y . Th e proposed method utiliz es an efficient segmentation procedure, i.e. lev el-set method (LSM), to a utomatic det ect contours of breast tumors. This study ev aluates 20 ca ses comprising ten beni gn and ten malignant tumors. The results of compute r simulation reveal that the proposed 3D segmentation method provides robust contouring for breast tumor on ult rasound images. This approach consistentl y obtains contours similar to those obtained by manual contouring o f the breast tumor and can save mu ch of the time required to sketch precise contours. Key Words: breast cancer , 3D sonogra phy , ima ge segmentation, level-set method, region growing Introduction Breast c ancer is a tumor emerged from growing mammar y epithe lial cells or lobular , they lost control because of the growth of c ancer cells and then will invade and damage nearby tissues and orga ns or metastasis to other organs through the blood or lymphatic s y stem. However , breast is ric h in blood vessels, lymphatic vessels and lymph nodes, breast cancer cells tend to spread to other organs easily . Breast cancer is one of the most fre quently o ccurring ca ncers in women. A ccording to the American Cancer Society (ACS) statistics, the prevalence of breast cancer rises up every y ear [1] . As medica l technology progress c ontinuousl y and personal health c oncern s increase constantly , making the breast cancer death rate decreased year by year . Thus early detection and early treatment for breast ca ncer would reduce breast cancer mortality . Medical ultra sound is certainly convenient and safe tool for dia gnosing breast tumors, particularly palpable tumors. Modern ultrasound equipment performs rea l-time high-resolution imaging without the use of ionizing radiation and it is relativel y inexpensive and portable. Ultrasound equipment becomes the essential dia gnostic tools for hospitals. Breast ultrasound is someti mes used to evaluate abnormal findings from a screening or diagnostic mammogram or ph y sical exam. Ultrasonic images are markers for the early detection of some breast cancers. The use of ultra so und for the early detection of some breast c ancers c an suppo rt in dif ferentiating between benign and malignant lesions by analy zing the homogeneit y of an internal echo. Computer- aided diagnosi s (CADx ) sy stem c ould assist physicians by extracting useful characteristics of the tumor in ultrasound image as a b asis for diagnosis [ 2, 3]. Three-dimensional (3D) ultrasound images of the breast cancer s creening h ave acquired attention. 3D ultrasonography provides similar imaging quality to conventional two - dimensional (2D) ult rasound and also has the mul ti-sectional c apability to revea l anatomical features what are not originally poss ible on a 2D s y stem. The volume dif ferences between malignant and benign breast tumors is considered a useful characteristic for identifying mali gnant breast tumors [4]. Thus a correct diagnosis might require accurate estimation of the total volume of the tumor and tumor contour . In conventional 2D ultra sound, the expert must mentally construct a 3D impression of tumor based on many 2D ultrasound images. The accuracy of CADx is re lated to the location and extent of tumor , the segmentation of the tumor ha s a direc t impact on the accuracy of diagnosis. Contour of breast tumor can be sketched in manual, semi-automatic, or fully automatic manner [5 - 8]. The manual segmentation method is not suitable for 3D ultrasound im ages. A 3D sonogram in one scan can take over hundreds of 2D image slices, which required plent y of time to sketch tum or c ontour manually . Thus automatic contouring which provided the similar contour with manual sketch of the breast tumor might assist physicians in making correct diag nose s [9 ]. However , ult rasound images comprise a lot of spots, noise, shadow and ti ssue tex ture; in addition, compared with the benign tumors, the edge of malignant tumors seemed more irregular , crushing and splitting, leading to the automatic segmentation method becomes a complicated work [ 10]. Most of segmentation methods on 3D ultrasound images utilized semi-a utomatic wa y to make up for technical shortcomi ngs. The operations of complexity and effic ien cy , the stable results of the execution are also worth consideration factors [1 1]. In computer vision, image se gmentation is the process of partiti oning a digit al image into multiple sections. The purpose of image segmentation is to simplify or change the representation of the image, making the im age easier to understand and analyze. There were many notable approaches for ultrasound imag e segmentation, such as clustering-ba sed image segmentation and region-based segmentation methods. Clustering-based imag e segmentation methods can be viewed as methods of minimizing the intensit y distance between each pixel and cluster center . K-means clustering [ 12, 13] , which is a clustering-based segmentation method, segmented image into K clusters through repea ted iteration until no chan ge s and then the method can create the ef fect of clust ering se gmentation. However , the K-means clustering data is also sensitive to noise and isolated points. This me thod must set the number of clusters, and excessive dependence on the initial value. Region-based segmentation according to the similarity of pixels, gathered the pixels into one area by exploiting the gra yscale bri ghtness, color and material. Equivalent to the whole i mage is divided into a block. W atershed transformations [14, 15], which is a popular region-based segmentation method, exercises the concept of topography and t reats digital im ag e as a topo graphic plane. The pix el with highest v alue is the highest point on the terrain, the lar ger the change of the values indic ates a stee per terrain. However , watershed transformation is ver y sensitive to noise, which would cause over- segmentation to obtain inaccurate contours [16 ]. Active contour model (ACM) algorithm [ 17], also known as snake algorithm, mainly used in two -dimensional image analysis and machine vision image boundary detection, the purpose is to find the object boundary . Although active contour can be more accurately s earch the boundar y of the object, the drawback is the need to provide the ini tial boundary and works on single targ et onl y . Moreover , the ACM-deformation procedure is ve r y time -consuming. The aim of thi s study w as to develop a n efficient segmentation scheme for 3D breast ult rasound imaging . This stud y describes a contour initi alizing procedure b y using 3D re gion growing techniques, as part of the proposed contouring method, to generate formal initial contours for breast tumors. Level set method (L SM), a n ef ficiently developed deformable model that surpa ssed ACM in segmentation performance, is utilized to conserve the time required to sk etch a precise contour. The proposed method performed 3D version of the LSM to ex tract contours of a breast tumor from 3D ultrasound imaging with very high stability . This stud y then compared the automatic breast contouring results with those sketched by an expert radiologist. Materials and Meth ods Data Acquisition This study collec ted ten benign and ten malig nant breast tumor patients aged from 20 to 78 years old (mea n age 42 years). The e ntire database was approved by the institutional review board and ethics committee at Changhua Christian Hospital, Taiwan. Informed consent was obtained from all patients. If the patient h ad multi ple breast lesions, the biggest lesion was included in the study. Approximatel y 120 to 280 ultrasound im ag es of each ca se and the average ima ge size is 366×216 pixels. Sonographic examinations were don e b y using 3 D power Doppler ult rasound with the high definition flow ( HDF ) function (V oluson 730, GE Medical Systems, Zipf, Austria). A linear-array broadband probe with a frequency of 6–12 MHz, a scan width of 37.5 mm, and a sweep angle of 5◦ to 29◦ to obtain 3D volume scanning was used. Physician kept a fixed sweep angle of 20◦ and pow er Doppler settings of mid frequency , 0.9 kHz pulse repetition frequency , -0.6 gain, and ‘low 1’ wall motion filter in all cases. All obtained images were stored on the hard disk and transferred to a pe rsonal computer using a D ICOM (Digital Imaging and Communications in Medicine) connection for image analysis. The Pr oposed Segmentation Method The qualit y of initial contour not only influences to the final segmentation result, but a lso relates to computation time of segmentation. The proposed method utilized the 6-neighbors 3D region growing method to generate initial contour . M orphological closing operator [18] was used to refine the extra cted contour which generated by 3D region growing procedure. The closing operator could eliminate small holes, cracks, and elongated pit; and the n fill ed the gap on the con tour to smooth the boundary . Finally , this study performed LSM a lgorithm by using the e xtracted initial contour to obtain the desired segmentation results. Figure 1 shows the flowchart of the proposed method . Initial Contouring Region g rowing technique [19, 20] is a simple and ef fective method for e xtracting initial contours. The procedure starts with a set of seed points and then group ed neighboring vox els or sub-regions which provided similar properties. T o determine that the seed su rrounding pixels whether to have sim ilar characteristics with th e seed, li ke gray-scale values, joints a nd colors. If the su rrounding voxels had similar characteristics with the se ed, the surrounding vox el w as accepted into the same region. 3D r egion growing method [21] was used to separate the breast tumor region from background . T o extract initial contour of the tumor desi gnate in 3D ult rasound imaging, a physician experienced in breast ultrasound examination defined and manually selected seed points which approached tumor c enter . The 3D regional gro wing procedure in this study performe d six 6-neighboring model (6 -connectivity) [22] along the selected seed point, i.e. front, rear , left, right, upper and lower direction s, to find a similar part with similar characteristics (see Fi g. 2). The intensit y property was used to include a vox el in either region if the absolute difference in intensity between a vox el and the seed point is less than a predefined property threshold T . Adjacent voxels that satisfied the intensity propert y for the sub-region was assigned int o tumor region A. If difference between any of the adja cent voxels and the seed point was less than the threshold T , the proposed method put the adjacent voxel incorporated into the same region with the seed point and re-calculated mean intensity of A . Then the ne w incorporated voxel wa s used as a new starting point t o look for its six adjacent voxels. The entire procedure was repeated until no further changes o ccurred . Due to 6-nei ghboring model is faster than the traditional 26-neighboring model, the proposed procedure required a small amount of computation time to generate a reasonable ini tial c ontour of bre ast tumor in 3D ultrasound imaging. 3D R efining Segmentation The proposed method p erformed 3D LSM algorithm to obtain refined cont our of breast tumor . The LSM is a numerical technique for computing and analy zin g the curve propagation [23]. The basic idea of LSM is that the plane closed curve ex pressed as a 3D continuous function surfaces which having the same function va lue curve φ ( x , y ) is usually φ = 0 , known as t he zero level-set, and the φ ( x , y ) is also called level-set function. The LSM is a wa y to denote active contours [24] . The zero level-set contour of th e function is defined by C x, y φ x, y = 0 . (3) Moreover , inside region and outside region of the curve is defined as φ x, y >0 outside region φ x, y =0 contour φ x, y <0 inside region (4) In the LSM, φ = 0 represents the desired contour , φ < 0 is the internal region of the contour , and φ > 0 is the external region of the contour . Figure 3 shows that the value of level-set function was used to outline the desired contour . T ake a closed curve as a boundary , the entire plane is divided into two area s: the external and internal regions of the curve . In the plane defined distance function φ ( x , y , t ) = ±d , where d is the poi nt ( x , y ) to the shortest distance of the curve, function symbols depending on the point in the curve of the internal or external, generally defined curve interior points the distance is negative, t represents time. At any moment, the point on the curve is the zero point of dist ance function value, i.e. a function of distance to the zero level set. Level-set method not only can handle a sharp endpoint and concave angle, but also can be automated to change the topology . There are two main advantages to represent the a ctive contour b y l evel set met hod. First, it can easily represent complicated contour changes, for example when the c ontour splits into two or develops holes inside. Second, we can e asily know whether a point is inside or outside the contour by checking the φ value. Th is stud y uti lized Chen-V ese m ethod [25] which the level -set function φ is updated as , (5) where u 0 is the original image, c1 and c2 are the average gray level intensit y in φ >0 region and φ <0 region, respectively . More over , μ and v is length penalty and a rea penalty , respectively . The fit parameters λ 1 a nd λ 2 is used to adjust the weights of terms . Dirac delta function δ is performed to make th e contour smooth and eliminate some small isolated reg ions. The se cond and the third terms a re the driving force term whic h drives contour to move towards the equilibrium point. In the propos ed c ontouring method, the original ultrasound im age is fi rst processed b y the 3D region growing. After the initial contouring, the 3D level set method is performed to segment the tumor . Contour Evaluation An experience d physician who was familiar with breast ultrasound inte rpretations manually determined 3D c ontours of the tumor by using two modes. The entire manual sketching (EMS) mode denoted physician manually sketched 2D contour on eac h slice of a tumor . The obtaine d contours from the EMS mode was perf ormed as ground truth. The partial manual sk etching mode denoted the virtual organ computer-aided analysis (VOCAL) [26-28] scheme within 4D V i ew software (G E Medical Systems, Zipf, Austria) was per formed to obtain an approximated 3D contour . The VOCAL scheme estimates 3D contours by a selectable de gree of rotation. This stud y ado pted a ver y common rotation degree 30 o , the six preliminary tumor contours in 0 ◦ , 30 ◦ , 60 ◦ , 90 ◦ , 120 ◦ and 150 ◦ slice images were manually sketc hed . Figure 4 represents the tumor contour manually sketched with 30 ◦ rotation. The VOCAL mode utilized the six extracted tumor regions to build a 3D interested reg ion volume. The obtained contours from two mode s were saved in files for comparison with the automatica ll y generated contours. Four practica l similarity me asures [29], the similarity index (SI), overlap value (OV), overla p fraction (OF) and extra fraction (EF) between the manually determined contours and the automaticall y detected contours were calculated for quan titative analysis of the co ntouring results. REF represents the results depicted b y th e EMS mode , and SEG in dicates the results from the VOCA L mode or the proposed segmentation method. Overlap area denot es the area covered by SEG and REF , extra area denotes the false positive area and missing area denotes false negatives area. Figure 5 il lustrates the relationship between the S EG and REF . When S I, OV and OF are close to 1, and EF c omputation is close to 0, it means that the contours generated by automatic segmentation is similar to the manual contours b y physician. The overlap denotes the area of the intersection of the reference and the automated segmentation. The S I expresses the sim ilar de gree between SEG and REF areas. The OV is identical to the Jaccard index, a lso known as Inter section over Union (IoU). The SI, OF , OV and EF are defined as SI = 2 REF∩ SEG REF+SEG , (5) OF = REF∩SEG REF , (6) OV = REF∩SEG REF ∪ SEG and (7) EF = REF ∩S EG REF . (8) Results This study utilized the simil arity measure s to evaluate the tum or contours generated b y the proposed segmentation method and the VOCAL method with 30 o rotations. The simulations tot ally evaluated 20 cases with manual sketched contours form EMS mode (including 10 benign breast tumors and 10 malignant ones) to test the accuracy of the proposed contouring method. In thi s stud y , the region growing threshold T was ex perimentally set to 5.0, and the size of structur e element for closing op erator was 20 × 20. 3D G aussian blur filtering with sigma value 1.5 was performed to diminish noises in imag ing before level-s et segmentation. And then we emplo y ed the level set method to achieve a precise segmentation for the tumor . W ith the curvature parameters length penal ty µ = 0.2, area penalty ν = 0, fit weights λ 1 = λ 2 = 1 , the proposed level scheme obtained a stable and the highest accuracy . T able 1 shows contouring performance of the proposed method and V OCAL method. The average of the mea sures (SI , OV , OF , EF) that determined by the proposed method and the VOCAL method were (0.85, 0.9 2, 0.75, 0.13) and (0.81, 0.84, 0.69, 0.34), respectively . The simulations were made on a sin gle CPU Intel® Xeon® Processor E3-1225 v5, 3.30 GHz personal computer with Microsoft W indows 10 professional ope rating system and th e pro gram development enviro nment was MA TLAB (R2016.a) software (The MathW orks, Inc., Natick, MA). A verage execution time for e ach case was 25.3 seconds. As thi s scheme is an of fline diagnostic application, these segmentation times are c linicall y acceptable. Figure 6(a) is the contour of a benign tumor which drawn manuall y b y a d octor . Figure 6(b) is the result obtained by the proposed method. Figure 6(c) is contour result obtained by usin g VOCA L method. Besides, Fig. 7(a ) is the contour of a malignant tumor which drawn manuall y b y a docto r . Figures 7(b) and 7 (c) are the obtained result by the proposed method and VOCAL method, respectively . Figure 8 shows the detail results of the assessment of the proposed method and the VOCAL method. The proposed method clearly yield ed contours that a re more similar to those manuall y sketched than that of obt ained by VOCA L method. From the seg mentation results, onl y a small number of cases might generate an undesired segmentation. Conclusion Today, in many dia gnostic modalities of breast cancer, advanta ges of ult rasound are ima ges-cost, easy to operate, non-radioactive, immediate an giography and non- invasive. Physicians generally utilized ultrasound i mages in tum or diagnosis and tes ting, moreover clinicians take it to test tumor biopsies to determine tumor benign and malignant. If a computer-aided s ystem was useful to correct depi ction of tumor contour, it would be help on improving physician di agnosis of benign and malignant tumors of the correct rate. This study proposed a fast and high accurac y automatic 3D breast tumor image segmentation method. The proposed method performed the region growing produce to obtain the initi al outline and get the final contouring results b y usin g level- set method. This work kept away from the problem of level -set algorithm which needs a large amount of computation in 3D space, as well as resolved its problem of ex cessive dependence of initial contour in image segmentation. According to the experimental 10 benign c ases and 10 malignant cases showed that the methods used in t his study can effectively cutting ultrasound imaging of tumor contours, its average value of SI can reach more than 85%; compared to the VOCAL method of the EF a verage 34%, the propos ed m ethod can significantly reduce the value of the EF to 12%. For tumor contour cutting error has significantl y impro ved. In our study, each case computi ng time required is approx imately 25 seconds. C ompared to other method of cutting, usuall y n eed several minutes. Our propo sed method has significant adva ntages, and for medic al dia gnostic a pplications have more practical assistance. The proposed method was fully automated 3D br east tumor contour cutting. User only need ed to select a region growing s eed point, you will ge t breast cancer 3D contour cutting. Compared VOC AL method requires manual depicting six ultrasound images of the diffe rence of tum or c ontours, and physicians ne ed to manually describe each one tumor contour method of rapid a nd convenient, which would help doctors in the diagnosis of convenience. Due to the reduced time required for the progra m operation, the proposed method does not carry out pre-processing for the image, which cause s the accuracy rate resulting of breast tumors contour will be decre ased. Therefore, the future will face in combination with other effective filte r to reduce noise, without increasin g too much computation time of the situation and effectively enhance tumor contour cutting accuracy. Ack now ledgement The authors would like to thank the Ministry of Science and T echnolo gy , T aiwan for financially supporting this research under Contract No. MOST 106- 2221-E-029-029. Refer ences 1. ACS, B reast Cancer Facts and Fig ures 2017-2018', (Atlanta: American Cancer Society , 2017) 2. Shan, J., Alam, S.K., Garra, B., Zhang, Y ., and Ahmed, T ., 'Computer-Aided Diagnosis for Breast Ultrasound Using Computeriz ed Bi -Rads Features and Machine Learning Methods', Ultrasound Med Biol , 2016, 42, (4), pp. 980-988. 3. Choi, J.H., Kang , B.J., B aek, J.E., Lee, H.S., and Kim, S.H., 'Application of Computer- Aided Diagnosis in Breast Ultrasound I nterpretation: Improvements in Diagnostic Performance According to Reader Experience', Ultrasonography , 2018, 37, (3), pp. 217-225. 4. Hsiao, Y .H., Huang, Y .L., Kuo, S.J ., Liang, W .M., Chen, S.T ., and Chen, D.R., 'Characterization of Benign and Malignant Solid B reast Masses in Harmonic 3d Power Doppler Imaging', Eur J Radiol , 2009, 71, (1), pp. 89-95. 5. Horsch, K., Giger , M.L., V enta, L.A., and V yborny , C. J., ' Automatic Segmentation of Breast Lesions on Ultrasound', Med Phys , 2001, 28, (8), pp. 1652-1659. 6. Chang, R.F ., W u, W .J ., T seng, C.C., Chen, D.R., and Moon, W .K., '3 -D Snake for Us in Marg in Evaluation for Malignant Breast T umor Excision Using Mammotome', IEEE T rans Inf T echnol Biomed , 2003, 7, (3), pp. 197-201. 7. Madabhushi, A. and Metaxas, D.N., ' Combining Low-, High-Level a nd Empirical Domain Knowledge for Automated Segmentation of Ultrasonic Breast Lesions', IEEE T rans Med Imaging , 2003, 22, (2), pp. 155-169. 8. Chen, T . and Metax as, D., 'A H ybrid Framework for 3d Medical Image Segmentation', Med Image Anal , 2005, 9, (6), pp. 547-565. 9. Xian, M., Zhang, Y ., C heng, H.D., Xu, F ., Z hang, B., and Ding, J., 'Automatic Breast Ultrasound Image Segmentation: A Surve y', Pattern Recognition , 2018, 79, pp. 340-355. 10. Huang, Y .L., Chen, D.R., and Chang, S.C., ' Three-Dimensional Re gion-Based Segmentation for Breast T umors on Sonography', J Ultrasound M ed , 2013, 32, (5) , pp. 835-846. 1 1. Xu, Y ., W ang, Y ., Y uan, J., Cheng, Q., W ang, X., and Carson, P .L., 'Medical B reast Ultrasound Image Segmentation by Machine L earning', Ultrasonics , 2018, 91, pp. 1-9. 12. Pang, Y ., Li, L., Hu, W ., Peng, Y ., L iu, L., and Shao, Y ., 'Computerized Segmentation and Cha racterization of Breast Lesions in Dynamic Contras t -Enhanced Mr Imag es Using Fuzzy C -Means Clustering and Snake Algorithm', Comput Math Methods Med , 2012, 2012, p. 634907. 13. Boukerroui, D., Basset, O., Guerin, N., and Baskurt, A., 'Multiresolution T exture Based Adaptive Cluste ring Algorithm for Br east Lesion Se gmentation', Eur J Ultrasound , 1998, 8, (2), pp. 135-144. 14. Rodriguez, R., Alarcon, T .E., and Pacheco, O., 'A New Strategy to Obtain Robust Markers for Blood V ess els Segmentation b y Usin g the W atersheds Metho d', Comput Biol Med , 2005, 35, (8), pp. 665-686. 15. Navlakha, S., Ahammad, P ., a nd M y ers, E.W ., 'Unsupervised Segmentation of Noisy Electron Microsc opy Images Using S alient W atersheds and R egion Merging', BMC Bioinformatics , 2013, 14, p. 294. 16. Huang, Y .L. and Chen, D.R., 'W atershed Segmentation for Breast T umor in 2 - D Sonography', Ultrasound Med Biol , 2004, 30, (5), pp. 625-632. 17. Maksimovic, R., Stankovic, S., and Milovanovic, D., 'Computed T omograph y Image Analyzer: 3d R econstruction and Segmentation Appl y ing Acti ve Contour Models -- 'Snakes'', Int J Med Inform , 2000, 58-59, pp. 29-37. 18. Aktouf, Z., Bertrand, G., and Perroton, L., 'A Th ree-Dimensional Holes Closing Algorithm', Pattern Recognition Letters , 2002, 23, (5), pp. 523-531. 19. Sajadi, A.S. and Sabzpoushan, S.H., 'A New Seeded Region Growing T echnique for Retinal Blood V essels Ex traction' , J Med Signals Sens , 2014, 4, (3), pp. 223 -230. 20. Park, S., Lee, J., Lee, H., Shin, J., Seo, J ., Lee, K.H., Shin, Y .G., and Ki m, B., 'Parallelized Seeded Reg ion Growing Using Cuda', Comput Math Methods Med , 2014, 2014, p. 856453. 21. Muhlenbruch, G., Das, M ., Hohl, C ., W ildberg er , J.E., Rinck, D., Flohr , T .G., Koos, R., Knackstedt, C., Gunther , R.W ., and Mahnken, A.H., 'Global Left V entricular Function in Cardiac Ct. Evaluation of an Automate d 3d Region-Growing Segmentation Algorithm', Eur Radiol , 2006, 16, (5), pp. 1 1 17-1123. 22. Cohen-Or , D. and Kaufman, A., '3d Line V oxelization and Connectivit y Control', IEEE Computer Graphics and Applic ations , 1997, 17, (6), pp. 80-87. 23. Osher , S. and Sethian, J .A., 'Fronts Propaga ting with Curvature-De pendent Spe ed: Algorithms Based on Hamilton-J acobi Formulations', Journal of Computational Physics , 1988, 79, (1), pp. 12-49. 24. Huang, Y .L ., J iang, Y .R., Chen, D.R., and Moon, W .K., 'Leve l Set Contouring for Breast T umor in Sonography', J Digit Imaging , 2007, 20, (3), pp. 238-247. 25. Chan, T .F . and V ese, L .A., 'Active Contours without Edges', IEEE T ransactions on Image Pr o cessing , 2001, 10, (2), pp. 266-277. 26. Raine-Fenning, N.J., Clewes, J.S ., Ke ndall, N.R., Bunkheila, A.K., Campbell, B.K., and Johnson, I.R., 'The Interobserver Reliabilit y and V alidity of V olume Calculation from Three-Dimensional Ultrasound Datasets in the in V itro Setting', Ultrasound Obstet Gynecol , 2003, 21, (3), pp. 283-291. 27. Raine-Fenning, N., Cam pbell, B., Collier , J ., Brincat, M., and J ohnson, I., 'The Reproducibility of Endometrial V olume Acquisition and Measurement with the V ocal - Imaging Program', Ultrasound Obstet Gynecol , 2002, 19, (1), pp. 69-75. 28. Bordes, A., Bory , A. M., Benchaib, M., Rudigoz, R.C., and Salle, B ., 'Reproducibility of T ransv aginal Three-Dimensional Endometrial V olume Measurements with V irtual Organ Computer-Aided Anal y sis (V ocal) Duri ng Ovarian Stimulation', Ultrasound Obstet Gynecol , 2002, 19, (1), pp. 76-80. 29. Anbeek, P ., V inck en, K.L., van Osch, M.J ., Bisschops, R.H., and van der Grond, J., 'Probabilistic Segmentation of W hite Matter Lesions in Mr Imaging', N eur oimage , 2004, 21, (3), pp. 1037-1044. List of T ables Table 1. The contouring e valuations of the proposed met hod and VOCA L metho d using the similarity measurements (average). List of Figures Figure 1. Flowchart of the proposed method Figure 2. Neighbors (the blue voxels) within the 6-connectivit y Figure 3. Illustrations of the level-set method Figure 4. The tumor contour which manually sketched with 30◦ by export Figure 5. Schematic diagram evaluation of contour Figure 6. Results of contour segmentation with a benign case: (a) is the benign tumor contour that drawn manuall y by a doctor; (b) is the result of obtained benign tumor contour segmentation b y our p roposed LSM method; (c) is a benign tumor contour results obtained by using the VOCAL method Figure 7. Results of contour segmentation with a malignan t case: (a) is the malignant tumor contour that drawn manually b y a doctor; (b) is the result of obtained malignant tumor contour segmentation by our proposed LSM method ; (c) is a malignant tumor contour results obtained by using the VOCAL method Figure 8. Similarity eva luation results of the assessment of the propose d LSM method and VOCAL method: (a) S imil arity index (SI), (b) O verlap value (OV), (c) O verlap fraction (OF) and (d) E xtra fraction (EF) T able 1. The contouring evaluations of the proposed method and VOCAL method using the similarity measurements (average) . Pathology proven result Benign case (10 cases) Malignant case (10 cases) Whole database (20 cases) SI The proposed method 84.67% 85.66% 85.17% VOCAL mode 80.81% 81.91% 81.36% OF The proposed method 87.66% 96.08% 91.87% VOCAL mode 82.40% 85.79% 84.09% OV The proposed method 73.75% 75.34% 74.54% VOCAL mode 68.36% 69.47% 68.91% EF The proposed method 1 1.65% 13.88% 12.76% VOCAL mode 28.41% 38.88% 33.64% SI: similarity index; OF: overl ap fraction; OV : overlap val ue; EF: extra fraction Figure 1. Flowchart of the proposed method Segment ation Results 3D leve l - set meth od Initial con tour 3D region gr owing Select the seed points 3D ultr asonic imaging Middle-1 slice Middle+1 slice Middle slice #1 slice #n slice . . . . Figure 2. Neighbors (the blue voxels) within the 6-connectivity Figure 3. Illustrations of the level-set method Figure 4. The tumor contour which manuall y sketched with 30◦ b y e xport miss overlap extra REF SEG Figure 5. Schematic diagram evaluation of conto ur (a) (b) Figure 6 Results of contour segmentation with a benign case: (a) is the benign tumor contour that drawn manuall y by a doctor; (b) is the result of obtain ed benign tumor contour segmentation by our proposed L SM met hod; (c) is a benign tum or contour results obtained by using the VOCAL method ( continued) (c) Figure 6. Results of contour se gmenta tion with a benign case: (a) is the benign tumor contour that drawn manuall y by a doctor; (b) is the result of obtain ed benign tumor contour segmentation by our proposed L SM met hod; (c) is a benign tum or contour results obtained by using the VOCAL method (a) (b) Figure 7. Results of contour segmentation with a malignant case: (a) is the malignant tumor contour that drawn manually by a doctor; (b) is the result of obtained malignant tumor contour segmentation b y our proposed LSM method ; (c) is a malignant tum or contour results obtained by using the VOCAL method ( continued) (c) Figure 7. Results of contour segmentation with a malignant case: (a) is the malignant tumor contour that drawn manually by a doctor; (b) is the result of obtained malignant tumor contour segmentation b y our proposed LSM method ; (c) is a malignant tum or contour results obtained by using the VOCAL me thod (a) (b) Figure 8. Similarity evaluation results of the assessment of the proposed LS M method and VOCAL method: (a) S imilarity index (S I ), ( b) Overlap value (OV), (c) Overlap fraction (OF) and (d) Extra fraction (EF) ( continued) 0% 10% 20% 30% 40% 50% 60% 70% 80% 90% 100% SI: Sim ilarity Index LSM VOCAL 0% 10% 20% 30% 40% 50% 60% 70% 80% 90% 100% OF: Overlap Fraction LSM VOCAL (c) (d) Figure 8. Similarity evaluation results of the assessment of the proposed LS M method and VOCAL method: (a) S imilarity index (S I ), (b) Overlap value (OV), (c) Overlap fraction (OF) and (d) Extra fraction (EF) 0% 10% 20% 30% 40% 50% 60% 70% 80% 90% 100% OV : Overlap V alue LSM VOCAL 0% 10% 20% 30% 40% 50% 60% 70% 80% 90% 100% EF: Extra Fraction LSM VOCAL
Original Paper
Loading high-quality paper...
Comments & Academic Discussion
Loading comments...
Leave a Comment