Three-dimensional weights of evidence modeling of a deep-seated porphyry Cu deposit
Given the challenges in data acquisition and modeling at the stage of detailed exploration, it is difficult to develop a prospectivity model, particularly for disseminated ore deposits. Recently, the weights of evidence (WofE) method has demonstrated…
Authors: Ehsan Farahbakhsh, Ardeshir Hezarkhani, Taymour Eslamkish
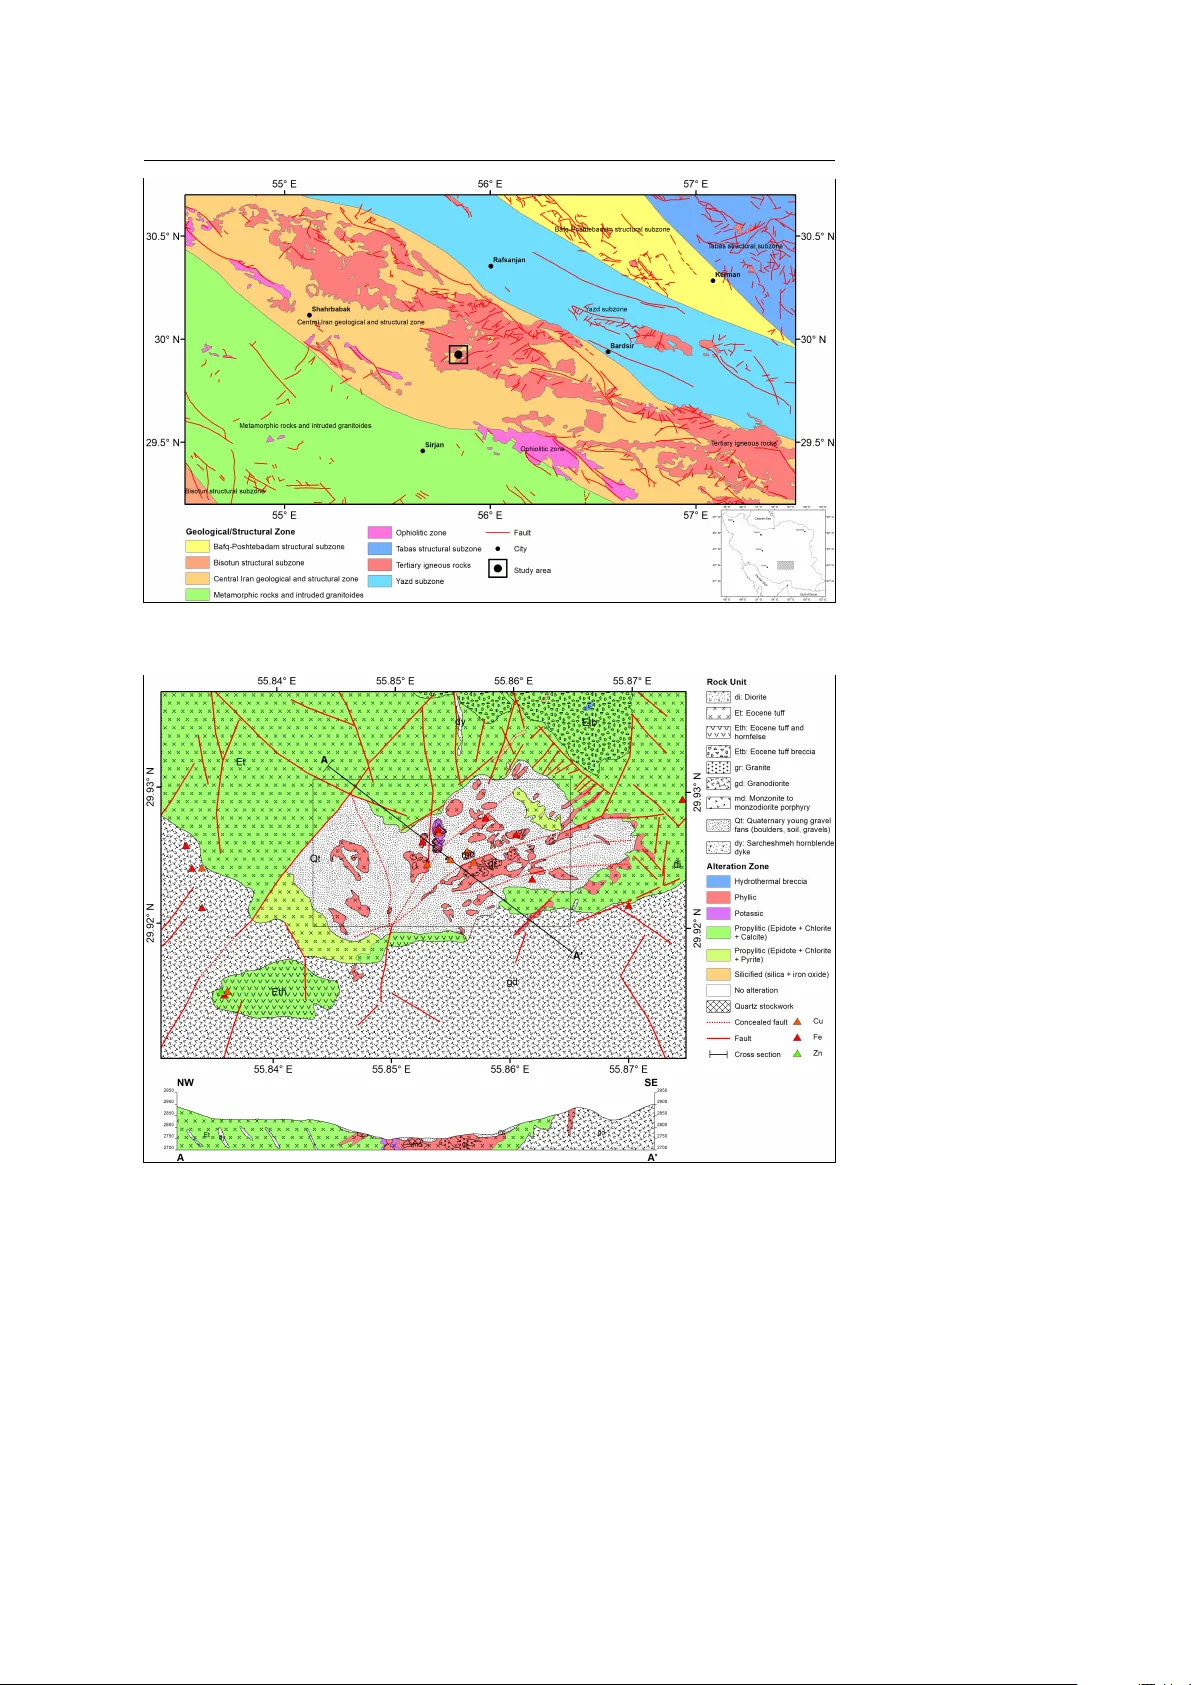
Journal man uscript No. (will b e inserted b y the editor) Three-dimensional w eigh ts of evidence modeling of a deep-seated porphyry Cu dep osit Ehsan F arah bakhsh · Ardeshir Hezarkhani · T a ymour Eslamkish · Abbas Bahroudi · Rohitash Chandra Received: date / Accepted: date Abstract Given the c hallenges in data acquisition and mo deling at the stage of detailed exploration, it is difficult to develop a prosp ectivit y mo del, partic- ularly for disseminated ore dep osits. Recently , the weigh ts of evidence (W ofE) metho d has demonstrated a high efficiency for mo deling such dep osits. In this study , we prop ose a framework for creating a three-dimensional (3D) weigh ts of evidence-based prosp ectivity mo del of the No choun p orphyry Cu dep osit in the Urmia-Dokh tar magmatic arc of Iran. The input data include qualitativ e geolog- ical and quantitativ e geochemical information obtained from b oreholes and field observ ations. W e com bine ordinary and fuzzy weigh ts of evidence for integrating qualitativ e and quantitativ e exploration criteria in a 3D space constrained by a metallogenic model of the study area for iden tifying a deep-seated ore b o dy . Or- dinary w eights of evidence are determined for geological data, including lithology , alteration, rock type, and structure. Moreov er, w e determine the fuzzy w eigh t of evidence for each class of contin uous geo c hemical mo dels created based on F e, Mo, and Zn concen tration v alues deriv ed from b oreholes. W e integrate the input E. F arahbakhsh Department of Mining Engineering, Amirk abir Universit y of T echnology (T ehran Polytec hnic), T ehran, Iran E-mail: e.farahbakhsh@aut.ac.ir A. Hezarkhani Department of Mining Engineering, Amirk abir Universit y of T echnology (T ehran Polytec hnic), T ehran, Iran T. Eslamkish Department of Mining Engineering, Amirk abir Universit y of T echnology (T ehran Polytec hnic), T ehran, Iran A. Bahroudi School of Mining Engineering, College of Engineering, Universit y of T ehran, T ehran, Iran R. Chandra School of Mathematics and Statistics, Univ ersity of New South W ales, Sydney , Australia 2 Ehsan F arahbakhsh et al. eviden tial mo dels using W ofE and create tw o prosp ectivity mo dels (i.e., p osterior and studen tized p osterior probability). W e also determine anomalous v oxels in the probabilit y models using concen tration-volume fractal mo dels and v alidate them using prediction-volume plots. The mo deling results indicate that the studentized p osterior probability model is more efficient in iden tifying vo xels representing cop- p er mineralized ro c k v olumes. W e provide op en source softw are for the proposed framew ork whic h can be used for exploring deep-seated ore bo dies in other regions. Keyw ords Three-dimensional prosp ectivit y mo deling · W eights of evidence · Uncertain ty · Porph yry Cu · No choun Highligh ts – Three-dimensional weigh ts of evidence metho d is an efficient tool for mo deling deep-seated ore b o dies; – Probability mo dels are able to show the disp ersion of target mineralization in depth; – Studentized posterior probability mo del pro vides more reliable results com- pared to p osterior probabilit y mo del. 1 Introduction The increasing shortage of easily detectable, outcropping ore dep osits has led more and more mineral explorers to prosp ect for concealed or deep-seated ore dep osits, in particular for metals such as copp er, whic h plays a crucial role in mo dern so ci- et y (Mudd et al., 2013; Mudd and Jo witt, 2018; Sc ho dde, 2013). With increasing depth, traditional exploration metho ds are progressively b ecoming less efficient and/or more costly . Mineral prosp ectivity mapping has b een dev elop ed and ap- plied for v arious t yp es of ore dep osits and at a v ariety of scales ranging from con tinental to regional (Bro wn et al., 2000; Carranza et al., 2005; Carranza and Sadeghi, 2010; Chen and W u, 2017; Ro driguez-Galiano et al., 2015; Xiong and Zuo, 2018; Zuo et al., 2011). Whilst most prosp ectivity mapping metho ds can b e categorized as either k no wledge- or data-driven approac hes (Cheng and Agterberg, 1999; Manap et al., 2013; Porw al et al., 2003), hybrid metho ds consider b oth data and exp ert kno wledge (Sun et al., 2019). The latter are t ypically used for iden ti- fying areas of high potential for the discov ery of ore deposits in t wo-dimensional en vironments (Carranza et al., 2008; Carranza and Lab orte, 2015; Knox-Robinson, 2000; P orwal et al., 2010). Deep-seated ore deposits usually show weak exploration signals on the ground sur- face. Therefore, there is a need to develop tw o-dimensional (2D) mineral prosp ec- tivit y mapping metho ds in a three-dimensional (3D) space to benefit them for in-depth exploration of mineral resources. 3D mo deling, analysis and visualization facilitate the perception of k ey spatial factors in mineralization, ore genesis, and geologic evolution in addition to target appraisal (Carranza, 2009; Li et al., 2018; Mao et al., 2019; Pa yne et al., 2015; Zuo et al., 2016). The ability of 3D mo deling in providing a reliable spatial mo del is completely dep endent on the quality of input datasets, mo deling tec hniques, exp ert knowledge, and the complexit y of the lo cal geological setting (F allara et al., 2006; Houlding, 1994; Jessell et al., 2014; Three-dimensional weigh ts of evidence modeling 3 Lindsa y et al., 2012; Liu et al., 2016). A comprehensive metallogenic model suc h as those suggested for p orphyry Cu deposits (Berger et al., 2008; Lo well and Guilbert, 1970; Meng, 1997; Sillito e, 2010), helps geometric mo deling and spatial analysis through enhancing the reliabilit y of 3D mo dels. Sev eral three-dimensional mineral prosp ectivit y mapping metho ds ha ve b een de- v elop ed in recent years (Li et al., 2015; Mao et al., 2019; Nielsen et al., 2019, 2015; Xiao et al., 2015; Y uan et al., 2014), which can b e applied along with other mo deling methods, suc h as geostatistics for modeling drilling data and detecting deep-seated ore dep osits at b oth regional and lo cal scales. Regional-scale 3D min- eral prosp ectivity mo deling and quan titative assessmen t is rarely feasible, b ecause required public-domain datasets with consisten t co v erage o v er large areas are not a v ailable (Xiao et al., 2015). One of the adv antages of 3D mineral prosp ectivity mo deling o ver traditional geostatistics is its ability of in tegrating different t yp es of qualitativ e and quantitativ e exploration data rather than b eing restricted to mo d- eling the concentrations of individual geo chemical elements. Some information, suc h as geological characteristics obtained from b oreholes consume large amounts of time and money , which are surprisingly less considered at the stage of detailed exploration due to the lack of a sp ecific framework for combining qualitative data with more fa v orable quan titative data. The 3D mineral prosp ectivity mo deling metho ds are able to in tegrate such data and pro vide an efficient model for opti- mizing the pro cess of selecting new drilling locations and planning the exploitation of an ore reserv e. In recen t y ears, Ba y esian mo deling approac hes ha ve b een applied to mo deling geo- logical features (Oliero ok et al., 2019; Scalzo et al., 2019). The Ba yesian inference approac h is able to pro vide a fully quantitativ e and informative 3D prospectivity mo del and to fuse all av ailable constraints in a probabilistically rigorous fash- ion. The weigh ts of evidence (W ofE) metho d is based on Bay es’ rule (Xiao et al., 2015) and has b een effectively used for 2D mineral prosp ectivity mapping of v ari- ous types of ore dep osits (e.g., Carranza (2004); Kreuzer et al. (2015); Pazand and Hezarkhani (2014); Porw al et al. (2010); Zeghouane et al. (2016)). The fuzzy W ofE metho d developed by Cheng and Agterb erg (1999), preven ts loss of information due to conv erting contin uous mo dels into binary mo dels. This metho d has a num- b er of adv antages compared to other simpler or ev en more complicated data-driven metho ds. In general, the weigh ts of evidence represent the degree of correlation b et ween a target mineralization and a particular mo del or pattern created under sp ecific conditions known as an evidence (Agterberg et al., 1990; Bonham-Carter et al., 1989; Carranza, 2004; Cheng and Agterberg, 1999; Y uan et al., 2014). Using 3D mineral prosp ectivity modeling, geological, geo chemical and geophysical data can b e integrated according to the kno wn disp ersion of mineralization in a mo deling space. The result of this process is a form ulated 3D mo del whic h presen ts a quantitativ e assessment of the probability of detecting a target mineralization based on exploration criteria. The exploration criteria must include all the factors whic h control a sp ecific target mineralization in a study area (Y uan et al., 2014). They help to pro vide the 3D evidential mo dels whic h are later used as inputs to the mo deling pro cess. In this study , we extend and demonstrate the application of W ofE metho d in a 3D space based on a prop osed framework for mo deling a p orphyry copp er (Cu) de- p osit lo cated in southeast Iran within a magmatic arc called Urmia-Dokh tar. W e use borehole data consisting of qualitativ e geological and quan titative geo chemical 4 Ehsan F arahbakhsh et al. data along with surficial geological data for providing input 3D eviden tial mo d- els. Based on the prop osed framew ork, the ordinary and fuzzy W ofE methods are used for weigh ting vo xels in binary geological and contin uous geochemical eviden- tial mo dels, respectively . W e use the total v ariance associated with each v oxel to create a studen tized p osterior probabilit y mo del in addition to a p osterior prob- abilit y mo del. The concentration-v olume fractal mo dels and prediction-v olume plots are used to ev aluate and v alidate our mo dels. W e provide Python scripts as op en-source soft ware for implementing the prop osed framework in this study . 2 Geological setting The No c houn p orphyry copp er dep osit is lo cated within a magmatic arc sub divi- sion called Urmia-Dokh tar where extensiv e T ertiary to Plio-Quaternary in trusive and extrusiv e units are exp osed in a northw est–southeast trend (Fig. 1). In several studies, a sub duction-related magmatic mo del is suggested for the Urmia-Dokhtar magmatic arc, which is kno wn to b e a result of the closure of the Neo-T ethys o cean b etw een Arabian and Eurasian plates (Berb erian and Berb erian, 1981; Om- rani et al., 2008). In general, this magmatic arc in volv es tw o ma jor mineralization regions of Chahar Gonbad to the southeast and Sungun to the northw est. The dominan t type of mineralization is p orphyry Cu which is asso ciated with Eo cene, Plio cene and Quaternary plutonic b o dies and volcanic ro cks. The ma jor lithologi- cal units of the study area lo cated in the Chahar Gonbad region in southeast Iran, consist of v olcanic and subv olcanic complexes, and intrusiv e b o dies. The volcanic ro c ks co ver most of the study area and consist of Eo cene andesite, dacite, and rh yodacite asso ciated with tuff breccias (Abedi et al., 2014). As sho wn in Fig. 2, the intrusiv e b o dies include granite to diorite disp ersed in the south to southw est of the study area. 3 Alteration and mineralization The hydrothermal alteration and mineralization in the No c houn p orphyry copp er dep osit strik e NE–SW and cen ter on a sto ck (Fig. 2). The early h ydrothermal alteration w as dominan tly p otassic and propylitic, follo wed later b y phyllic, silica, and argillic alteration types. The p otassic alteration is represented by mineral assem blages developed p erv asively as halos around v eins in the cen tral parts of the study area. There is a relativ ely sharp b oundary b etw een the propylitic and p otassic alteration zones in deep er parts of the ore dep osit, but this con tact is obscured by later phyllic alteration in shallow levels. The prop ylitic alteration is p erv asive and represented mainly b y c hloritization of primary and secondary biotite and groundmass materials of the ro cks which are p eripheral to the cen tral p otassic zone (Fig. 2). The plagio clase minerals were replaced with epidote, but this alteration is less p erv asive and less in tense compared to the c hloritization. F eldspar minerals are lo cally altered to cla y minerals in shallow levels and the dominan t mineral is k aolinite accompanied by illite. Moreov er, the entire ro c ks ha ve been altered to an assem blage of clay minerals, hematite, and quartz close to the erosion surface which are soft and white. The shallow alteration is interpreted to represen t a sup ergene blank et o ver the ore dep osit and the alteration of feldspar Three-dimensional weigh ts of evidence modeling 5 Fig. 1 A p ortion of the Chahar Gonbad region lo cated in southeast Iran within the Urmia- Dokhtar magmatic arc. The study area is shown at the center of the map in a blac k square. Fig. 2 Detailed geological and alteration map of the study area along with a cross-section intersecting some of the mineral occurrences. The blac k rectangle shows the target area. 6 Ehsan F arahbakhsh et al. Fig. 3 a) Cu oxide minerals including malachite and azurite in fractures of silicified tuff crystals; b) quartz veinlets with a sto ckw ork texture. to clay in depth may hav e the same origin. Also, the latter ma y represen t an argillic stage of the h yp ogene alteration. The hypogene copp er mineralization has disseminated or taken place in veinlets during phyllic alteration and to a lesser extent potassic alteration. During the p otassic alteration, the copper was dep osited as chalcop yrite and minor bornite; later hypogene copp er was dep osited mainly as c halcop yrite. The ro cks are highly altered at the exp osed surface of the ore deposit and the only mineral which has survived alteration is quartz. Most of the sulfide minerals hav e b een leached, and copp er has b een concentrated in an underlying sup ergene zone by down ward p ercolating groundwater. In general, the mineralization in the study area is the result of tw o geological pro cesses including the intrusion of a grano diorite b o dy and the ascending of h ydrothermal fluids. The mineralization-b earing rocks hosted b y the granodiorite b o dy usually app ear in the v eins with a thic kness of 2–3 m, and they are mostly found in the marginal sections of the host b o dy or tuffaceous units. This type of mineralization is considered non-economic due to the low grade. Differen t types of ore minerals such as hematite, oligist, magnetite, and malac hite with intense silicification of the v eins are observed in mineralization zones (Fig. 3). Moreo v er, the p olished sections pro vided using mineralized rocks, sho w the presence of chalcop yrite, p yrite, and sphalerite (Fig. 4). There are a num b er of sto c kworks exp osed on the surface which are the result of hydrothermal fluid in teraction (Fig. 2). These sto ckw orks are probably related to the intrusion of dyk es and quartz monzonite apophyses. In this t yp e of mineralization, malachite and azurite minerals are found on the surface along with minor chalcop yrite as inclusions within quartz (Ab edi et al., 2014). 4 Materials and metho ds 4.1 Drilling data W e use qualitativ e geological and quantitativ e geo chemical data obtained from 113 b oreholes to create 3D geological and geo chemical evidential mo dels. The size of eac h v oxel in the 3D mo dels according to the extent of the modeling space is determined 10 × 10 × 10 meters (m). The geometrical parameters of the mo deling Three-dimensional weigh ts of evidence modeling 7 Fig. 4 P olished sections showing the presence of a) pyrite, and b) iron oxide crystals in mineralized ro cks. T able 1 Geometrical parameters of the 3D mo deling space. Parameter V alue North–South extent 970 m East–W est extent 1,740 m V ertical extent 890 m Polygon area on the surface 0.8841 km 2 space can b e found in T able 1. W e inscrib e the 3D mo dels in a p olygon created b y the conv ex h ull algorithm based on the coordinates of the b orehole collars on the ground surface (Fig. 5). Moreov er, they are restricted to a sup er- and sub-face based on the elev ation of the b orehole collars and the depth of each borehole to mak e sure there are sufficient num b er of data p oin ts for interpolating throughout the mo deling space. The total n um b er of vo xels is approximately 500,000. The geological data used for creating 3D geological eviden tial mo dels in volv e lithology , alteration, and ro ck type information. In addition to Cu concentration v alues used for creating a primary mo del of the target ore b o dy , we use other geo- c hemical data including the concen tration v alues of key elements for creating 3D geo c hemical eviden tial models. The 3D strip-logs of the geological and geochemical data are sho wn in Figs. 6 and 7, resp ectiv ely . 4.2 Structural data The drilling data used in this study do not inv olve structural data such as the p osition of faults in depth. Therefore, we extend surficial structural data to depth for creating 3D fault surfaces. The av ailable surficial data include some information ab out the strik e, dip, and dip direction of the faults whic h hav e b een provided by the fieldworks, and v alidated by remote sensing data (F arahbakhsh et al., 2019b). The faults include those exposed on the surface or cov ered by a thin lay er of regolith kno wn as concealed faults. A 3D mo del of the fault surfaces called 3D ribb ons is created using the av ailable data which is sho wn in Fig. 8. The 3D ribb ons are then 8 Ehsan F arahbakhsh et al. Fig. 5 Borehole collars along with their identification lab els shown on the geological map of the study area enlarged from Fig. 2. The p olygon drawn around the borehole collars shows the boundaries of the mo deling space. restricted to the mo deling space and conv erted into a 3D blo ck mo del to be used as a structural eviden tial mo del. 4.3 3D mo deling 4.3.1 Ge olo gic al mo deling As shown in Fig. 5, there are a high num b er of b oreholes in a small area which mak es it possible to create a precise 3D geological model using the drilling data. In this study , we use a basic interpolation metho d called closest p oint for in terp olating qualitativ e geological data including lithology , alteration, and ro c k type in a 3D space with the Ro ckW orks softw are pack age (Ro ckW orks17, 2019b). The v alue of a v oxel node is set to b e equal to the v alue of the nearest data p oint, regardless of its distance from the point or the v alue of its other neighbors. One of the adv antages of this metho d is that the solid model nodes will honor the con trol p oin ts. This metho d can b e used for mo deling complex non-stratiform geology (e.g., multiple intrusions, impact craters, k arst, etc.) such as our study area. The 3D geological evidential models are constrained to the geological map presented in Fig. 5. Moreov er, the lithological mo del is constrained to the cross-sections shown in Fig. 9 dra wn based on the drilling data and geological kno wledge. 4.3.2 Ge o chemic al mo deling The concen tration v alues of differen t elemen ts ha ve been determined along the b oreholes. How ev er, the num b er of samples are different. W e in vestigate the bi- v ariate correlation b etw een different elements and Cu concentration v alues. Ac- Three-dimensional weigh ts of evidence modeling 9 Fig. 6 3D strip-logs of the geological data including a) lithology , b) alteration, and c) ro ck type. 10 Ehsan F arahbakhsh et al. Fig. 7 3D strip-logs of the geo chemical data including a) Cu, b) F e, c) Mo, and d) Zn con- centration v alues. The size and color of cylinders shown along the b oreholes are prop ortionate to the intensit y of concentration v alues. Highly p ositive skew ed Zn concentration v alues yields a p o or illustration of the relevan t 3D strip-logs. cording to the results, iron, molyb denum, and zinc (F e, Mo, and Zn) sho w a high correlation and they in volv e the highest num b er of samples. These elements are usually applied through prosp ecting for p orphyry Cu dep osits (F arahbakhsh et al., 2019a; Xiao et al., 2014). Moreo ver, these elemen ts are known as the key indications of porphyry Cu mineralization in the study area. W e use the inv erse- distance anisotropic mo deling metho d which is one of the different kinds of the in verse-distance algorithm for in terp olating the geo chemical data in a 3D space. This metho d has b een widely used for interpolating the concentration v alues of differen t geo chemical elements in b oth tw o- and three-dimensional mo dels, partic- ularly in p orph yry copp er dep osits (e.g., W ang and Huang (2012); Zuo (2011)). Using the in verse-distance in general, we assign a v o xel node v alue based on the w eighted av erage of neigh b oring data points, and the v alue of eac h data point is w eighted according to the in verse of its distance from the vo xel node, tak en to a p o wer. The greater the v alue of the exp onent, the less influence distant control p oin ts will hav e on the assignmen t of the vo xel no de v alue (Ro ckW orks17, 2019a; Zeghouane et al., 2016). Using the inv erse-distance anisotropic metho d, we lo ok for the closest con trol p oint in each 90-degree sector around the no de. In this study , the w eighting exponent is set to 2, exp erimentally . The directional search can improv e the interpolation of vo xel v alues that lie b etw een data point clusters, Three-dimensional weigh ts of evidence modeling 11 Fig. 8 3D ribb on model showing the fault surfaces which ha ve b een created using surficial structural data. and can be useful for modeling borehole-based data. The quadran t searc hing tends to connect the limits (highs and lo ws) at the same elev ation. 4.4 W eights of evidence mo deling The weigh ts of evidence metho d is a well-kno wn and robust data-driven prosp ec- tivit y mo deling metho d based on the Ba yesian theorem (Bonham-Carter, 1994). This metho d is used for estimating the p osterior probability of detecting an ore b o dy under the assumption of conditional indep endence of input eviden tial mo dels (Xiao et al., 2015). This assumption is also known as one of the weaknesses of this metho d (Joly et al., 2012). The W ofE metho d can work with a low n um b er of training datasets compared to other data-driven or machine learning techniques. Using this metho d, the prior b elief of detecting a sp ecific type of mineralization in an area or space is up dated in the ligh t of other evidence such as geological, geo c hemical or geophysical models. An example of the prior belief is the primary mo del created by interpolating the concen tration v alues of target elemen t obtained through b oreholes. In this study , w e interpolate the Cu concentration v alues as w ell as other geo chemical elements, and then conv ert into a binary mo del for determining the approximate target ore b o dy . In general, the posterior probabil- 12 Ehsan F arahbakhsh et al. Fig. 9 Lithological cross-sections presented in a 3D view. The 3D lithological evidential model is constrained to these sections, in addition to the geological map. it y of mineralization (P(M)) after lo oking at evidence (E) is determined via the lik eliho o d function using Eq. 1 (Bonham-Carter, 1994). P ( M | E ) = P ( M ) P ( E | M ) P ( E ) (1) This metho d is simple from the computational view, and 2D W ofE metho d is readily implemen ted using GIS pack ages (e.g., ArcGIS Desktop (2019); QGIS Dev elopment T eam (2019)); ho w ev er, implemen ting this metho d in a 3D space is more complicated. In this study , we deal with binary or discrete geological and contin uous geo chemical eviden tial mo dels. Therefore, to minimize the loss of information, we determine ordinary p ositive and negative w eights for eac h unit of the geological mo dels and a fuzzy weigh t for each class of the geo chemical models. In binary models, the weigh ts of evidence enable a user to in terpret positive and negativ e w eights in geological terms intuitiv ely . The p ositive (W + ) and negativ e (W - ) w eights are determined using Eqs. 2 and 3 (Bonham-Carter, 1994). W + = ln P ( E | M ) P ( E | ¯ M ) (2) W − = ln P ( ¯ E | M ) P ( ¯ E | ¯ M ) (3) These weigh ts indicate the spatial asso ciation b etw een the vo xels with and without mineralization, and the presence and absence of anomalous vo xels in ev- iden tial mo dels, resp ectively . F or example, an eviden tial or predictor mo del can Three-dimensional weigh ts of evidence modeling 13 b e used to assess the contribution of a geological process in the formation and prosp ectivit y of a sp ecific type of mineralization (Xiao et al., 2015). Inv estigating the con trast (C) which is determined using Eq. 4, can help through this assessmen t (Bonham-Carter, 1994). C = W + − W − (4) High v alues of con trast show strong association of an eviden tial model with the mineralization pro cess. The contrast is used to calculate the fuzzy weigh t of each class in con tinuous models. In this study , w e classify geo c hemical eviden tial models based on the p ercen tile to minimize the effect of n umber of vo xels on the fuzzy w eight. Eac h mo del has ten classes with an equal num b er of vo xels and a fuzzy mem b ership function is created for eac h set of contrasts for differen t contin uous eviden tial mo dels. The contrast v alues are transformed to the fuzzy space ranging from 0 to 1 using a logistic function (Y ousefi and Nyk¨ anen, 2016) and called fuzzy con trast ( µ E ( C )). The fuzzy weigh t ( W µ E ( C ) ) for each class of contin uous mo dels is determined using Eq. 5 (Cheng and Agterberg, 1999). W µ E ( C ) = ln µ E ( C ) P ( E | M ) + (1 − µ E ( C )) P ( ¯ E | M ) µ E ( C ) P ( E | ¯ M ) + (1 − µ E ( C )) P ( ¯ E | ¯ M ) (5) The p osterior probability mo del is the result of in tegrating input evidential mo dels, whic h is generated using Bay es’ equation in a log-linear form (Eq. 6) with the assumption that conditional independence applies (Bonham-Carter, 1994; Bonham-Carter et al., 1989). P P st = O P st 1 + O P st (6) Where, P Pst denotes the p osterior probability and O Pst is the p osterior o dds. The p osterior odds equal the exponent of the p osterior logit whic h can be deter- mined b y Eq. 7 (Bonham-Carter, 1994; Cheng and Agterb erg, 1999). lnO ( M | E 1 E 2 . . . E k ) = lnO ( M ) + m X i =1 W + / − i + n X j =1 W µ j (7) Where, there are k evidential mo dels including m discrete and n con tinuous mo dels. W e use the aggregate of p ositive or negative w eigh ts in discrete mo dels and the fuzzy weigh ts in con tinuous mo dels, with the prior logit of mineralization in the study area for calculating the posterior logit. Using the W ofE metho d enables the user to calculate the effects of uncertaint y on the w eigh ts, and uncertain t y due to missing information. This leads to pro ducing an uncertaint y quantified mo del whic h is propagated in the decision making. The v ariances of the weigh ts and contrast help to mo del the uncertaint y of the posterior probabilit y due to uncertaint y in the weigh ts and caused by lack of information. The v ariance of p ositive ( σ 2 W + ) and negativ e ( σ 2 W − ) w eights in discrete models are determined as presen ted in Eqs. 8 and 9, resp ectiv ely (Bonham-Carter, 1994). σ 2 W + = 1 N ( E ∩ M ) + 1 N ( E ∩ ¯ M ) (8) σ 2 W − = 1 N ( ¯ E ∩ M ) + 1 N ( ¯ E ∩ ¯ M ) (9) 14 Ehsan F arahbakhsh et al. Where, N is the num b er of vo xels and the v ariance resulting from the mem- b ership function µ E can b e expressed as Eq. 10. It has to b e noted that w e hav e assumed P ( E ) + P ( ¯ E ) = 1. σ 2 µ E [ P ( M )] = 2 µ E (1 − µ E ) P ( µ E ) σ 2 [ P ( M )] (10) Where, P ( µ E ) denotes the probability of the membership function and deter- mined using Eq. 11. Also, σ 2 [ P ( M )] is the v ariance of the prior probability of mineralization as giv en b y Eq. 12. P ( µ E ) = µ E P ( E ) + (1 − µ E ) P ( ¯ E ) (11) σ 2 [ P ( M )] = { P ( M | E ) − P ( M ) } 2 P ( E ) + { P ( M | ¯ E ) − P ( M ) } 2 P ( ¯ E ) (12) A useful measure is to calculate the studen tized v alue of con trast (C St ), as a measure of the uncertaint y with which the con trast is kno wn. W e calculate the studen tized v alue as the ratio of contrast to its standard deviation S(C) as sho wn in Eq. 13. C S t = C S ( C ) (13) The standard deviation of con trast is determined using Eq. 14. S ( C ) = q σ 2 W + + σ 2 W − (14) A large studen tized con trast implies that the contrast is large compared with the standard deviation, then the contrast is more likely to b e real. A studentized v alue larger than 2, or even 1.5 is satisfactory (Bonham-Carter, 1994). Due to the assumptions required for a formal statistical test, particularly the problem with the dependence of the standard deviation of con trast on the units of measuremen t, it is best to use this ratio in a relative, rather than an absolute sense (Bonham- Carter, 1994). W e use the v ariances of the w eights to calculate the v ariance of the p osterior prob- abilit y at each v oxel, and to generate a studen tized posterior probabilit y mo del. The square root of total v ariance ( σ 2 T ) at eac h v o xel equals the standard deviation. The ratio of the p osterior probabilit y to the corresponding standard deviation is called the studen tized p osterior probabilit y (P St ) as sho wn in Eq. 15. P S t = P P st p σ 2 T = P P st p P σ 2 W + + P σ 2 W − + P σ 2 µ E (15) According to this equation, the ratio of the p osterior probability to the square ro ot of v ariances of p ositive, negative and fuzzy weigh ts in b oth discrete and con- tin uous mo dels equals the studentized p osterior probabilit y in each v oxel. The studen tized p osterior probabilit y acts as a measure of the relative certain ty of the p osterior probabilit y . The vo xels where the studentized v alue falls b elow some threshold can b e masked out, due to lack of confidence in the results. In this study , the threshold is determined based on the concentration-v olume (C-V) frac- tal mo del (Afzal et al., 2011). Three-dimensional weigh ts of evidence modeling 15 As described abov e, the three-dimensional W ofE metho d used in this study is simi- lar to the traditional metho d applied for mineral prospectivity mapping (Bonham- Carter, 1994; Carranza, 2004; Cheng and Agterberg, 1999), and pixels are replaced with vo xels. W e prop ose a framework for implemen ting the metho d in a 3D space and summarize the steps to be taken for 3D mineral p otential mo deling using the W ofE metho d in Fig. 10. A brief description of these steps is presented in the follo wing. – Acquiring data including required geological and geo chemical data; – Creating a primary mo del of the target mineralization based on the Cu con- cen tration v alues obtained along the b oreholes in different interv als; – Providing 3D geological and geo chemical evidential mo dels; – Calculating the w eights of evidence and other necessary parameters suc h as the standard deviation and v ariance of the w eights for differen t geological units and eac h class of geo chemical mo dels; – Selecting input eviden tial mo dels for creating the posterior probability mo del based on the con trast and studen tized contrast; – Integrating selected eviden tial mo dels and creating 3D p osterior probabilit y and studen tized p osterior probability mo dels; – V alidating the results. 5 Results 5.1 3D evidential mo dels W e use three different types of geological data including lithology , alteration, and ro c k t yp e for creating 3D geological eviden tial models constrained to the geological map. As sho wn in Fig. 5, we considered tw o cross-sections ( AA 0 and B B 0 ) along the small and large diameters of the study area to visually in vestigate the corre- lation b etw een the aforementioned data types and the Cu concentration. These cross-sections along with the interpolated Cu concentration anomaly zones (greater than 0.2%) are sho wn in Fig. 11. As mentioned earlier, we used Ro c kW orks softw are pack age (Ro c kW orks17, 2019b) for creating 3D solid mo dels using different a v ailable geological data ob- tained from the b oreholes. As describ ed in section 4.3.1, according to the high densit y of the data p oin ts, a metho d called the closest p oin t is used to in terp o- late the geological data in the 3D space. The geological mo dels are constrained to the geological map (Fig. 5). Moreov er, the lithology mo del is constrained to the cross-sections sho wn in Fig. 8 for pro viding a more precise and reliable mo del. The solid mo dels created using lithology , alteration, and ro ck type data are presen ted in Fig. 12. The 3D ribb on mo del of the faults shown in Fig. 8 is con verted in to a blo ck mo del. The size of each vo xel in this mo del is the same as other evidential mo d- els. Moreov er, w e use t w o buffer zones with a radius of 25 and 50 m surrounding the fault blo cks to inv estigate the correlation of pro ximit y to the faults and Cu mineralization. An o verall model of the fault blocks and differen t buffer zones is 16 Ehsan F arahbakhsh et al. Fig. 10 Metho dology flow chart of this study for 3D mineral prosp ectivity mo deling of an ore deposit using the W ofE metho d. presen ted in Fig. 13. W e use the Cu concentration v alues in differen t interv als through the boreholes to create a primary 3D mo del of the target ore b o dy concealed in depth using the in verse-distance anisotropic interpolation metho d which is later used as a training mo del. Moreo ver, w e use F e, Mo, and Zn concen tration v alues for creating other geo c hemical evidential mo dels. W e present the descriptive statistics of the output mo dels in T able 2 and the anomalous vo xels in Fig. 14. The threshold used in each mo del for discriminating b etw een the anomaly p opulation and the background except for the Cu concen tration, equals the 95th percentile. According to the cutoff Three-dimensional weigh ts of evidence modeling 17 Fig. 11 Cross-sections AA 0 and B B 0 (Fig. 5) illustrated using a) lithology , b) alteration, and c) rock t yp e data obtained from the boreholes. The Cu concen tration anomaly zones are sho wn in the background and outlined using the black lines. 18 Ehsan F arahbakhsh et al. Fig. 12 Solid mo dels created using a) lithology , b) alteration, and c) rock type data. Eac h solid mo del is shown with a cutout. Three-dimensional weigh ts of evidence modeling 19 Fig. 13 Blo ck model of the fault surfaces surrounded by tw o buffer zones in a radius of 25 and 50 m. T able 2 Descriptiv e statistics of the interpolated geochemical mo dels. Element Minimum Maximum Mean Median Standard Deviation Skewness Kurtosis Cu (%) 0 1.9466 0.1758 0.1559 0.1095 2.8513 20.3918 F e (ppm) 1046.9552 227389.6406 50080.683 50797.1602 15825.3686 0.2302 2.9143 Mo (ppm) 0.0155 2613.1301 187.9939 165.018 141.2469 2.023 10.4016 Zn (ppm) 0.0327 27061.6719 339.8742 156.7078 726.8055 13.0335 273.5633 grade of Cu in the ore dep osits lo cated in the neighborho o d of our study area such as Sarcheshmeh (W aterman and Hamilton, 1975), the threshold for creating a binary mo del of the target ore b o dy is considered 0.4%. Based on this threshold, the target ore bo dy o ccupies almost 3.5% of the total mo deling space, whic h can also b e considered as the prior probabilit y (Fig. 14a). 5.2 Prosp ectivity mo deling 5.2.1 Posterior pr ob ability model Based on the equations presented in section 4.4, the ordinary weigh ts of evidence for geological evidential mo dels are determined (T able 3). W e consider every unit 20 Ehsan F arahbakhsh et al. Fig. 14 Anomalous vo xels of the 3D geo chemical mo dels created using the concentration v alues of a) Cu, b) F e, c) Mo, and d) Zn. of lithology , alteration, and rock t yp e data as a binary model in order to determine the weigh ts of evidence, con trast, and studentized con trast. Those lithology and alteration units as w ell as differen t ro ck t yp es and structural models whic h are not found in this table show negativ e contrast and are remov ed from the mo deling pro cess. One of the reasons can b e the low num b er of o ccupied vo xels, and hence lo w num b er of common vo xels with the target ore b o dy . More details can b e found in the supplemen tary file. The fuzzy w eight along with other important parameters are determined for each class of the geo chemical evidential mo dels. In T ables 4–6, w e present the results for F e, Mo, and Zn mo dels, resp ectively . It is noteworth y that the classes with negativ e contrast are neglected during the mo deling pro cess. Based on the results presented in T ables 4–6, w e plot the v ariations of contrast and fuzzy weigh t, and v ariance of contrast and studentized con trast with increas- ing the concen tration v alues of the inv estigated elements shown in Fig. 15. All the eviden tial models presented in T ables 3–6 are in tegrated as described in section 4.4, and a p osterior probability mo del is the result. The C-V fractal mo del is used for classification and determining a prop er threshold for separating anoma- lous vo xels. According to the C-V cha rt presented in Fig. 16a, the vo xels sho wing a p osterior probability greater than 0.23 are considered as the certain anomaly . Also, the v oxels sho wing a v alue greater than 0.15 and 0.09 can be considered as Three-dimensional weigh ts of evidence modeling 21 T able 3 V ariation of the ordinary weigh ts of evidence and other imp ortant parameters with different lithology and alteration units. W + W - Contrast Studentized Contrast Lithology Quartzolite 0.7046 -0.0016 0.7062 5.0496 Alteration Calcitized 0.121 -0.0026 0.1236 2.3717 Carbonatized 0.6429 -0.0033 0.6463 6.8551 Epidotized 2.2307 -0.0001 2.2308 2.732 Potassic 0.1105 -0.1611 0.2716 17.061 Silicified 0.9206 -0.0118 0.9324 16.2444 T able 4 V ariation of the fuzzy weigh ts of evidence and other imp ortant parameters with different classes of F e concentration values. Low er Limit Upper Limit W + W - Contrast Studen tized Contrast F uzzy Contrast F uzzy W eight Min 30086.0527 -1.5855 0.0872 -1.6728 -31.5801 0.01 0.0863 30086.0527 38639.6172 -0.1371 0.0142 -0.1513 -5.5568 0.6648 -0.0116 38639.6172 43641.5 -0.0218 0.0024 -0.0242 -0.9349 0.7551 -0.0037 43641.5 47356.9648 0.0021 -0.0002 0.0024 0.0923 0.7717 0.0004 47356.9648 50729.9414 0.0033 -0.0004 0.0037 0.1437 0.7725 0.0006 50729.9414 54003.6758 0.0134 -0.0015 0.0149 0.5815 0.7793 0.0027 54003.6758 57515.7734 -0.028 0.0031 -0.031 -1.1927 0.7507 -0.0046 57515.7734 61537.293 -0.2199 0.0219 -0.2418 -8.5735 0.5916 -0.0086 61537.293 67457.7891 -0.0614 0.0066 -0.068 -2.5801 0.7259 -0.0085 67457.7891 Max 0.8286 -0.1469 0.9755 51.4817 0.99 0.7728 T able 5 V ariation of the fuzzy weigh ts of evidence and other imp ortant parameters with different classes of Mo concentration v alues. Low er Limit Upper Limit W + W - Contrast Studen tized Contrast F uzzy Contrast F uzzy W eight Min 37.036 -1.3426 0.0811 -1.4237 -30.1982 0.1718 0.0634 37.036 74.6444 -0.4013 0.0365 -0.4378 -14.3426 0.6106 -0.0181 74.6444 108.0786 -0.0999 0.0105 -0.1104 -4.1198 0.7543 -0.0165 108.0786 137.7597 -0.0856 0.0091 -0.0947 -3.556 0.7602 -0.0148 137.7597 166.287 -0.0341 0.0037 -0.0378 -1.4497 0.7808 -0.0069 166.287 196.6305 -0.0773 0.0082 -0.0855 -3.2213 0.7636 -0.0137 196.6305 232.1037 0.1468 -0.0176 0.1644 6.7928 0.8436 0.047 232.1037 280.1264 0.2393 -0.0302 0.2695 11.548 0.87 0.093 280.1264 357.9801 0.244 -0.0309 0.2749 11.801 0.8712 0.0958 357.9801 Max 0.528 -0.0783 0.6063 28.9463 0.9303 0.3223 T able 6 V ariation of the fuzzy weigh ts of evidence and other imp ortant parameters with different classes of Zn concentration v alues. Low er Limit Upper Limit W + W - Contrast Studen tized Contrast F uzzy Contrast F uzzy W eight Min 67.9985 -0.9715 0.0684 -1.0399 -26.2799 0.3132 0.0359 67.9985 84.6815 -0.474 0.0417 -0.5157 -16.358 0.572 -0.0125 84.6815 102.5373 0.1285 -0.0153 0.1438 5.8967 0.8379 0.0394 102.5373 125.5783 0.274 -0.0352 0.3093 13.4312 0.8789 0.1138 125.5783 155.639 0.2312 -0.029 0.2602 11.1136 0.8678 0.0884 155.639 198.6275 0.1243 -0.0147 0.139 5.6916 0.8366 0.0378 198.6275 267.4829 0.0086 -0.001 0.0096 0.375 0.797 0.002 267.4829 394.8134 0.086 -0.01 0.096 3.8698 0.8242 0.0239 394.8134 700.7863 0.0092 -0.001 0.0103 0.4007 0.7972 0.0021 700.7863 Max 0.07 -0.0081 0.078 3.1242 0.8188 0.0186 22 Ehsan F arahbakhsh et al. Fig. 15 V ariations of con trast and fuzzy w eight with the concen tration v alues of a) F e, b) Mo, and c) Zn. V ariations of v ariance of contrast and studentized contrast with the concentration v alues of d) F e, e) Mo, and f ) Zn. the probable and p ossible anomaly , resp ectively . In Fig. 16b, the classified pos- terior probability model and the vo xels with v alues greater than 0.08 are shown whic h o ccupy nearly 3% of the mo deling space. 5.2.2 Studentize d p osterior pr ob ability mo del The total v ariance of each v oxel is given b y summing the v ariances of the ordinary and fuzzy weigh ts of evidence, which is considered as an estimate of the uncertain t y asso ciated with each vo xel. Similar to the p osterior probabilit y mo del, we use the C-V c hart for classification and separating the anomalous v o xels. According to the relev ant c hart sho wn in Fig. 17a, the v oxels with v alues greater than 4.9 are considered as a certain anomaly . Those vo xels showing v alues greater than 3.8 and o ccup ying nearly 3% of the mo deling space are sho wn in Fig. 17b. Three-dimensional weigh ts of evidence modeling 23 Fig. 16 a) C-V c hart of the p osterior probability of Cu mineralization in the modeling space. b) Classified anomalous v oxels extracted based on the thresholds determined b y the C-V c hart. 5.3 V alidation In 2D mineral prosp ectivity mapping, a prediction-area plot is used in order to quantitativ ely v alidate the results obtained from prosp ectivity maps (Y ousefi and Carranza, 2015). W e extend the application of this type of plots to three- dimensional space and call them prediction-volume (P-V) plots. In P-V plots, we 24 Ehsan F arahbakhsh et al. Fig. 17 a) C-V chart of the studentized posterior probability of Cu mineralization in the modeling space. b) Classified anomalous v oxels extracted based on the thresholds determined by the C-V c hart. sho w the cum ulative percentage of predicted mineralization and the corresp ond- ing cumulativ e o ccupied volume, with resp ect to the total volume against the prosp ectivit y v alues. Therefore, the prediction abilit y of a prospectivity model and its ability to delimit the mo deling space for further exploration and drilling are ev aluated in a sc heme. The P-V plot sho ws a curv e of the percentage (prediction rate) of kno wn mineralization and a curv e of the p ercentage of o ccupied volume Three-dimensional weigh ts of evidence modeling 25 corresp onding to the classes of a prosp ectivity mo del. When an intersection p oin t of the t w o curv es is at a higher place, it portrays a small v olume containing a large n umber of mineralization-b earing v oxels. The comparison of prediction rates in the P-V plots sho wn in Fig. 18, indicates the imp ortance of analyzing the predictabil- it y of the prosp ectivit y mo dels. W e compared tw o prosp ectivity mo dels including the p osterior and studentized p osterior probabilit y models. It is noteworth y that for assigning probabilistic v alues to b oth mo dels in terms of prosp ecting for Cu mineralization, and distribution of the vo xel v alues b etw een 0 and 1, they are transformed to a fuzzy space using a linear function. 6 Discussion Most of the study area is co v ered b y alluvium, therefore the surface outcrop do es not allo w the lithology and alteration assem blages to be identified as detailed as the drill cores. In this study , w e used tw o different t yp es of drilling data includ- ing qualitativ e geological and quantitativ e geochemical data obtained from 113 b oreholes through creating a 3D prosp ectivit y mo del of Cu mineralization. The geological data comprise three types of data including lithology , alteration, and ro c k type. Among the lithology t yp es, quartzolite units (i.e., intrusiv e rocks with a quartz conten t ¿90%) show p ositive contrast and studentized contrast (T able 3) whic h w ere used as an input binary mo del to the mo deling process. The quartzolite units whic h in v olve less than 1% of the mo deling space show a high studentized con trast indicating high correlation of this lithology t yp e with Cu mineralization in the mo deling space. Based on Figs. 11a and 12a, most of the mo deling space is o ccupied by andesite which shows a contrast near zero and uncorrelated with Cu mineralization. The grano diorite units are in the second place in terms of volume p ercen tage and sho w a negative contrast. According to Fig. 11a, high-grade Cu concen tration is asso ciated with sto ckw ork veins mainly hosted b y andesite which can b e due to the high p orosity and p ermeability of this lithology t yp e caused by fractures. These probable fractures pro vide a path for hydrothermal fluids through ascending to the ground surface. In Fig. 11a, the cross-section B − B 0 app ears to sho w a vertical pip e hosted b y andesite and c haracterized b y elev ated Cu con- cen tration where the section A − A 0 crosses section B − B 0 . On the other hand, grano diorite units can b e considered barren or po orly mineralized. Among the different t yp es of alteration in the study area, calcitized, carb onatized, epidotized, p otassic, and silicified units show p ositiv e contrast and studen tized con trast (T able 3). These units were used as input binary mo dels to the mo deling pro cess. According to the results, potassic and silicified units sho w the highest stu- den tized con trast v alues, respectively . It is noteworth y that the contrast of silica alteration is muc h higher than the p otassic alteration. This is compatible with the metallogenic model of the mineralization in the study area, b ecause Cu mineral- ization is mostly observed along the silicified veins. The carb onatized units show a relativ ely high contrast, and according to the metallogenic mo del, malac hite and azurite are considered as the main ore minerals. The epidotized and calcitized units are the last alteration units in terms of studentized contrast. The epidotized units occupy a small p ortion of the modeling space and the results are not reliable, although they sho w a high con trast v alue. The calcitized units sho w a low con trast v alue and then, a weak asso ciation with Cu mineralization in the mo deling space. 26 Ehsan F arahbakhsh et al. Fig. 18 P-V plots for a) the posterior probabilit y and b) studen tized posterior probabilit y prospectivity mo dels. According to Fig. 6c, the ro cks lo cated in the mo deling space originate from fiv e differen t sources, and none of them show ed a p ositive contrast. Therefore, w e did not use this type of geological data in the modeling pro cess. W e used surficial structural data through creating a 3D model of the fault surfaces due to lac k of structural information in the drilling data. In addition to the fault surfaces which w ere con verted in to the fault blo c ks, t wo differen t buffer zones in a radius of 25 and 50 m were created surrounding the fault blo cks. All the structural mo dels sho w a Three-dimensional weigh ts of evidence modeling 27 negativ e con trast and w ere remo ved from the mo deling pro cess. This confirms the field observ ations implying that the Cu-b earing mineralization zones in the study area, are mainly asso ciated with azurite and malachite stockw ork veins and less asso ciated with the faults. Besides the qualitativ e geological data, we used the quantitativ e geo c hemical data consisting of the concen tration v alues of three elements including F e, Mo, and Zn. These elements are known as the key indicators of Cu mineralization in the study area. The interpolated mo del of the Cu concentration v alues used as the training mo del, ranges from 0 to nearly 2% with an a verage of 0.17%. The mo del is p osi- tiv ely skew ed and shows a high kurtosis v alue. Based on the descriptive statistics presen ted in T able 2, the eviden tial mo del of F e concen tration is the only mo del whic h sho ws a normal behavior with a sk ewness near zero and a kurtosis near 3 (Mon tgomery et al., 2010). The concentration v alues in this model range from nearly 0.1 to more than 22% with an av erage of 5%. The Mo mo del ranges from nearly 0.01 to more than 2600 ppm, sho wing an a verage of nearly 188 ppm. This mo del is p ositively skew ed and shows a high kurtosis v alue. The Zn model which ranges from nearly 0.03 to more than 27000 ppm, is highly skew ed and shows a very high kurtosis v alue. As explained in section 4.4, to minimize the loss of informa- tion through conv erting contin uous mo dels into binary mo dels, we determined the fuzzy weigh t of each class. Instead of using only a sp ecific class of the contin uous mo dels, we used all those classes showing a positive contrast in the prosp ectiv- it y mo deling pro cess. According to T ables 4–6, the highest studentized contrast v alues b elong to the classes from F e (51.4817), Mo (28.9463), and Zn (13.4312) mo dels, resp ectively . Based on the graphs presented in Fig. 15, there is no linear relationship b etw een con trast and fuzzy w eight in con tinuous models, and a high con trast do es not necessarily yield a high fuzzy weigh t. On the other hand, we see a clear inv erse relationship b etw een v ariance of contrast and studentized contrast. W e created tw o probability mo dels including p osterior and studen tized posterior probabilit y mo dels for visualizing Cu mineralization potential in the target mod- eling space. It is clear that the studentized p osterior probabilit y mo del is more reliable due to the contribution of uncertaint y through determining the anoma- lous vo xels. According to Fig. 17b, where there are a low num b er of boreholes, the total v ariance or uncertain ty sho ws a high v alue whic h gives a low studentized p osterior probability . The intersection point in the P-V plot of the p osterior prob- abilit y mo del shows 56% of the anomalous vo xels in the interpolated mo del of Cu concen tration ha ve b een predicted in 44% of the total mo deling space. The in ter- section p oint in the P-V plot corresp onding to the studentized p osterior mo del sho ws 59% of the anomalous vo xels in the interpolated mo del of Cu concentration ha ve b een predicted in 41% of the total mo deling space. The con tribution of un- certain ty in creating the studentized p osterior probability mo del leads to a higher prediction rate compared to the posterior probability model. According to Fig. 19, the ore bo dy is divided in to t wo parts. One is located in a shallo w depth and southw est of the modeling space, while the other is lo cated in a deep er lev el and northeast of the study area. The ore bo dy located in the northeast is restricted to the fault surfaces, implying the younger age of the fault surfaces than the mineralization. The fault surfaces in the southw est are related to the mineralization and surrounded by anomalous vo xels. These faults can b e considered as the conduits through whic h the hydrothermal fluids ha ve risen up near to the ground surface. The ore b o dies and the difference in the depth of Cu 28 Ehsan F arahbakhsh et al. Fig. 19 F ault surfaces shown with the anomalous voxels of the studentized posterior proba- bility mo del (Fig. 17b). mineralization are ob vious and outlined in Fig. 20. W e implemented the three-dimensional W ofE mo deling using Python scripts and release them as op en-source softw are. The main adv antage of these scripts is that they are simple and easy to understand for a user with basic knowledge of programming and can b e extended for other t yp es of problems. 7 Conclusions In this study , we created a mineral prospectivity mo del based on 3D weigh ts of evidence b y integration of qualitative geological and quan titativ e geo chemical b orehole data lo cated on a p orphyry Cu dep osit in southeast Iran. T o minimize the loss of information, we determined the ordinary and fuzzy weigh ts of evidence Three-dimensional weigh ts of evidence modeling 29 Fig. 20 Side views of the studentized posterior probability model to the a) north, and b) west. for discrete and con tinuous evidential mo dels, respectively . The in tegration of v ari- ous input evidential mo dels provided t wo prosp ectivity models including p osterior probabilit y and studentized p osterior probability mo dels. The C-V fractal mo d- els w ere used through finding suitable thresholds for classifying and separating anomaly p opulations from the background. Although the studentized posterior probabilit y mo del is more reliable due to the lo w er uncertaint y , b oth the p oste- rior and studentized p osterior probability mo dels show an acceptable prediction rate based on the P-V plots. The results show the efficiency of our framew ork in constructing different geometric mo dels of a sp ecific ore dep osit concealed in depth. The proposed framew ork helps in determining key factors whic h control the mineralization in the modeling space, identifying potential mineralization, and impro ving the p erception of ore genesis. Among the lithological units, quartzolite sho ws a high correlation with Cu mineralization in the mo deling space. Moreov er, p otassic, silica, carbonate, and prop ylitic alteration types are strongly asso ciated with Cu mineralization. The fuzzy weigh ts determined for contin uous mo dels sho w a high correlation betw een Cu and F e concen tration v alues, while Mo and Zn show an a v erage correlation. According to the results of mineral prospectivity modeling, it is concluded that Cu mineralization is mainly asso ciated with sto c kwork veins whic h confirms the field observ ations. The Cu mineralization is iden tified in t wo separate b o dies lo cated in different depths cov ered by a thin lay er of regolith. The h ybrid application of ordinary and fuzzy weigh ts of evidence yields a promising result for the future studies. The 3D mineral prosp ectivity mo deling based on the w eights of evidence is highly dep enden t on the primary model created using the concen tration v alues of a specific target element. In future, we aim to use geostatis- tical metho ds for creating a more reliable mo del to consider as the primary target ore bo dy , since we can provide an uncertaint y mo del b eside the model yielded b y the interpolation pro cess. In addition, we can decrease the uncertain ty and increase the prediction rate in our p osterior probabilit y mo del b y adding other exploration data suc h as geo c hemical and geoph ysical mo dels and creating more input eviden tial mo dels compatible to the metallogenic mo del of the study area. 30 Ehsan F arahbakhsh et al. Supplemen tary data The Python scripts for implementing the prop osed framework and supplementary files including more details on the evidential models are av ailable at https:// github.com/intelligent- exploration/3D_WofE . Ac knowledgemen ts W e ackno wledge National Iranian Copp er Industries Company for pro- viding the data. Conflict of in terest The authors declare that they ha v e no conflict of interest. References Ab edi M, Gholami A, Norouzi GH (2014) 3D in version of magnetic data seeking sharp b oundaries: A case study for a p orph yry copp er deposit from Now Ch un in cen tral Iran. Near Surface Geoph ysics 12(5):657–666, DOI 10.3997/1873- 0604. 2014022 Afzal P , Alghalandis YF, Khakzad A, Moarefv and P , Omran NR (2011) Delin- eation of mineralization zones in porphyry Cu dep osits b y fractal concen tration- v olume mo deling. Journal of Geo c hemical Exploration 108(3):220–232, DOI 10.1016/j.gexplo.2011.03.005 Agterb erg FP , Bonham-Carter GF, W right DF (1990) Statistical Pattern Integra- tion for Mineral Exploration. In: Gaal G, Merriam DF (eds) Computer Appli- cations in Resource Estimation, Computers and Geology , Pergamon, pp 1–21, DOI 10.1016/B978- 0- 08- 037245- 7.50006- 8 ArcGIS Desktop (2019) ESRI. URL https://www.esri.com/en- us/arcgis/ about- arcgis/overview Berb erian F, Berb erian M (1981) T ectono-Plutonic Episo des in Iran. In: Zagros Hindu Kush Himalay a Geo dynamic Ev olution, American Geoph ysical Union (A GU), pp 5–32, DOI 10.1029/GD003p0005 Berger BR, Ayuso RA, Wynn JC, Seal RR (2008) Preliminary mo del of p orphyry copp er dep osits. T ech. rep., U.S. Geological Surv ey Op en-File Rep ort 20081321, DOI 10.1127/0077- 7749/2011/0172 Bonham-Carter GF (1994) Geographic Information Systems for Geoscientists: Mo deling with GIS Bonham-Carter GF, Agterb erg FP , W righ t DF (1989) W eigh ts of evidence mod- elling: a new approac h to mapping mineral p otential. In: Agterberg FP , Bonham- Carter GF (eds) Statistical Applications in the Earth Sciences, Geological Sur- v ey of Canada, pp 171–183 Bro wn WM, Gedeon TD, Gro ves DI, Barnes R G (2000) Artificial neural netw orks: a new metho d for mineral prospectivity mapping. Australian Journal of Earth Sciences 47(4):757–770, DOI 10.1046/j.1440- 0952.2000.00807.x Carranza EJM (2004) W eigh ts of evidence mo deling of mineral potential: a case study using small n umber of prospects, Abra, Philippines. Natural Resources Researc h 13(3):173–187, DOI 10.1023/B:NARR.0000046919.87758.f5 Three-dimensional weigh ts of evidence modeling 31 Carranza EJM (2009) Controls on mineral dep osit o ccurrence inferred from anal- ysis of their spatial pattern and spatial asso ciation with geological features. Ore Geology Reviews 35(3-4):383–400, DOI 10.1016/j.oregeorev.2009.01.001 Carranza EJM, Lab orte AG (2015) Random forest predictive mo deling of mineral prosp ectivit y with small num b er of prosp ects and data with missing v alues in Abra (Philippines). Computers & Geosciences 74:60–70, DOI 10.1016/j.cageo. 2014.10.004 Carranza EJM, Sadeghi M (2010) Predictive mapping of prosp ectivity and quan- titativ e estimation of undiscov ered VMS dep osits in Skellefte district (Sweden). Ore Geology Reviews 38(3):219–241, DOI 10.1016/j.oregeorev.2010.02.003 Carranza EJM, W oldai T, Chik amb we EM (2005) Application of data-driv en ev- iden tial belief functions to prosp ectivit y mapping for aquamarine-bearing p eg- matites, Lundazi district, Zambia. Natural Resources Research 14(1):47–63, DOI 10.1007/s11053- 005- 4678- 9 Carranza EJM, v an Ruitenbeek FJA, Heck er C, v an der Meijde M, v an der Meer FD (2008) Knowledge-guided data-driven evidential belief modeling of mineral prosp ectivit y in Cab o de Gata, SE Spain. International Journal of Applied Earth Observ ation and Geoinformation 10(3):374–387, DOI 10.1016/j.jag.2008.02.008 Chen Y, W u W (2017) Mapping mineral prospectivity using an extreme learning mac hine regression. Ore Geology Reviews 80:200–213, DOI 10.1016/j.oregeorev. 2016.06.033 Cheng Q, Agterb erg FP (1999) F uzzy w eights of evidence metho d and its appli- cation in mineral p otential mapping. Natural Resources Research 8(1):27–35, DOI 10.1023/A:1021677510649 F allara F, Legault M, Rab eau O (2006) 3-D integrated geological mo deling in the Abitibi Subprovince (Qu ´ eb ec, Canada): techniques and applications. Explo- ration and Mining Geology 15(1-2):27–43 F arahbakhsh E, Chandra R, Eslamkish T, M ¨ uller RD (2019a) Mo deling geo chem- ical anomalies of stream sediment data through a weigh ted drainage catchmen t basin metho d for detecting p orphyry Cu-Au mineralization. Journal of Geo- c hemical Exploration 204:12–32, DOI 10.1016/j.gexplo.2019.05.003 F arahbakhsh E, Chandra R, Olierook HKH, Scalzo R, Clark C, Reddy SM, M ¨ uller RD (2019b) Computer vision-based framework for extracting tectonic linea- men ts from optical remote sensing data. International Journal of Remote Sens- ing 0(0):1–28, DOI 10.1080/01431161.2019.1674462 Houlding S (1994) 3D Geoscience Mo deling: Computer T ec hniques for Geological Characterization. Springer Jessell M, Aill` eres L, Kemp ED, Lindsay M, W ellmann F, Hillier M, Lauren t G, Carmic hael T, Martin R (2014) Next Generation Three-Dimensional Geologic Mo deling and Inv ersion. In: Building Exploration Capability for the 21st Cen- tury , pp 261–272, DOI 10.5382/SP .18.13 Joly A, P orwal A, McCuaig TC (2012) Exploration targeting f or orogenic gold dep osits in the Granites-T anami Orogen: Mineral system analysis, targeting mo del and prosp ectivity analysis. Ore Geology Reviews 48:349–383, DOI 10. 1016/j.oregeorev.2012.05.004 Kno x-Robinson CM (2000) V ectorial fuzzy logic: a nov el technique for enhanced mineral prosp ectivity mapping, with reference to the orogenic gold mineralisa- tion p otential of the Kalgo orlie T errane, W estern Australia. Australian Journal of Earth Sciences 47(5):929–941, DOI 10.1046/j.1440- 0952.2000.00816.x 32 Ehsan F arahbakhsh et al. Kreuzer OP , Miller A VM, Peters KJ, Pa yne C, Wildman C, Partington GA, Puc- cioni E, McMahon ME, Etheridge MA (2015) Comparing prosp ectivity mo d- elling results and past exploration data: a case study of porphyry Cu-Au min- eral systems in the Macquarie Arc, Lachlan F old Belt, New South W ales. Ore Geology Reviews 71:516–544, DOI 10.1016/j.oregeorev.2014.09.001 Li N, Song X, Xiao K, Li S, Li C, W ang K (2018) Part I I: A demonstration of in tegrating multiple-scale 3D modelling into GIS- based prosp ectivity analysis: A case study of the Huayuan-Malic hang district , China. Ore Geology Reviews 95:292–305, DOI 10.1016/j.oregeorev.2018.02.034 Li X, Y uan F, Zhang M, Jia C, Jo witt SM, Ord A, Zheng T, Hu X, Li Y (2015) Three-dimensional mineral prosp ectivity mo deling for targeting of concealed mineralization within the Zhonggu iron orefield, Ningwu basin, China. Ore Ge- ology Reviews 71:633–654, DOI 10.1016/j.oregeorev.2015.06.001 Lindsa y MD, Aill` eres L, Jessell MW, de Kemp EA, Betts PG (2012) Lo cating and quan tifying geological uncertaint y in three-dimensional mo dels: analysis of the Gippsland basin, Southeastern Australia. T ectonoph ysics 546-547:10–27, DOI 10.1016/j.tecto.2012.04.007 Liu L, Li J, Zhou R, Sun T (2016) 3D mo deling of the p orph yry-related Da wangding gold dep osit in south China: Implications for ore genesis and resources ev aluation. Journal of Geochemical Exploration 164:164–185, DOI 10.1016/j.gexplo.2015.11.002 Lo well JD, Guilb ert JM (1970) Lateral and vertical alteration-mineralization zoning in porphyry ore deposits. Economic Geology 65(4):373–408, DOI 10.2113/gsecongeo.65.4.373 Manap MA, Sulaiman WNA, Ramli MF, Pradhan B, Surip N (2013) A kno wledge- driv en GIS mo deling tec hnique for groundwater p otential mapping at the Upper Langat Basin, Malaysia. Arabian Journal of Geosciences 6(5):1621–1637, DOI 10.1007/s12517- 011- 0469- 2 Mao X, Ren J, Liu Z, Chen J, T ang L, Deng H, Ba yless R C, Y ang B, W ang M, Liu C (2019) Three-dimensional prosp ectivity mo deling of the Jiao jia-type gold dep osit, Jiaodong Peninsula, Eastern China: A case study of the Dayingezh uang dep osit. Journal of Geo c hemical Exploration 203:27–44, DOI 10.1016/j.gexplo. 2019.04.002 Meng L (1997) Metallogenic mo del of the copp er dep osit. Science in China Series D: Earth Sciences 40(3):225–231, DOI 10.1007/BF02877529 Mon tgomery DC, Runger GC, Hub ele NF (2010) Engineering Statistics, 5th edn. John Wiley & Sons Mudd GM, Jowitt SM (2018) Growing global copper resources, reserv es and pro duction: Discov ery is not the only control on supply . Economic Geology 113(6):1235–1267, DOI 10.5382/econgeo.2018.4590 Mudd GM, W eng Z, Jo witt SM (2013) A detailed assessmen t of global Cu resource trends and endowmen ts. Economic Geology 108(5):1163–1183, DOI 10.2113/ econgeo.108.5.1163 Nielsen SHH, Cunningham F, Hay R, Partington G, Stokes M (2015) 3D prosp ec- tivit y mo delling of orogenic gold in the Marymia Inlier, W estern Australia. Ore Geology Reviews 71:578–591, DOI 10.1016/j.oregeorev.2015.02.001 Nielsen SHH, Partington GA, F raney D, Dwight T (2019) 3D mineral p otential mo delling of gold distribution at the T ampia gold dep osit. Ore Geology Reviews 109:276–289, DOI 10.1016/j.oregeorev.2019.04.012 Three-dimensional weigh ts of evidence modeling 33 Oliero ok HKH, Scalzo R, Kohn D, Chandra R, F arahbakhsh E, Houseman G, Clark C, Reddy SM, M ¨ uller RD (2019) Bay esian geological and geophysical data fusion for the construction and uncertain ty quantification of 3D geological mo dels. Solid Earth Discussions pp 1–34, DOI 10.5194/se- 2019- 4 Omrani J, Agard P , Whitech urch H, Benoit M, Prouteau G, Jolivet L (2008) Arc-magmatism and sub duction history beneath the Zagros Moun tains, Iran: a new rep ort of adakites and geo dynamic consequences. Lithos 106(3):380–398, DOI 10.1016/j.lithos.2008.09.008 P ayne CE, Cunningham F, P eters KJ, Nielsen S, Puccioni E, Wildman C, P arting- ton GA (2015) F rom 2D to 3D: prosp ectivity mo delling in the T aupo v olcanic zone, New Zealand. Ore Geology Reviews 71:558–577, DOI 10.1016/j.oregeorev. 2014.11.013 P azand K, Hezarkhani A (2014) The use of the w eigh ts-of-evidence mo deling tec hnique to predictive p orphyry Cu p otential mapping in Ahar-Arasbaran zone, Iran. Arabian Journal of Geosciences 7(10):4191–4201, DOI 10.1007/ s12517- 013- 0983- 5 P orwal A, Carranza EJM, Hale M (2003) Kno wledge-driven and data-driv en fuzzy mo dels for predictive mineral p otential mapping. Natural Resources Research 12(1):1–25, DOI 10.1023/A:1022693220894 P orwal A, Gonz´ alez- ´ Alv arez I, Markwitz V, McCuaig TC, Mamuse A (2010) W eights-of-evidence and logistic regression mo deling of magmatic nick el sulfide prosp ectivit y in the Yilgarn craton, W estern Australia. Ore Geology Reviews 38(3):184–196, DOI 10.1016/j.oregeorev.2010.04.002 QGIS Dev elopment T eam (2019) QGIS Geographic Information System Ro c kW orks17 (2019a) Softw are Help Files (Revision 2019.7.30). URL https:// help.rockware.com/rockworks17/WebHelp/introduction.htm Ro c kW orks17 (2019b) Soft ware (Revision 2019.7.30). URL https://www. rockware.com/product/rockworks/ Ro driguez-Galiano V, Sanchez-Castillo M, Chica-Olmo M, Chica-Riv as M (2015) Mac hine learning predictive mo dels for mineral prosp ectivity: an ev aluation of neural net works, random forest, regression trees and support vector machines. Ore Geology Reviews 71:804–818, DOI 10.1016/j.oregeorev.2015.01.001 Scalzo R, Kohn D, Olierook H, Houseman G, Chandra R, Girolami M, Cripps S (2019) Efficiency and robustness in Monte Carlo sampling for 3-D geophysi- cal inv ersions with Obsidian v0.1.2: setting up for success. Geoscien tific Model Dev elopment 12(7):2941–2960, DOI 10.5194/gmd- 12- 2941- 2019 Sc ho dde R (2013) Long term outlo ok for the global exploration industryglo om or b o om. In: Geological So ciety of South Africa GeoF orum Conference, Johannes- burg Sillito e RH (2010) P orphyry copp er systems. Economic Geology 105(1):3–41, DOI 10.2113/gsecongeo.105.1.3 Sun T, Chen F, Zhong L, Liu W, W ang Y (2019) GIS-based mineral prosp ectivity mapping using machine learning metho ds: A case study from T ongling ore dis- trict, eastern China. Ore Geology Reviews 109:26–49, DOI 10.1016/j.oregeorev. 2019.04.003 W ang G, Huang L (2012) 3D geological mo deling for mineral resource assessment of the T ongshan Cu deposit, Heilong jiang Pro vince, China. Geoscience F rontiers 3(4):483–491, DOI 10.1016/j.gsf.2011.12.012 34 Ehsan F arahbakhsh et al. W aterman GC, Hamilton RL (1975) The Sar Cheshmeh p orphyry copp er dep osit. Economic Geology 70(3):568–576, DOI 10.2113/gsecongeo.70.3.568 Xiao F, Chen J, Agterb erg F, W ang C (2014) Elemen t behavior analysis and its implications for geo chemical anomaly identification: A case study for p orphyry Cu-Mo dep osits in Eastern Tianshan, China. Journal of Geochemical Explo- ration 145:1–11, DOI 10.1016/j.gexplo.2014.04.008 Xiao K, Li N, Porw al A, Holden EJ, Bagas L, Lu Y (2015) GIS-based 3D prosp ec- tivit y mapping: A case study of Jiama copp er-p olymetallic deposit in Tib et, China. Ore Geology Reviews 71:611–632, DOI 10.1016/j.oregeorev.2015.03.001 Xiong Y, Zuo R (2018) GIS-based rare even ts logistic regression for mineral prosp ectivit y mapping. Computers & Geosciences 111:18–25, DOI 10.1016/j. cageo.2017.10.005 Y ousefi M, Carranza EJM (2015) F uzzification of contin uous-v alue spatial evidence for mineral prosp ectivity mapping. Computers and Geosciences 74:97–109, DOI 10.1016/j.cageo.2014.10.014 Y ousefi M, Nyk¨ anen V (2016) Data-driven logistic-based w eighting of geo chemi- cal and geological evidence lay ers in mineral prosp ectivity mapping. Journal of Geo c hemical Exploration 164:94–106, DOI 10.1016/j.gexplo.2015.10.008 Y uan F, Li X, Zhang M, Jowitt SM, Jia C, Zheng T, Zhou T (2014) Three- dimensional weigh ts of evidence-based prospectivity mo deling: A case study of the Baixiangshan mining area, Ningwu Basin, Middle and Lo w er Y angtze Metallogenic Belt, China. Journal of Geo chemical Exploration 145:82–97, DOI 10.1016/j.gexplo.2014.05.012 Zeghouane H, Allek K, Kesraoui M (2016) GIS-based w eights of evidence mo deling applied to mineral prosp ectivity mapping of Sn-W and rare metals in Laouni area, Cen tral Hoggar, Algeria. Arabian Journal of Geosciences 9(5):373, DOI 10.1007/s12517- 015- 2188- 6 Zuo R (2011) Identifying geo chemical anomalies asso ciated with Cu and Pb-Zn sk arn mineralization using principal comp onent analysis and sp ectrum-area frac- tal mo deling in the Gangdese Belt, Tib et (China). Journal of Geochemical Ex- ploration 111(1-2):13–22, DOI 10.1016/j.gexplo.2011.06.012 Zuo R, John E, Carranza EJM (2011) Supp ort vector machine: a to ol for map- ping mineral prosp ectivit y . Computers & Geosciences 37(12):1967–1975, DOI 10.1016/j.cageo.2010.09.014 Zuo R, Carranza EJM, W ang J (2016) Spatial analysis and visualization of ex- ploration geo chemical data. Earth-Science Reviews 158:9–18, DOI 10.1016/j. earscirev.2016.04.006
Original Paper
Loading high-quality paper...
Comments & Academic Discussion
Loading comments...
Leave a Comment