COVID-19 Kaggle Literature Organization
The world has faced the devastating outbreak of Severe Acute Respiratory Syndrome Coronavirus-2 (SARS-CoV-2), or COVID-19, in 2020. Research in the subject matter was fast-tracked to such a point that scientists were struggling to keep up with new findings. With this increase in the scientific literature, there arose a need for organizing those documents. We describe an approach to organize and visualize the scientific literature on or related to COVID-19 using machine learning techniques so that papers on similar topics are grouped together. By doing so, the navigation of topics and related papers is simplified. We implemented this approach using the widely recognized CORD-19 dataset to present a publicly available proof of concept.
💡 Research Summary
The paper addresses the overwhelming influx of COVID‑19 related scientific publications by presenting an automated pipeline that clusters and visualizes the literature, thereby facilitating rapid discovery of relevant work. Using the publicly available CORD‑19 dataset—originally compiled by the Allen Institute for AI, the Chan Zuckerberg Initiative, Microsoft Research, IBM, and the NIH—the authors first clean the data, removing duplicates, abstracts‑only entries, and non‑English papers, resulting in a corpus of 49,967 full‑text articles.
Text preprocessing is performed with SciSpacy’s biomedical models: tokenization, stop‑word removal (including domain‑specific tokens such as “doi” and “medrxiv”), punctuation stripping, and lower‑casing. The cleaned token streams are vectorized with scikit‑learn’s TF‑IDF transformer, limited to 2¹² features to control memory usage while acting as a noise filter. This yields a high‑dimensional sparse matrix X₁ for each document.
To mitigate the curse of dimensionality, Principal Component Analysis (PCA) is applied to X₁, retaining enough components to explain 95 % of the variance, producing a dense embedding X₂. The authors then employ k‑means clustering on X₂ to assign each paper a label. The optimal number of clusters k is determined by examining the distortion curve (sum of squared distances to nearest centroids) and selecting the elbow point, which occurs around k = 20. This choice balances intra‑cluster cohesion with inter‑cluster separation, avoiding over‑fragmentation.
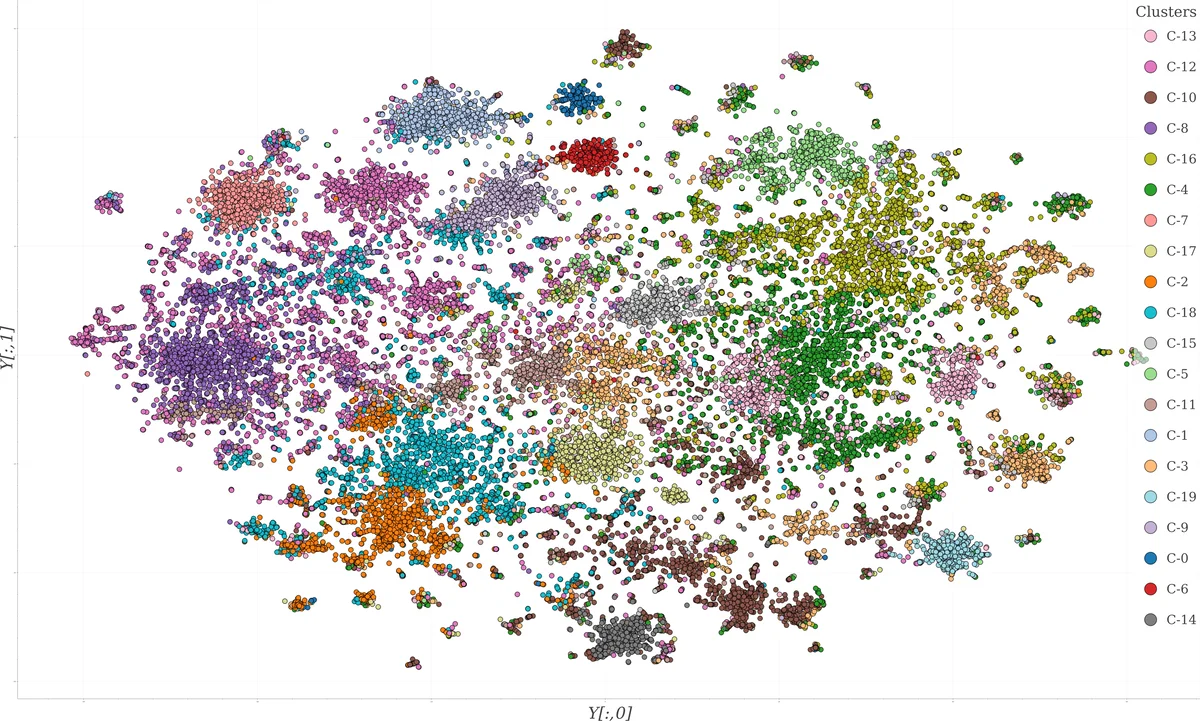
For visualization, the original TF‑IDF matrix X₁ is projected into two dimensions using t‑distributed Stochastic Neighbor Embedding (t‑SNE), a non‑linear technique that preserves local structure and mitigates crowding. The resulting 2‑D coordinates (Y) are plotted on an interactive scatter plot where point colors correspond to the k‑means labels. The plot is hosted on Kaggle and linked to a GitHub repository containing a Jupyter notebook; it receives roughly ten visits per day, indicating active community interest.
The authors validate their approach in two ways. First, a manual qualitative inspection of the t‑SNE plot reveals clearly separated clusters; for example, a red cluster (C‑6) groups papers on bat‑borne viruses, including coronaviruses, lyssaviruses, and flaviviruses, with a sub‑cluster focusing on SARS in bats. Notably, despite t‑SNE and k‑means operating on different representations (X₁ vs. X₂), many cluster boundaries align, though some discrepancies arise due to the higher‑dimensional nature of the k‑means space and the inherent ambiguity of visual decision boundaries.
Second, domain experts from Utah State University (biomedical engineers) used the tool to explore thematic relationships. They observed that highly specific topics (e.g., animal infection, viral reservoirs) formed tight clusters because of repeated specialized terminology, whereas multidisciplinary topics (e.g., epidemiology combined with virology) produced more dispersed or overlapping clusters. The visualization also helped them quickly locate recent papers on antiviral drug efficacy, demonstrating practical utility. Additionally, a biologist from UC Santa Cruz applied the same pipeline to literature on tropical reef fish and plastic pollution, confirming the method’s transferability to other biological domains.
Key contributions include: (1) an end‑to‑end workflow that integrates TF‑IDF, PCA, k‑means, and t‑SNE for large‑scale biomedical text clustering and visualization; (2) the identification of approximately 20 meaningful thematic clusters within the COVID‑19 literature, enabling researchers to navigate the corpus efficiently; and (3) open‑source release of the code and interactive visualizations, encouraging community extensions.
Limitations are acknowledged. k‑means assumes spherical clusters, which may not capture complex topic geometries; t‑SNE’s stochastic nature can lead to variability across runs, affecting reproducibility; and the focus on English‑language papers excludes valuable non‑English research. Future work is proposed to incorporate density‑based clustering algorithms such as DBSCAN or HDBSCAN, alternative dimensionality reduction techniques like UMAP, and multilingual preprocessing pipelines to broaden coverage. Overall, the study demonstrates that relatively simple machine‑learning techniques, when thoughtfully combined, can substantially alleviate information overload in fast‑moving scientific fields like COVID‑19 research.
Comments & Academic Discussion
Loading comments...
Leave a Comment