Adversarial regression training for visualizing the progression of chronic obstructive pulmonary disease with chest x-rays
Knowledge of what spatial elements of medical images deep learning methods use as evidence is important for model interpretability, trustiness, and validation. There is a lack of such techniques for models in regression tasks. We propose a method, ca…
Authors: Ricardo Bigolin Lanfredi, Joyce D. Schroeder, Clement Vachet
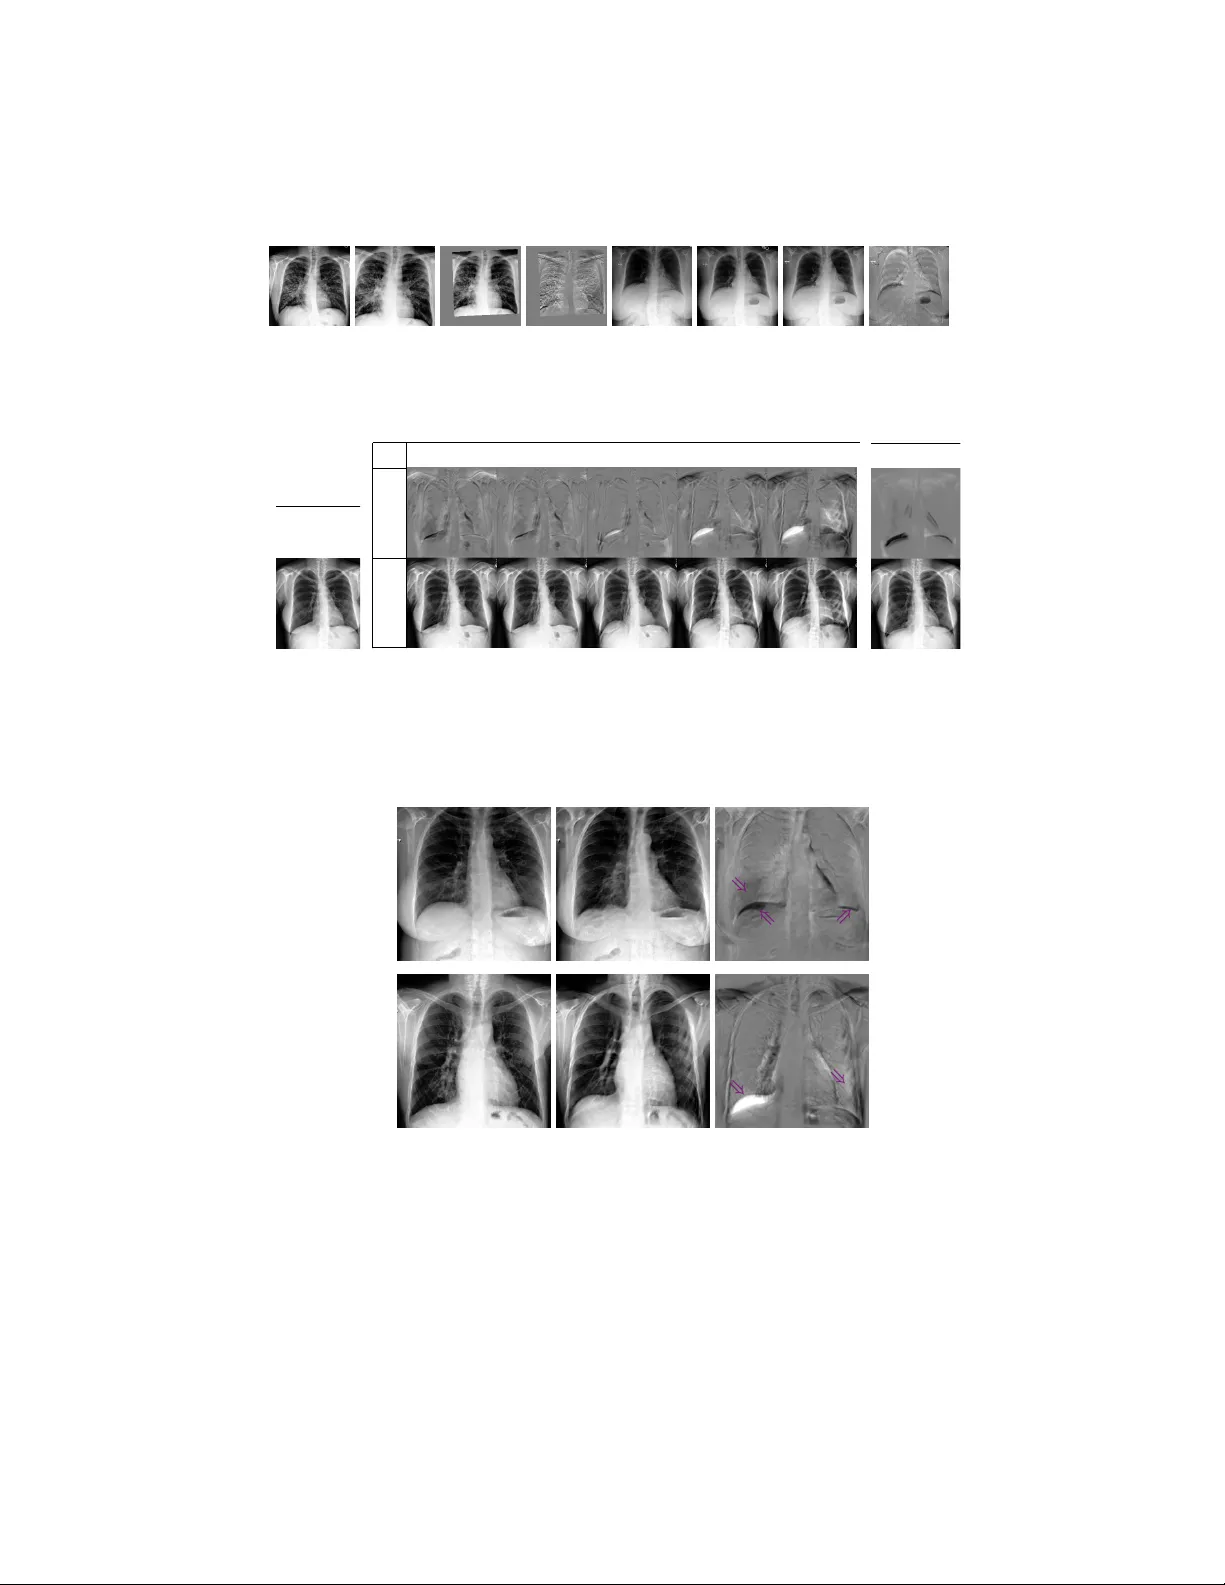
Adv ersarial regression training for visualizing the progression of c hronic obstructiv e pulmonary disease with c hest x-ra ys Ricardo Bigolin Lanfredi 1 [0000 − 0001 − 8740 − 5796] , Jo yce D. Sc hro eder 2 [0000 − 0002 − 7451 − 4886] , Clemen t V ac het 1 [0000 − 0002 − 8771 − 1803] , and T olga T asdizen 1 [0000 − 0001 − 6574 − 0366] 1 Scien tific Computing and Imaging Institute, Univ ersity of Utah, Salt Lake Cit y UT 84112, USA ricbl@sci.utah.edu 2 Departmen t of Radiology and Imaging Sciences, Univ ersity of Utah, Salt Lake Cit y UT 84112, USA Abstract. Kno wledge of what spatial elements of medical images deep learning metho ds use as evidence is important for model interpretabilit y , trustiness, and v alidation. There is a lack of such tec hniques for mo dels in regression tasks. W e propose a method, called visualization for regres- sion with a generativ e adversarial netw ork (VR-GAN), for formulating adv ersarial training sp ecifically for datasets con taining regression target v alues c haracterizing disease severit y . W e use a conditional generative adv ersarial netw ork where the generator attempts to learn to shift the output of a regressor through creating disease effect maps that are added to the original images. Mean while, the regressor is trained to predict the original regression v alue for the modified images. A mo del trained with this technique learns to provide visualization for how the image would app ear at differen t stages of the disease. W e analyze our metho d in a dataset of c hest x-rays asso ciated with pulmonary function tests, used for diagnosing chronic obstructive pulmonary disease (COPD). F or v al- idation, we compute the difference of tw o registered x-rays of the same patien t at different time points and correlate it to the generated disease effect map. The proposed method outperforms a tec hnique based on clas- sification and pro vides realistic-looking images, making mo difications to images following what radiologists usually observ e for this disease. Im- plemen tation code is av ailable at https://github.com/ricbl/vrgan . Keyw ords: COPD · chest x-ray · regression interpretation · visual at- tribution · adversarial training · disease effect · VR-GAN 1 In tro duction Metho ds of visual attribution in deep learning applied to computer vision are useful for understanding what regions of an image mo dels are using [1]. These metho ds improv e a mo del’s in terpretability , help in building user trust and v ali- date if the model is using the evidence h umans w ould expect it to use for its task. 2 R. Bigolin Lanfredi et al. They ha ve been mostly used to explain models in classification tasks. A common w ay of formulating the problem of visual attribution is by asking “What regions of the image are weigh ted p ositiv ely in the decision to output this class?”. This question is not suitable for regression tasks, for which we prop ose to ask “What w ould this image lo ok lik e if it had this other regression v alue?”. T o answ er the proposed question, w e draw from conditional generative adver- sarial netw orks (GANs) [10] and image-to-image GANs [7], b oth of whic h hav e b een shown to model complex non-linear relations b et ween conditional lab els, input images, and generated images. W e h yp othesize that using the regression target v alue for training a visual attribution model with the proposed no vel loss will improv e the visualization when compared to a similar formulation that only uses classification lab els since it does not lose the information of a con tin- uous regression target v alue by imp osing a set of classes. W e name our metho d visualization for regression with a generativ e adversarial netw ork (VR-GAN). W e study our mo del in the context of ho w a v alue c haracterizing c hronic obstructiv e pulmonary disease (COPD) is related to changes in x-ray images. COPD is defined b y pulmonary function tests (PFTs) [8]. A PFT measures forced expiratory v olume in one second ( F E V 1 ), which is the volume of air a patien t can exhale in one second, and forced vital capacity ( F V C ), whic h is the total volume of air a patient can exhale. A patient with F E V 1 /F V C ratio low er than 0.7 is diagnosed to ha ve COPD. Radiology provides a few clues that can b e used for raising suspicion of COPD directly from an x-ray [4]. There is a higher chance of COPD when diaphragms are low and flat, corresp onding to high lung v olumes, and when the lung tis- sue presents lo w-attenuation (dark, or lucent), corresp onding to emphysema, air trapping or v ascular pruning. W e sho w that our mo del highlights low and flat diaphragm and added lucency . Our metho d is, to the b est of our knowledge, the first data-driv en approach to mo del disease effects of COPD on c hest x-rays. 1.1 Related work One wa y to visualize evidence of a class using deep learning is to p erform back- propagation of the outputs of a trained classifier [1]. In [11], for example, a model is trained to predict the presence of 14 diseases in chest x-rays, and class activ a- tion maps [15] are used to show what regions of the x-rays hav e a larger influence on the classifier’s decision. How ev er, as shown in [2], these methods suffer from lo w resolution or from highlighting limited regions of the original images. In [2], researchers visualize what brain MRIs of patien ts with mild cognitiv e impairmen t would lo ok like if they developed Alzheimer’s disease, generating disease effect maps. T o solve problems with other visualization metho ds, they prop ose an adversarial setup. A generator is trained to mo dify an input image whic h fo ols a discriminator. The modifications the generator outputs are used as visualization of evidence of one class. This setup inspires our metho d. How ever, instead of classification labels, we use regression v alues and a no v el loss function. There hav e b een other w orks on generating visual attribution for regression. In [13], Seah et al. start by training a GAN on a large dataset of frontal x-rays, Adv ersarial regression training for visualizing COPD in chest x-ra ys 3 and then train an enco der that maps from an x-ra y to its latent space vector. Finally , Seah et al. train a small mo del for regression that receives the latent v ector of the images from a smaller dataset and outputs a v alue whic h is used for diagnosing congestive heart failure. T o in terpret their mo del, they backpropagate through the small regression mo del, taking steps in the latent space to reach the threshold of diagnosis, and generate the image asso ciated with the new diagnosis. The loss function w e pro vide for this task is similar to the cost function pro vided in [14]. Unlik e our formulation, [14] mo dels adversarial attack ers and defenders in a game theoretic sense and arrives at an optimal solution for the defenders, using only linear mo dels and applying it to simple features datasets. In [3], Bazrafk an et al. prop ose a metho d for training GANs conditioned in a con tinuous regression v alue. How ev er, the mo del has a discriminator in parallel with the regressor, it is not used for visual attribution, and the used loss function is differen t than the one we prop ose. 2 Metho d 2.1 Problem Definition W e wan t to generate what an image w ould lo ok like for different levels of a regression target v alue, without changing the rest of the conten t of the image. T o formalize this mathematically , w e can mo del an image as x = f ( y , z ), where x is a dep enden t v ariable represen ting an image, y is an indep enden t v ariable that determines an asp ect of x , and z another indep enden t v ariable represen ting the rest of the conten t. In our application, x is an x-ra y image, y is the v alue from a PFT of the same patien t taken con temp oraneously to the chest x-ray appro ximating the sev erity of COPD for that patient, and z represents factors suc h as patient anatom y unrelated to COPD and p osition of the b ody at the momen t the x-ray was taken. W e w ant to construct a mo del that, giv en an image x associated with a v alue y and a conten t z , can generate an image x 0 conditioned on the same z , but on a differen t v alue y 0 . By doing this, we can visualize what impacts the change of y to y 0 has on the image. Similar to [2], w e formulate the mo dified image as x 0 = ∆x + x = G ( x, y 0 , y ) + x, (1) where G is a conditional generator, and ∆x is a difference map or a disease effect map. By summing ∆x to x , the task of G is made easier, since G only has to mo del the impact of changing y to y 0 , and the conten t z should b e already in x . 2.2 Loss function Fig. 1 shows the loss terms that are defined in this section and how the mo dules are connected for training a VR-GAN. W e start by defining a regressor R that has the task to, giv en an image x , predict its y v alue. W e start building our loss 4 R. Bigolin Lanfredi et al. Losses for G Losses for R G R R x y =0.72 y ’ =0.42 L Rx L Rx ’ L Gx ’ y ’ Δ x x ’ y L REG Real: Desired: Fig. 1. Ov erall mo del architecture for training with the proposed adv ersarial loss. The losses L Rx , L Rx 0 and L Gx 0 are L 1 regression losses, and L RE G is an L 1 norm p enalt y . function by defining a term, which is used to optimize only the weigh ts of R , to assure R can p erform the task of regression ov er the original dataset: L Rx = L Rx ( x, y ) = k R ( x ) − y k L 1 . (2) The regressor is used to assess how close to having y 0 an image x 0 is. W e also define a term, which is used to optimize only the weigh ts of G , to mak e G learn to create a map ∆x that, when added to the original image, changes the output of R to a certain v alue y 0 : L Gx 0 = L Gx 0 ( ∆x + x, y 0 ) = k R ( G ( x, y 0 , y ) + x ) − y 0 k L 1 . (3) T raining a model using only these tw o terms w ould lead to an R that do es not depend on G , and, consequen tly , to a G that can modify the output of R in simple and unexpressiv e wa ys, similar to noisy adversarial examples [5]. W e define an adv ersarial term, which is used to optimize the w eights of R , to make R learn to output the same v alue as the original image for the mo dified image: L Rx 0 = L Rx 0 ( ∆x + x, y ) = k R ( G ( x, y 0 , y ) + x ) − y k L 1 . (4) As G learns trivial or unrealistic modifications to images, R learns to ignore them due to Eq. (4), forcing the generator to create more meaningful ∆x . This game b et w een G and R should reach an equilibrium where G produces images that are realistic and induces the desired output from R . At this p oin t, R should not b e able to find mo difications to ignore, b eing unable to output the original y . In our formulation, R replaces a discriminator from a traditional GAN. W e define another loss term to assure that G only generates what is needed to mo dify the lab el from y to y 0 and do es not mo dify regions that would alter z . An L 1 penalty is used o ver the difference map to enforce sparsity: L RE G = L RE G ( ∆x ) = k ∆x k L 1 . (5) In tuitively , when the modifications generated by G are unrealistic and ignored b y R , not having any impact to the term defined in Eq. (3), the norm p enalt y defined in Eq. (5) should enforce their remo v al from the disease effect map. Adv ersarial regression training for visualizing COPD in chest x-rays 5 The complete optimization problem is defined as G ∗ = argmin G ( λ Gx 0 L Gx 0 + λ RE G L RE G ) , R ∗ = argmin R ( λ Rx 0 L Rx 0 + λ Rx L Rx ) , (6) where the λ ’s are h yp erparameters. Optimizations are performed alternatingly . 3 Exp erimen ts W e used a U-Net [12] as G . The conditioning inputs y and y 0 , together with their difference, were normalized and concatenated to the U-Net b ottlenec k la y er (Fig. 1). F or R , we used a Resnet-18 [6], pretrained on ImageNet and with the output c hanged to a single linear v alue. W e froze the batc h normalization parameters in R , as in [2]. Since R depends on the sup ervision from the original regression task, it will only b e able to learn to output v alues in the range of the original y . Therefore, during training we sampled y 0 from the same distribution as y . The hyperparameters were chosen as λ Gx 0 = 0 . 3, λ RE G = 0 . 03, λ Rx = 1 . 0, λ Rx 0 = 0 . 3, using v alidation o ver the toy dataset presen ted in Section 3.1. The same set of hyperparameters were used for the x-ray dataset and were not sensitive to change of dataset. Adam [9] was used as the optimizer, with a learning rate of 10 − 4 . T o prev ent ov erfitting, early stopping was used. W e employ ed the V A-GAN metho d presented in [2] as a baseline, since it is a classification version of our metho d 3 . W e used λ = 10 2 and gradient p enalt y with a factor of 10, as in [2]. Baseline optimizers and mo dels were the same as the ones describ ed for our mo del. W e compared the results visually to chec k if they agreed with radiologists’ ex- p ectations. F or quan titativ e v alidation, we used the normalized cross-correlation b et w een the generated ∆x map and the exp ected ∆x map, av eraged ov er the test set. Each result is given with its mean and its standard deviation o ver 5 tests, with training initialized using distinct random seeds. 3.1 T o y dataset T o test our mo del, we generated images of squares, sup erimposed with a Gaus- sian filtered white noise and with a resolution of 224 × 224. An example is pre- sen ted in Fig. 2(a). The side length of the square is prop ortional to a regression target y that follows a W eibull distribution with a shap e parameter of 7 and a scale parameter of 0 . 75. The class threshold for our baseline mo del [2] w as set at 0 . 7. It was trained to receive images of big squares ( y ≥ 0 . 7), and output a difference map that made that square small ( y < 0 . 7). W e generated 10,000 im- ages for training. Since we generated the images, we could ev aluate with p erfect ground truth for ∆x . W e ev aluated using input examples where y ≥ 0 . 7 and sampling y 0 < 0 . 7 from the W eibull distribution. This resulted in 5,325 images for v alidation and 5,424 images for testing. 3 Our implementations of V A-GAN and VR-GAN extends co de from github.com/ orobix/Visual- Feature- Attribution- Using- Wasserstein- GANs- Pytorch 6 R. Bigolin Lanfredi et al. x ( y = 0 . 79) (a) y 0 ∆ x x 0 0 . 59 0 . 69 0 . 79 0 . 89 0 . 99 (b) V A-GAN (c) Fig. 2. Results on a test example from the toy dataset. T op: difference maps ∆x . Bottom: images of squares, x or x 0 . (a) Original image x , with square size y = 0 . 79. (b) VR-GAN result for sev eral desired square side lengths y 0 . (c) V A-GAN result. Examples of difference maps and modified v ersions of the original image for a few levels of the desired square side length are presen ted in Fig. 2(b). While the baseline presents a fixed mo dification for an image, sho wn in Fig. 2(c), and can only generate smaller squares, our method can generate different levels of c hange for the map, and also generate both bigger and smaller squares. The baseline [2], using V A-GAN, obtained a score of 0 . 780 ± 0 . 007 for the normalized cross-correlation, while our metho d, VR-GAN obtained a score of 0 . 853 ± 0 . 014. 3.2 Visualizing the progression of COPD W e gathered a dataset of patien ts that had a chest x-ra y exam and a PFT within 30 days of each other at the Universit y of Utah Hospital from 2012 to 2017. This study was p erformed under an approv ed Institutional Review Board pro cess 4 b y our institution. Data w as transferred from the hospital P ACS sys- tem to a HIP AA-compliant protected en vironment. Orthanc 5 w as used for data de-iden tification b y removing protected health information. Lung transplan ts patien ts were excluded, and only p osterioran terior (P A) x-rays w ere used. PFTs w ere only asso ciated with their closest x-ray exam and vice-v ersa. F or v alidation and testing, all sub jects with at least one case without COPD (used as original image x ) and one case with COPD (used as desired mo dified image x 0 ) were selected, using COPD presence as defined by PFTs. This setup w as chosen b e- cause the trained baseline mo del can only handle transitions from no disease to disease. F or each of these sub jects, we used all com binations of pair of cases with distinct diagnoses. The av erage time b et ween paired exams was 17 mon ths. W e used 3,414 images for training, 208 pair of images for v alidation and 587 pair of images for testing. Images were cropp ed to a centered square, resized to 256 × 256 and randomly cropp ed to 224 × 224. W e equalized their histogram and normalized their individual intensit y range to [-1,1]. W e used F E V 1 /F V C 4 IRB 00104019, PI: Schroeder MD 5 orthanc- server.com Adv ersarial regression training for visualizing COPD in chest x-rays 7 (a) (b) (c) (d) (e) (f ) (g) (h) Fig. 3. Examples of results of the alignment. (a) and (e): Reference images without COPD. (b) and (f ): Images to align, with COPD. (c) and (g): Aligned images. (d) and (h): Difference b et w een reference and aligned images, used as ∆x ground truth. x ( y = 0 . 72) (a) y 0 ∆ x x 0 0 . 52 0 . 62 0 . 72 0 . 82 0 . 92 (b) V A-GAN (c) Fig. 4. Results on a test example of the COPD dataset. T op: disease effect maps ∆x . Bottom: chest x-rays, x or x 0 . (a) Original image x , with F E V 1 /F V C ( y ) 0.72. (b) VR-GAN results for sev eral desired F E V 1 /F V C ( y 0 ). The lo wer this v alue, the more sev ere the disease. (c) V A-GAN results. (a) x 0 x ∆ x ⇒ ⇒ ⇒ (b) ⇒ ⇒ Fig. 5. Examples of disease effects that corresp ond with visual feature c hanges expected radiologically . In ∆x , gra y represents no c hange, blac k a decrease and white an increase in image intensit y . F rom left to right: original image x , mo dified image x 0 and disease effect map ∆x . (a) y = 0 . 8 to y 0 = 0 . 4 (increasing severit y). Purple arro ws highligh t flat and low diaphragm (b ottom tw o arrows) and added lucency (top left arrow). (b) y = 0 . 37 to y 0 = 0 . 8 (decreasing severit y). Purple arrows highlight high and curved diaphragm (left arrow) and reduced lucency (right arro w). 8 R. Bigolin Lanfredi et al. as the regression target v alue y . T o generate ground truth disease effect maps, w e aligned tw o x-ra ys of the same patient, using an affine registration employing the p ystackreg library 6 , and subtracted them. Examples are sho wn in Fig. 3. Disease effect maps and mo dified images for b oth metho ds are presented in Fig. 4. Note that our metho d can mo dify images to increase and decrease sev erity b y an y desired amount in con trast to [2], whic h can only b e trained to modify the classification of images in a single direction. In Fig. 5, we sho w images generated using VR-GAN which highlight the heigh t and flatness of diaphragm and show c hanges in the level of lung lucency , features that radiologists use as evidence for COPD on chest x-ra ys. Small changes in the cardiac contour are consistent with the accommo dation of a shift in lung volume. Using normalized cross-correlation, V A-GAN obtained a score of 0.012 ± 0.015, while VR-GAN obtained a score of 0.127 ± 0.017. The low correlation scores may result from imperfect alignments with affine transformations and p oten tial changes b et ween x-ra y pairs unrelated to COPD. Ho wev er, our metho d still obtained a significantly b etter score. 4 Conclusion W e in tro duced a visual attribution method for datasets with regression tar- get v alues and v alidated it for a to y task and for c hest x-rays asso ciated with PFTs, assessing the impact of COPD in the images. W e demonstrated signifi- can t improv emen t in the disease effect maps generated by a mo del trained with adv ersarial regression when compared to a baseline trained using classification lab els. F urthermore, the generated disease effect maps highlighted regions that agree with radiologists’ exp ectations and pro duced realistic images. References 1. Ancona, M., Ceolini, E., ¨ Oztireli, C., Gross, M.: T ow ards b etter understanding of gradien t-based attribution metho ds for deep neural netw orks. In: ICLR (2018) 2. Baumgartner, C.F., Ko c h, L.M., T ezcan, K.C., Ang, J.X.: Visual feature attribu- tion using W asserstein GANs. In: CVPR (2018) 3. Bazrafk an, S., Corcoran, P .: V ersatile auxiliary regressor with generative adversar- ial netw ork (V AR+GAN). arXiv preprin t arXiv:1805.10864 (2018) 4. F oster, W.L., et al.: The emphysemas: radiologic-pathologic correlations. Radio- Graphics 13 (2), 311–328 (1993) 5. Go odfellow, I., Shlens, J., Szegedy , C.: Explaining and harnessing adv ersarial ex- amples. In: ICLR (2015) 6. He, K., et al.: Deep residual learning for image recognition. In: CVPR (2016) 7. Isola, P ., Zh u, J., Zhou, T., Efros, A.A.: Image-to-image translation with condi- tional adversarial netw orks. In: CVPR (2017) 8. Johnson, J.D., Theurer, W.M.: A step wise approach to the interpretation of pul- monary function tests. American family ph ysician 89 5 , 359–66 (2014) 9. Kingma, D.P ., Ba, J.: Adam: a method for sto c hastic optimization. In: ICLR (2015) 6 bitbuc ket.org/glic htner/p ystackreg Adv ersarial regression training for visualizing COPD in chest x-rays 9 10. Mirza, M., Osindero, S.: Conditional generative adv ersarial nets. CoRR abs/1411.1784 (2014) 11. Ra jpurk ar, P ., Irvin, J., et al.: Chexnet: Radiologist-lev el pneumonia detection on c hest x-ra ys with deep learning. CoRR abs/1711.05225 (2017) 12. Ronneb erger, O., Fisc her, P ., Brox, T.: U-Net: Con v olutional netw orks for biomed- ical image segmentation. In: MICCAI (2015) 13. Seah, J.C.Y., et al.: Chest radiographs in congestive heart failure: Visualizing neu- ral netw ork learning. Radiology 290 (2), 514–522 (2019) 14. T ong, L., et al.: Adv ersarial regression with multiple learners. In: ICML (2018) 15. Zhou, B., Khosla, A., Lapedriza, ` A., Oliv a, A., T orralba, A.: Learning deep features for discriminative lo calization. In: CVPR (2016)
Original Paper
Loading high-quality paper...
Comments & Academic Discussion
Loading comments...
Leave a Comment