Automatic phantom test pattern classification through transfer learning with deep neural networks
Imaging phantoms are test patterns used to measure image quality in computer tomography (CT) systems. A new phantom platform (Mercury Phantom, Gammex) provides test patterns for estimating the task transfer function (TTF) or noise power spectrum (NPF…
Authors: Rafael B. Fricks, Justin Solomon, Ehsan Samei
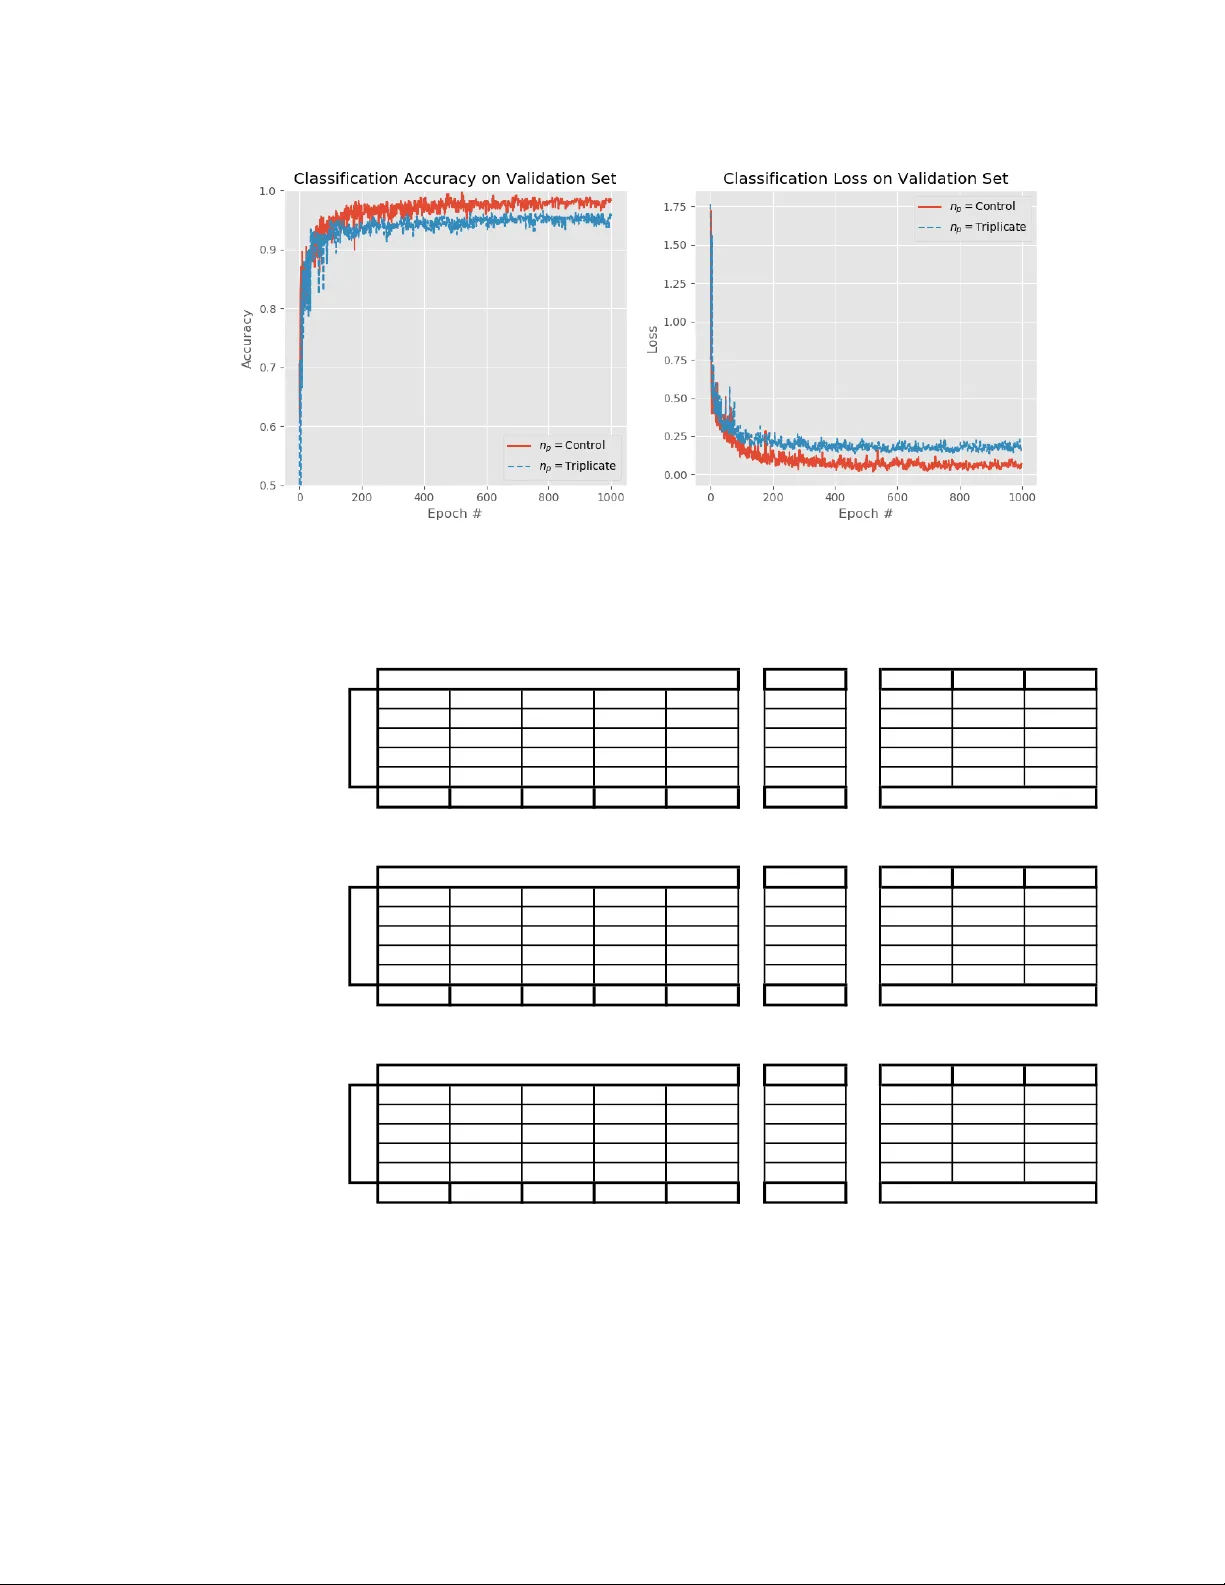
Automat ic phanto m test pattern classificati on thr ough tr ansfer learning w ith deep neur al netw orks Rafael B . Fricks a ,b , Justin Solom on b , Ehsan Samei b a Department of Veterans Affairs, Durham VA Medica l Center , 508 Fulton St , Durham , NC , USA 27705; b Duke University, Carl E. Ravin Advanced Imaging Laboratories , 2424 Erwin Rd , Durham , NC, USA 27705 ABSTRACT Imaging ph antoms are t est patt erns us ed to m easure imag e qu ality in comput er to mogr aphy ( CT) sys tems. A new ph antom platform (Mer cury P hant om, Gamm ex) pr ovides t est pa tterns for estimat ing the task transf e r function ( T TF) or noise power spectrum (NPF) and simu lates differ ent patient si zes . Determin ing which image slices are su i table for analysis currently requires manua l annotation of these patter ns by a n e xpe rt , as subtl e def ects may make an image unsui table for measuremen t. We propos e a method of autom atically classifying these test patterns in a series of phantom images using deep lear ning tech niques. By a dapt ing a convolu tional neural network based on the VGG19 architect ure with weights trained on ImageNet, we use transfe r learning to produce a cla ssifier for t his domain. T he class ifier is train ed and evalu ated with ov er 3,500 phantom images acquired at a university me dical cent er. Inpu t channe ls for color images are suc cessfully adapted to convey cont e xtual info rmation for ph antom image s. A series of abl ation studi es are employ ed to ver ify design aspects of the classif ier and evaluate its p erform ance und er v aryin g training condi tions. Our solution makes extens ive use of imag e au gmentat ion to produc e a c lassifi er that accu rately cla ssi fies typ i cal ph antom i mag es wit h 98% a ccur acy, wh i le maintain ing as mu ch as 86% accuracy wh e n th e phantom is improp erly im aged. Keywords: Conv olution al N eural Networks, Dee p Learning , Transfer Learnin g, Image Classif ication , Computer Vision, Physics of M e dical I maging, Noise Powe r Spec trum, T ask Transfer Fun ction 1. INTRODU C TION The Mercury phant om (Gam mex) is a test object for a ssuri ng image quality by measur ing prop erties of a co mmerci al comput ed tomography ( CT) syste m such as its task transf e r function (TTF) or no ise power spectrum (NPS) (Fig ure 1A) 1 . It prov ides embedde d test p atterns for quan tifying these imaging system properti es in scann e rs (Figure 1B) . Curren tly, using the phanto m requires an op erator to m anually annotate t he l ocations of t est patterns in a series of axia lly acquired images . While som e patterns are ea s ily disti nguished , manua l a nnota tion is still required as sub tle distinctions may mak e an image uns uit able (Figure 2) . Ma nual annot ations are t ime-consum ing, suffe r fro m inter-re ader va riab ility, an d may l ead to discardi ng useable phan t om ima ges. This study aims to automate the image a nnot ation process usi ng deep learn ing methods for imag e classifi cation. A vari ety of computer vision tasks have been succ essfully au tomated via deep learn ing approach es 2 – 12 . The effectiv eness of a deep learning appro a ch to a novel pro blem is typically limited by t he data and compu tational pow er available . Transfer learning techniqu e s gre atly acceler ate image classif ier training by reusin g pretrain ed neural networks 11,13 . Pr etrained classifi ers such as VGG19 12 ben efit from training on ov er 14 million natural imag es i n ImageNet 14 . Phan tom im aging introduces unique consider ations for transf e r learn ing. The n atural i mages in Imag eNet are typic ally uncorrelated images , photograph ed with three channels of color informa tion. Unli ke natural images , the phantom images acquir ed through CT are monoc hrome . The seria l a cquisi tions produc e hi ghly correlate d neighbori ng images, and indeed experts rely on local context i n labeling the s lices . For instanc e, tapered section s are c ompos e d of the s ame ho mogenous mat erial a s NP S measuremen t patt erns, however unlik e tapered sections the NPS section dia meter rem ains cons tant for th e length of a n NPS t est patt ern segm e nt (F igure 1) . Simil arly, ai r gaps and other artifacts that mak e tes t patterns unsu itable tend t o occur at m aterial in terfaces. Phanto m imag es do not r equire color chann els, but loc al context is inform ative. Another d istinction from n atural ima ges is that by d esign the phant om is a n invariant imaging target compos ed of d istinct geometric sh apes. M inor d ifferen ces in i m aging conditions in troduce vari ations — such as p hantom pos ition and alignm e nt or rec onstruct ed field-of-view — rather than the imaged obj ect. Differ ences in placing the ph antom with in the CT w ill axially shift t h e location and severi ty of air gap heli cal artifacts at differen t material interfaces. Misaligning the phantom with the scann er may rotate or wa rp slices in the imaging plane. Fina lly, chang es in th e reconstruc ted fie ld of view affects image scale. These varia tions may hypotheti cally be emul ated by im age augment ation entirely , w ithout the need for physical ly acquiring more represe ntative data. This w ork aims to produce a classifier that is insensiti ve t o mi salignments but consist ent in report ing air gaps or partial volumes. Our pr oposed solu tion appends one image in eith er direction as a three -channe l ima ge, a llowing for effe ctive re- use of well-establ ished ImageN et classif ication networks trained on three-chann el color images. Extensive augment ation is employe d to train a network to gene ralize for a varie ty of i maging co nditions . This stud y adapts training techniques for transfer le arning w ith imaging ph antoms , using t h e Mercury Phantom V3.0 1 as an examp le. Figure 1 . (A) Desig n rendering of a Mercury Phan tom w ith p ositio ning equipm ent. (B) Sagitta l r econ struc tion of a series of Mercu ry Phanto m im ages, a spect rat io adju sted f or visual ization . Around 114 images are acqu ired at 5 mm sli ce thickne ss using he l ical CT , wi th imag es reco nstructed to show app roxi mately 400 m m fie ld-of-v iew at 5 12x512 pixe l resol ution. Figure 2 . A xial images from a seri es of phanto m images. Slice 50 has homogenou s int erio r, con sistent wi th a no ise pow er spectru m (NPS) estima tion pat tern but is par t of a tapered se ction of the phanto m which serv es a diffe rent purpo se. Slice 51 captur es a t rans ition fr om the tapered section to the task t rans fer function (TTF) pattern, causing faint b lending in t he t es t pattern , and thus making it un suitable fo r TTF measur e men ts. Sl ice 52 is a sui table TTF pattern imag e. Lo cal axial conte xt is critica l for hu m an o bserve rs in m aking these asses smen ts. 2. METHODS 2.1 Phan tom Data Data for this study w ere drawn fro m testing patterns at a univers ity medica l c enter. Fifte en image series of t he Mer cury Phantom V3 .0 1 w ere dra w n fro m routin e clinic al physi cs t esting d ata a nd repres ented i ma ges fr om a v ariety of scann er models and at variable rad iation dose levels. Annotati ng these series yielded 3099 images of phant om slices. We divide d the images a t the series level into nine seri es for train ing (2409 imag es), three fo r a validation set (347 im ages), and thr ee for a test s et (343 ima ges) . Th ese s ets repres ent a rang e of typical pha ntom ima ging condit ions. T hese images w ere acquir ed at 400m m fi eld - of -view, with slice thicknesses of 5 mm. Each image in a series is la beled according to one of fiv e class es; 1) Outside Ph antom , 2) Noise Power Spectr um (NPS) pattern, 3) Task Transfer Fun ction (TTF) pattern , 4) Tapered Section , 5) Unsu i table (Air gap or par tial volum e pres ent ). F igure A1 depicts la bel ed images i n order from the t ra ining se t, with no sh uffling or augment ation (S ee App endix). An additiona l series w as acquired at a typical condi tions, yiel ding 458 annotat ed images of a m ercury phant om at obliqu e angles. We refer to this series a s the extreme test. This series is beyond the recommended use of the phantom and serv es as an eva luation s et for algori thm p erformanc e under misalignmen t (See App endix, Figu re A2) . 2.2 Pr eprocessing , Augmentat i on, and T ransfe r Learning In prepr ocessing, we window ed the CT images into the e mpi rically determin ed rang e of [-1024, 1187] Hou nsfield Units. Images w ere down-sample d from 16-bit unsigned int eger pixel intens ities at 512x512 reconstructed resolution , t o 8-bit unsigned integers at 256x256 resolu tion. E ach image was converted to a thre e -channel image by appending the previous and next imag e in the se ries axially. F or im ages at th e edge of th e a cquisit ion, t he ce ntra l i m age was repeat ed as necessa ry, i.e. the first image used a copy o f the first image as the ‘previ ous’ imag e. The th ree -chann el append ed forma t add ed axial context, a nd e ach resul ting input wa s l abeled according to the centra l image. To emulate mi salig nments during training, we a ugmen ted the imag es extensiv ely at runtim e. Au gment ations included vertical f lipping, horizont al flipping , applying rotations up to 90 degr ees , magnifica tion from 90% -110% image si ze, horizontal an d v ertical trans lations up 2 0% of the im age s ize. Additional augmenta tions such as a rando m brightn ess of up to 0.5% of pi xel intensity , and motion blurring using kerne ls between 3x3 and 7x7 were a lso applied randomly . Each of these a ugmentat ion e ffec ts wer e e nabl ed a t runtime on each input w i th 50% prob ability and applied b y a c ustom i mage generator us ing the A lbumen tations package 15 . Augment atio ns are app li ed to the tra ining set only . We employed the VGG 19 architectu re 12 with ImageNet w e ights 14 for convolu tional filters as a starting point. The output classifi cation la yers were repl aced by a two-layer pe rce ptron of t wo dens e la yers with channels each, followed by b a tch normaliza tion 16 prior to ReLU activation . D ense layer weight parameters wer e rando m ly initialized using H e i nitial ization . The number of c hanne ls in each dense layer was varied across the ra nge [256 , 512, 1024, 2048, 4096] to find an optim al choice. Th e percep tron ou tput feeds into a so ftmax activatio n for the fin al prediction, as pictu red in Fig ure 3 . Figure 3. T hree sequ entia l im ages are d own-sa mpled and con caten ated to p roduce the i nput. A series of conv olution and max pooling l ayers following the VGG 19 architect ure are applied to this input, with initial we ight s t rained on ImageN et . Convo lutional layer s are padded to return a same-size output. The final max pooling layer outpu t is fla ttened, then p assed through add ed dense layers w ith batch nor maliza t ion and ReLU activa tion. Last ly, applying a sof tmax activ ation yiel ds a classif ication predic tion fo r the central image in the inpu t. The mod el w as train e d for 1000 epochs at a batc h siz e of 32 . We us e d a n Ada m op timizer 17 (learni ng rate 0.00 1, = 0.9, = 0.999), epsilon of , with decay of 0.001. Categor i cal cross-entropy served as the loss funct ion. The model was generated a nd trained usin g Ker as mode l specif ication in Te nsorf low 18 2.0.0. We seede d rando m nu mber generators identica lly at the st art of training for each classifier . T rain ing and eva luation use d a singl e NVIDIA Titan RTX GPU, and took approxi mately 17 hours per model vari ant. Exa mple co de is ava ilable at ( bit .ly/PC-SPIE20 20 ). 2.3 C lassifier Eva luation At the conclusion of training, the model was used to classify the valid ation set, test set, and extreme test set. In each cas e we exa m ined the miscl assificatio n or confus ion matrix, a s well as evaluat e d the precision, recall, a nd F1 scor e for each classifi cation category. An over all class-weighted accuracy valu e is a lso calcul a ted and repor ted. These evaluat ion r esults were used to select an opti mal for this applicat ion, balancing classific ation perform ance and model s ize. 2.4 A blation Expe riments Several design choices reflect our unders t anding of the uniq ue challenges in thi s phantom imaging task. We perfor med a set o f ablation exp erim ents whic h modify t he model to ver ify the effec tiveness of sev e ral training d ecisions . Ex c ept w here noted, i n each sc enario the classifi cation m odel an d tra ining conditions wer e i dentica l t o the b aseline r e sult from evaluation, with fixed t o the op timum d etermine d in the e v aluation st ep. The perfor mance metrics (precision , rec all, and F1 sco re) were ev aluated on validati on, test , and extre me test data sets as befo re. 2.4.1 Transfer learning and random initialization Given the dissim ilarities betw een the photographs in ImageNet and x -ra y computed tomog raphy images of the M e rcury Phantom, transfe r l earning with a n atural imag e classifier may be less impactful t han expe cted. W e evalu ated the ut i lity of transfer learning fro m Ima geNet weights by c omp a ring tra ining perform ance t o an identica l m odel wher e c onvolu tiona l layer weig hts are r andomly initiali zed accordi ng to a normal distribution w ith zero mean an d unit var iance. 2.4.2 Axial info rmation th rough chan nels We assert that so me region al informatio n in the z di rec tion, refe rred to a s axial i n formation , contribu tes to classific ation accuracy . This a xial informati on is provided to the classifie r at runti me by a pp ending a previous and ne xt image to the classifi cation targe t, generating the t hree- channel inpu t . To verify this assertion, we train ed four vari ants of the class ifier, progressiv ely freezing convolution a l layer pa rameters and preventin g training up to the second max pooling layer . These variants are denot ed [f0, f1, … f4], wh ere f0 has no frozen layers (all param eters are trainabl e a s in the basel ine mode l) , f1 has the first convo lution al layer fro zen, an d f4 has t he firs t four co nvolutiona l layers froz en and un trainabl e. Additiona lly, we tra ined a variant of the f0 or baseline model wh e re the same imag e i s replicated in triplica te. Extending the ex ample in Figure 3, th e triplicate class ifier rec eives th ree cop ies of Sl ice 51 d a ta c onca tenated and m a kes a predictio n for Sli ce 51 based on this input . Trip licating the input maintains the same overall n umber of trainabl e para meters as in the baselin e case. 2.4.3 Augmentati on to emu late misal ignm ent Presuming t h e variabili ty between imaging sets arises from pos it ionin g rather t han changes i n the mercury phantom , we apply augmentat ion t o emulate subop timal positioni ng in a well -pos itioned t raining set. We compared the classific ation accuracy on the extr eme test s et of the baselin e model to a m odel trai ned wi thout augmen tation. 3 RESULT S We eva luate the model perform ance for training , validatio n, and te s t sets as the number of conne cted layer param eters is varied. We also e valuate the mode l e ffe ctiven ess at classify ing images from t he extreme test acquisition series. We then report results from ablation experi ments to probe the a bil ity of the classifier to 1) benef it from transfe r lear ning , 2) incorporate axial data, and 3) learn to g eneralize from aug mentation . 3.1 C lassifier Eva luation Examining the classificat ion a ccuracy on t he validation s et at each epo ch (Figur e 4), a ll fi ve model v ariants learn t o adequatel y class ify th e ph antom s lices in the va lidation set o ver the course of tr aining. The over laid p l ots show all mo dels converge at approxima tely 98% accur acy on this se t. Similar resu lts are seen when e valuat ing the c lassifica tion results post-train ing fo r the validation s et (see App endix, T abl e A1). All mode l var iants classif y the validation s et with 98% accuracy , e xcep t for the 4096 varian t whic h only achieves 97% accur acy. This high p aramet er c ount also seems to cau se mild overfittin g, indi cated by the larger fluctuatio ns in classification a ccuracy from one epoch to another (Fig ure 4) . The same fluc tuation is evide nt in the loss plot, although smal ler. There is overa ll no d istinguish ing differ ence in perfor mance on this s et, which i ndicates that is the optimal choice as it signifi cantly min imizes the mode l size (Table 1). Figure 4 . Mod el accur acy and lo ss on valida tion set , evalua ted at th e end of each tra ining epo ch . Lines ar e plotte d in revers e order of mo de l siz e, with first, ove r laid by prog ressive l y smal ler pa rame ter values . All mode l s app ear to ach i eve the sam e valid ation set ac curacy after approxi mate ly 400 e pochs , regard less of the nu mber of para meter s in th e dense layer s. Model s with signi fican tly more p aramet ers appea r to expe rience m ore overf itting , as seen b y the large variance s in accu racy in the 4096 model through the epoch s. Classifying the test set with the trained model yields similar results as t he validat ion set (Appendix Tabl e A2). This is to be expected as th e test a nd valid ation s e ts represen t s i milar imaging con ditions of a rela tively invar iant i maging target. Al l models achiev e 97% accura cy, excep t for the 256 variant wh ich now no tably a c hiev es 99% accu racy. There is no overall distinguish ing perf ormance . Finally , a pplying the model t o the extreme te st set sh ows a not able decreas e in c lassificat ion accuracy ( Appen dix Table A3). Variants w ith do not achieve 80% accuracy in this evalu ation. The 256 vari ant rea ches similar accuracy as th e 512 and 4096 varian ts (85% to 86% in the other two ). Examining the confusio n matrix close ly, however , we se e a distin ct p a ttern sep arating the 2 56 f rom the hi gher-parame ter v a riants . Th e 2 56 erro neous ly pl a ces s ever al a ir gap or partial volu me images (AGP) into the usabl e image c ategories . 512 and 4096 t end to balan ce errors wit h respect to the AGP ca tegory better, reducing t he overall number of unsuita ble images recomme nded. The 512 varian t provides overall consistent perfor m ance with p er -category precision a nd reca ll ab ove 0.80 i n most cases. The 51 2 model m aximiz es t he F1 score with the exc eption of AGP , where the 4096 variant is s lightly m ore effe ctive. Table 1 . Total numbe r of paramete rs as t he numbe r of chann els in the dens e layers ( /nP) is chang ed. Th e first dense laye r especi ally makes a multifold conn ectio n wi th every convo lutiona l output of the final poo ling laye r. As the num ber of chann els is increased , the share of to tal pa rame ters dev oted to the class ification layers b ecom es a major ity. In current practi ce it is not necessar y to use all avai lable phantom images to evalua te the CT system. Mult iple slices pr ovide additional or perhaps re dundan t measurem ents. Therefore, suggest i ng an unsui table image for us e is a far less desirabl e error i n this appli cation t han er roneously d iscardin g a su i tab le i mage. We elect to use dense layers with 512 c hann e ls in nP Total Num ber of Para m eters Parameters in Dense L ayers % Total 256 28,481,8 61 8,454,14 4 0.2968 512 37,070,4 05 17,039,3 60 0.4596 1024 54,640,7 09 34,603,0 08 0.6333 2048 91,354,1 81 71,303,1 68 0.7805 4096 171,072 ,581 150,994 ,944 0.8826 all subs equent te sts . It mini mizes parameters to th e second low est level studied, while achieving a favorabl e e rror prof ile compar able to the model with the most para meters. The effe ct of this par a meter on overa ll model size can be signif icant (Table 1) . The e xtreme test perfor m ance p roved fa r more i nforma tive than test or v alidation s ets, wh e re all mo dels classify standard im ages r easonabl y well. 3.2 A blation expe riments We proce ed with ablation experim ents based off t he model with . All variants use the architectur e i n Figure 3, and identical proce dures for training, except wh ere noted. We hi ghlight th e most informative resul ts of the s e experi ments . All experimen ts a re co m pared to a baseline control classif ier, which is the unmodifi ed 512-v a riant in the previ ous se ction. 3.2.1 Transfer learning and rand om initial ization Randomi zing the VG G1 9 parameters, r ather than us ing weights trained on I mageNet, results in a d elay in achievin g the previously reported perfor manc e maxima. The rando m ly initia lized mod el (RI) c onverg es approxi mately with the pretrained mod el (Contro l) in validation test accura cy after 600 epochs (Figure 5). A slight dec rease of 1% ac curacy i s noted in valid ation and test sets whi ch are classifi ed correctl y in 97% and 96% of cases , respectivel y. The extrem e test i s more inform ative, show ing m ore substan tial a ccur acy loss es (Table 2). ImageNet weights i mprov e accuracy in the misaligned phantoms t est ed . Und er normal im aging condi tions the accuracy di ffer ence is i ndiscern ible, although fe w er epochs are required to attain similar accur acy. Figure 5. Model accuracy and loss on val idation set, evaluated at the end o f each training ep och. He re the control m odel represen t s the 512 va riant mode l evaluated pre vious ly. In the RI model all para meters and ini tializ ation are iden t ica l t o the contro l, ex cept for t he VGG 19 convo lutiona l la yer pa rame ters. Ra the r than loadi ng pre -traine d Im ageN et wei ghts , we ights are rando m ly initia lized according to a nor mal distr ibution wi th zero mean and unit varian ce. RI m odel accu racy nearly converg es wi th the contr ol by 60 0 epochs , with a slig ht gap remain ing vis ible a fter 1000 traini ng epo chs in the loss pl ot. Table 2 . The rando mly in itialized model underper form s on the ex t reme test se t, notably faili ng to mar k image s wit h an ai r gap or partial volu me as unsui table images (AGP ). Ov erall perfo rmanc e on val idation and tes t sets, wh ich are simila r t o train ing sets , is unrem arkab le f rom t he eval uatio n vari ant, and not pictured here. The m odel is accurate o n pha ntoms with more op timal p lace men t , and erro r s fol low th e AGP misc lassifica t ion pa t tern s een p reviou sly. Extreme Test Set (RI) N Samples Precision Recall F1 Air Gap or Partial Volume (AGP) 126 46 0 24 9 205 0.77 0.61 0.68 Noise Power Spectrum (NPS) 5 74 0 0 0 79 0.57 0.94 0.71 Outside Phantom (OoP) 3 0 1 0 0 4 1.00 0.25 0.40 Task Transfer Function (TT F) 3 0 0 55 0 58 0.70 0.95 0.80 Tapered Section (TaS) 26 10 0 0 76 112 0.89 0.68 0.77 AGP NPS OoP TTF TaS TOT = 458 Truth Accuracy = 0.72 Confusion Matrix Metrics Prediction 3.2.2 Axial info rmation th rough chan nels We e mploye d two metho ds t o e xam ine t he mode l’s ability to incorpora te r e giona l infor m ation in th e axial d irection . In the first method s e veral variants of th e m odel wer e t rain ed with t he fi rst n co nvolutiona l layers frozen. I n model fn, t he nth convolut ional layer and all subs equen t layers’ weight va l ues were not upda ted in training. T he b aseline mode l f0 deno t es a model with no frozen layers and serves as a control. Mode l f1 f reez es the first layer, f2 the first and second, and so on until f4, which fre ezes the first four convolu tional layer parame ters from training . All convolution al layers are initialized with weights train ed on Im ageNe t. Freezing these early layers has little discernib le im pa ct on the accuracy of this classi fier. A m ild effect is no ted by examining the distribution of training a ccura cy o ver the sec ond half of train ing (Figure 6). Freez ing i nit ial layers progressiv ely results in apparen t underfit ting of the tr aining c ases which is only d etectib le as a drift of the mean accur acy when evalu ated aga inst the tra ining set. Accur acy drifts dow nwards by a pproxim ately 0 .5% in classify ing th e training se t as more layers are w ithheld from tr aining. We detect no sig nificant impac t on accuracy i n classify ing any independ ent evaluation sets compar ed to baseline. Figure 6 . B ox plots of accu racy and los s on the second hal f (last 500 e pochs) of t raining, eva luate d in c lassifying the t raining set at the en d of each epoch. While all var iations v ary across ap proxi mate ly t he same range of 98.5% accu racy to 96% accura cy, the mean accur acy s teadily decl ines as layers are frozen. Evaluatio n se ts show no chan ge i n a ccura cy . As a second method of inve s tigating how the model i ncorp o rates axial i nform ation , a triplicate model was trained w hich received replicas of the target image as i npu t. The t rip l icate model has the same param eter count, but less potenti al input information . In training w e clear ly see a persist ent redu ction of approx i mately 2% valida tion set ac curacy (Fig ure 7) . The accura c y loss in the triplicat e m odel is c onsis tent across all normal imaging conditio ns. Valida tion and t es t sets lose 2% and 3% overall accuracy respect ively (Tab le 3) . Intere stingly t he t ypes of e rrors made are on ly related to image unsuitabi lity (AGP ). Losing a xial informat ion exacerb ates t he pri mary mode of classif ication failure the b aseline m odel experienc ed. Expert l abelers look for air ga ps or p artial vo lumes near materi al interfaces. Axial inform ation a ppe ars to help in cla ssi fying these sub tle def ects. More p ronoun ced e ffects a re s een ag ain in th e extreme t est s et. The model s truggles to l abel unsu i table AGP images when classifyin g with triplicates. Also in this set a new mode of fai lure becomes appar ent; the m issing axia l contex t c auses tapered s ections to be in correctly classifi ed as NPS test patter ns in the extr eme test . NPS s egments in t he mercury phantom are co mposed of t he s ame material a s TaS but main tain a cons tant d iameter for the length of e ach NPS seg ment. When presented with axial imag es there i s a detec tible progress ion of phanto m diameters that indicat es a tapered sect ion. Similarly , there is a consisten t order to t he test patterns; TTF patterns precede NPS segments, wh ich preced e TaS segments , which are follow e d by a new TTF segment. These associat ions are l ost without the preceding a nd succeed ing ima ges. Losing k ey axial infor m ation ap pears to cause mis classifi cations of TaS slic e s as NPS p atterns. Figure 7 . Comp arison o f the o riginal mode l (contro l ) to a model th at rec eives the sa me ima ge in tri plicat e. Plot s show m o del accura cy and loss on vali dation set , e valua ted at the end of each traini ng epoch . Wh ile both models converge t o a steady accura cy range , there is a d iscernib le o ffset of approx ima tely 2 % accura cy loss wh en ax ial in format ion is not ava ilable. Table 3 . Confusion matrix and per-class metric s evaluat ed by classif ying the ev alua tion s ets wi th the tr iplicat e model. Tripl icating the i npu t , rath er than provid ing context images , produ ces a classi fier wi th an iden tical param eter count but les s axial infor mation . La cking tha t inf ormation sl ightly increas es error s in the pro perly imag ed v alidat ion a nd test s ets. The re are more er rors in cl assifyi ng image s that do o r do not have air gaps or par tial vo lumes, but no new type of er ror. In th e extre m e test s et, we see difficulty in distingui shing tape red sect ions (TaS) fro m noi se p ower spe ctru m pa tterns ( NPS ) . Axi al informa tion is key in d etect ing this dif feren ce, which can be indica ted by m ore subtle associa tions such as the order of test patterns . Val id ati on Set (Tripl ica te) N Samp les Precision Recall F1 Air Gap or Par tial Volume (AGP ) 69 0 0 2 2 73 0.86 0. 95 0. 90 Noise Pow er Spectrum (NPS) 2 84 0 0 0 86 1.00 0. 98 0. 99 Outside Phan tom (OoP ) 0 0 6 0 0 6 1.00 1. 00 1. 00 Task Tr an sfe r Function (TT F) 4 0 0 65 0 69 0.97 0.94 0. 96 Tapered Section (TaS) 5 0 0 0 108 113 0.98 0. 96 0. 97 AGP NPS Oo P TTF TaS TOT = 347 Test Set (Trip lic ate ) N Samp les Precision Recall F1 Air Gap or Par tial Volume (AGP ) 63 4 0 3 3 73 0.86 0. 86 0. 86 Noise Pow er Spectrum (NPS) 6 78 0 0 0 84 0.95 0. 93 0. 94 Outside Phan tom (OoP ) 0 0 3 0 0 3 1.00 1. 00 1. 00 Task Tr an sfe r Function (TT F) 2 0 0 66 0 68 0.96 0.97 0. 96 Tapered Section (TaS) 2 0 0 0 113 115 0.97 0. 98 0. 98 AGP NPS Oo P TTF TaS TOT = 343 Extr em e T est Set (Trip li cat e) N Samp les Precision Recall F1 Air Gap or Par tial Volume (AGP ) 147 25 0 23 10 205 0.92 0. 72 0. 81 Noise Pow er Spectrum (NPS) 8 71 0 0 0 79 0.66 0. 90 0. 76 Outside Phan tom (OoP ) 0 0 4 0 0 4 1.00 1. 00 1. 00 Task Tr an sfe r Function (TT F) 2 0 0 56 0 58 0.71 0.97 0. 82 Tapered Section (TaS) 2 12 0 0 98 112 0.91 0.88 0.89 AGP NPS Oo P TTF TaS TOT = 458 Truth Accuracy = 0.82 Prediction Truth Accuracy = 0.94 Con fu sion Matri x Metr ics Prediction Con fu sion Matri x Metr ics Prediction Truth Accuracy = 0.96 Con fu sion Matri x Metr ics 3.2.3 Augmentati on and th e extre me test set We postul ate that little variab ility arises from the phanto ms, which are d esigned t o ser ve a s c alibrat ion patterns for C T systems . To v e rify thi s clai m, in the noAug model augmentati on is disabled du ring tr aining. P lotting th e accuracy an d loss on the validation set a fter each epoch (F igure 9), the noAug perform ance is r emarkably sm oother as there is fewe r vari ation to learn, and the unaugmen ted t rain ing set is hi gh ly s i milar to the valida tion set. There appears to be slight overfittin g to the unaugment ed set, a s an a ccuracy maximum is det ectible a t approx imately 100 epochs, and a subs equent di p of approxim ately 2% accura cy. E val uated perfo rmance aft er training is comp arable to the con trol model, w ith classifica tion accuracy on the validat ion and t es t sets at 96% and 97 % respectively. The t raining set i s represent ative of M ercury Phantoms imaged in correc t alignmen t, as ar e the val idation and test sets . Figure 8 . The ef fect of aug ment ation on training per formance , d epic ted by plot ting model a ccurac y and loss on v alidat ion s et evalua ted at the end of e ach training epo ch. Accu racy is similar w ithout aug mentat ion, though slight ly d iminis hed. There is a distinc t smoothne ss to valid ation accu racy fro m one epo ch to ano ther, as very litt le variat ion rema ins in the t raining s et without augmen tation . The classi fier begins to over fit a standar d se ries of mercu ry ph anto ms. When e valu ated against misaligned phanto m sets, there is a dramatic drop in accu racy. Table 4 shows t he prev i ous classifi cation r esults on t he extreme test se t with a mode l t rai ned wi th augm entation (Aug) as a control, a longsid e classifi cation results for the non -aug mented m odel . Withou t augment ation, the model does not r ecognize p atterns in the misaligned phan tom, failing to correct ly classify any outside phant om (OoP) or tapered section (TaS) images. The out of phantom label is o mitted entirely. TTF p atterns are most c learly identifi ed, w ith the highes t ov erall rec all an d F1 s core. From re call, we se e t hat 91 % of TTF patterns are cor rectly ident ified. An inab ility to identif y unsuitable qualities in the i mages causes 20 unsuita ble air gap or partial v olume (A GP) s lices to be classified as TTF p atterns , causi ng a drop in prec ision for that catego ry. On exa mination these a ppear to be unsuitable TTF im ages, sugg esting that the mod e l c a nnot d istinguish TTF suita bility when the ph antom is misalign ed. The model classifies most images as NPS p atterns. Many AGP slices may be unsuitabl e NPS patterns , howev er t he ratio of AGP vs NGP classif ications follows roughly w ith the pre valence of those pat terns, implying no clear disti nction . The noAug model does not clearly discrimin ate between these two categories when the phant om is misaligned . Furthermore , all TaS slic es are incorrectly classifi ed as NPS patterns. TaS and NPS segments a re composed of the same material , and should be similarl y radiopaq ue when im aged by a CT system. When imaged at an obliqu e a ngle , NPS slic es may a ppea r slightly ov al, as the NPS cylind er is n ow in tersected b y th e i maging plane at a slant ed a ngle . A slig ht slope seen at the edge of an NPS pattern may the refor e b e indist inguishab le from the sligh t slope expected in a tapered section. Without experienc ing these artifacts at training ti me, th e model classifies al l TaS sli ces as NPS slic es. Overall the m odel is unable to classify misalign ed phantoms withou t training on aug m ented sa mples. While perfor manc e on standard phantom images is comparab le to t he prev ious result, a model trained without augmen tation i s sensit ive to imaging conditions and pha ntom align m ent. It do es not generali ze to the misalign ed case . Table 4 . C onfusion matrice s and metrics for the con trol model, tra ined w ith au gmen tation (Aug) , and the exper im ental variant trained witho ut aug m enta tion (no Aug). Th ere is a pronoun ced drop i n accur acy in c lassify ing this s et whe n no aug menta tion is used to regu l arize the ph anto m classifie r. Af ter an equival ent training period, the noAug var iant is un able to class ify the extre me tes t set acc urat ely, ev en und erper forming a trivial sys tem that gues s es the mos t frequ ent cat egory . 4 DISCUSSION The nee d for manual annota tions is one barrier to wider use of quality con trol instruments su ch as the M ercury phanto m. Automat ed test patt ern annot ation greatly reduces the time spent labelin g i mag es and standardi z es t h os e labels . In our experienc e this probl em h as elud ed a s olut ion through m ore tr aditional i mage process ing m ethods due larg ely to the sub tle and difficult- to - a rticula te f eatures that ma k e a n image unsuit able f or measurem ent. An operator require s some expertise to consist ently se lect t he i dea l images for es timating CT sys tem imaging c hara cteristics . The deep learning approa ch presented here agrees with exp ert an notation in a major ity of cas es and is robust to improper position i ng , even tolerating the exagg erated misplace ment in the extr eme t est set. A limita tion of this study was t he time required for manual annota tions. Large libraries of images on t hese phant om s are availabl e at medical cent ers that regular ly conduct the s e quality assuran ce measurem ents. Th e 3,557 images in total used in t h is study are a rel atively smal l data set comp ared to stand a rds such as Im a geNet but requ i re a signific ant read er effort to label. Multiple readers would fac ilitate the use of a larger data set while allowing some evaluation of inter - a nd intra- reader variability . Given the small margin of error achieved by this model on standar d data sets, it i s wor th i nves tigating whether e xperts agree as frequentl y as 98%, or if the model emulates the original reader too c los ely. If the readings are repeatabl e, the model para meterized he re may b e effective f or a uto matically labeling larg e r data sets for furth e r model training and evalu ation via sem i-supervised learnin g. Although w e w ere ab l e t o train s everal c omput ationally in ten sive mod e ls, w e stil l imposed som e limitations on the va riety of p arameter m odifi cations a nd metrics repor t ed. Wher ever pos sible, training p arameters were consist ent, and metr ics were simplified t o enable dire ct co mparisons as often as poss ibl e. We acknowl edge tha t in some situ ations a mo del vari ant m ay have be en fu rther op t imi zed. For instance, the vari ation wi thout augmen t ation may h ave benefi tted fro m early st opping or some other form of redu ced train ing to avoid o verfitting 13 . Th at particular case wou ld compli cate co mparisons by swa pping one form of regu larizat ion for anoth er. Simil arly, the a ccur acy deficit in the random i niti alization mod el’s e valuatio n o f the extreme test s et may have been ov ercome with additiona l training . We also do not adjus t other training hyperparam e ters, such a s the choice of optimi zer, assoc iated paramet ers, loss funct ion, or batch size 19,20 . No study c an truly enc omp ass a l l t he avai lable training v a riations , r ather w e choos e a su bset tha t ma y giv e insight into wh at i nforma tion the mode l is incorpora t ing. Extr em e T est Set (Au g) N Samp les Precision Recall F1 Air Gap or Par tial Volume (AGP ) 173 11 0 19 2 205 0.84 0.84 0.84 Noise Pow er Spectrum (NPS) 13 66 0 0 0 79 0.86 0.84 0. 85 Outside Phan tom (OoP ) 2 0 2 0 0 4 1.00 0.50 0.67 Task Tr an sfe r Function (TT F) 0 0 0 58 0 58 0.75 1.00 0.86 Tapered Section (TaS) 19 0 0 0 93 112 0.98 0.83 0.90 AGP NPS OoP TTF TaS TOT = 458 Extr em e T est Set (n o Aug) N Samp les Precision Recall F1 Air Gap or Par tial Volume (AGP ) 61 121 0 20 3 205 0.78 0.30 0.43 Noise Pow er Spectrum (NPS) 17 62 0 0 0 79 0.20 0.78 0. 32 Outside Phan tom (OoP ) 0 3 0 0 1 4 0.00 0.00 0.00 Task Tr an sfe r Function (TT F) 0 5 0 53 0 58 0.73 0.91 0.81 Tapered Section (TaS) 0 112 0 0 0 112 0.00 0.00 0.00 AGP NPS OoP TTF TaS TOT = 458 Prediction Truth Accuracy = 0.38 Con fu sion Matri x Metr ics Prediction Truth Accuracy = 0.86 Con fu sion Matri x Metr ics The resultin g model does accuratel y classif y phantom images in id ea l se ttings and retains most of that accuracy in more difficult conditions . It i s fascinat ing that a lthough as muc h as 88% of the t ota l model parame ters are i n the de ns e classifi cation layers in the case , these classif i cation layers do not provide m uch of the accurac y. A mu ch smaller model wi th achieves similar accu racy i n all e valuat ion sets a t a pproxi mately 1/6 the model size. This finding is consis tent with initi al tests of VGG classifie rs, whi ch attribut ed mu ch of t h e archi tecture’s reported accura cy to the convolu tional layers 12 . Another i n teresting finding is that initial layers trained for in terpreting color channe ls require little to no modific ation to interpret add itional imag e inform ation. O ur cla ssi fier pe rform ed compar ably w ell wh en forced to retain Ima geNet we ights at early layers . There w ere defini te uses of the axial infor mation for a subs et of class ificatio ns. This is evid enced by how the accuracy suffers and n ew m odes of f ailure arise in the triplicate model, wh ich lacks axial inform ation . Gi ven t hat freezing the l ower layers do es not no tably affec t a ccuracy, an d l ikewise no a ccuracy losses are observed with subs ta nti ally lower pa ram eter counts in the t op clas sific ation layers, we conclude that axial asso ciations are made in the mid - to -up per convolut ional layers . Researc h into n eural netw ork activ ation an d interpr etability sug ge sts similar find ings 7,21 . We proposed that mi salig nment a nd other imaging param eters introduce variability w hich can be emulated through extensiv e a ugm entation of well-aligned s ets, rather than collecting s amples with misalignm ent. R egular ization by image augmen tation was critical in training this model to evaluate misaligned phan toms. Wh ile the augm entations w e re i mperf ect emulations of real c hanges to the i mag es, th ey impar ted c ruci al prop e rties like sc ale i nvarianc e to the classifier. Rem oving augmen tation h ad th e most pr onounced effect o n classifi cation a ccura cy of any o f the a blation studies, includ ing triplicating input. In futur e studies it may be worth rei teratin g on augmen tations to more closely match artifacts native to CT syste ms or phanto m misus e. Ultimate ly deploying this model in more conventiona l clinical hardware may ben efit from smaller arch itectu re s with suitable accura cy but lower c ompu t ational requir ements . VGG 19 was useful in this s tudy for it s straightfo rward architec ture and e ase of training. Various altern ative classific ation architectur es ex ist whi ch may improve perfor mance o r reduce resources requir ements . For example, architect ures such a s R esNet 6 , Incep tion 3,5,16 , or Inceptio n-Resnet 5 pr ovide demonstra ble perform ance gains over VGG classifi ers. Mobil eNet 22 and its variations r educe the tota l computation a l requiremen t, at t imes w ith negligible perfor manc e penal ties . The ablat ion experimen ts pe rform e d here show Imag eNet weights do h ave demonstrable benefits in training, but other ra ndom initia lization s chemes may allow for tr aining novel architec tures for this problem wi th no performan ce penalty . T esting all these trade offs when appl ied to CT phantom im ages are the nex t logical s teps in sing le-imag e classifi cation approach. 5 CONCLUSIONS These results indica te an effe ctive approach to autom ating this facet of image qual ity assuranc e. We achieve excellent performanc e in independen t data sets from typical imaging c onditions for phan toms, m atching e xpert annotations in as much as 98 % of ca ses. The c lassifi er is insensitive to e ven gro ss faults in positioning t he pha nto m, achieving 86% accu racy in the extrem e test se t. Ima ge a ugmen tation, and the reuse of inpu t chann els trained for color images, wer e effe ctive i n adapting the VGG19 ar chitectur e to th is dom ain. APPENDIX Figure A1 . A series of Mercury Phan tom images fr om the t rainin g set . Th ese images are in order o f acqu i sition , wi thout augmen tation or shu f fling. A clini cal i maging p hysic ist acquire d ea ch phan tom i mage serie s and label ed ea ch ima ge wi th the entire seri es for referenc e . Note the pos ition rela tive to the CT bed at the botto m of the frame. The first imag e shows part of the suppo rting structure shown in Figu re 1. The se are the smalle st diame ter ima ges, co ming from the beginn ing of the phanto m. Figure A2 . A s eries of Mercur y Phant om images fro m the extre me test s et. These i mage s are i n s huff led order , with no augmen tation . Compa red to the t rain ing set, the field of view does not always full y enco mpass the phan t om, causing cutof f artifac ts as seen in i mages 0, 5, 7, 12, 13, and 15. The suppo rt structure is partly vi sible in image s 6 and 9, and is plac ed off center with respect to the CT bed. All of these intent ional misa lign ments also notab l y shift the smaller dia meter imag es off - center, s uch as i n image 2. It is d iff icult t o misal ign t he phant om drama tically and still acqui re an i mage , a s the phys ical devic e must pass throu gh the CT bore . S everal imag es in thi s ser ies are grad ed as uns uitable (A ir gap o r partial volum e) by t he clin ical imag ing physi cist labeling t he ph anto m imag es. Table A1 . C onfus ion m at rices and per-ca tegor y metrics for the mode l in Figure 3 eval uated o n the v alidation s et after tra ining . Resu lts are repor ted for each variant as the n umbe r of channels i n t he dense l aye r ( /nP) i s increa sed by facto rs of 2 . A ll model varian ts class ify the validat ion set with high ac curacy. With the exce ption of one taper ed section m isclass ificat ion by the 4096 v ariant , these models only mistak e the pres ence or absenc e of air gaps or parti al volum es t hat make imag es unsu itable , in a m inority of cas es. The models are over all in disting uishab le by valida tion se t accu r acy. Val id ati on Set (nP = 256) N Samp les Precision Recall F1 Air Gap or Par tial Volume (AGP ) 71 0 0 2 0 73 0. 95 0. 97 0.96 Noise Pow er Spectrum (NPS) 2 84 0 0 0 86 1.00 0.98 0.99 Outside Phan tom (OoP ) 0 0 6 0 0 6 1. 00 1. 00 1.00 Task Tr an sfe r Function (TT F) 2 0 0 67 0 69 0.97 0.97 0.97 Tapered Section (TaS) 0 0 0 0 113 113 1.00 1.00 1.00 AGP NPS OoP TTF TaS TOT = 347 Val id ati on Set (nP = 512) N Samp les Precision Recall F1 Air Gap or Par tial Volume (AGP ) 73 0 0 0 0 73 0. 92 1. 00 0.96 Noise Pow er Spectrum (NPS) 3 83 0 0 0 86 1.00 0.97 0.98 Outside Phan tom (OoP ) 0 0 6 0 0 6 1. 00 1. 00 1.00 Task Tr an sfe r Function (TT F) 2 0 0 67 0 69 1.00 0.97 0.99 Tapered Section (TaS) 1 0 0 0 112 113 1.00 0.99 1.00 AGP NPS OoP TTF TaS TOT = 347 Val id ati on Set (nP = 1024) N Samp les Precision Recall F1 Air Gap or Par tial Volume (AGP ) 73 0 0 0 0 73 0. 91 1. 00 0.95 Noise Pow er Spectrum (NPS) 4 82 0 0 0 86 1.00 0.95 0.98 Outside Phan tom (OoP ) 0 0 6 0 0 6 1. 00 1. 00 1.00 Task Tr an sfe r Function (TT F) 0 0 0 69 0 69 1.00 1.00 1.00 Tapered Section (TaS) 3 0 0 0 110 113 1.00 0.97 0.99 AGP NPS OoP TTF TaS TOT = 347 Val id ati on Set (nP = 2048) N Samp les Precision Recall F1 Air Gap or Par tial Volume (AGP ) 73 0 0 0 0 73 0. 91 1. 00 0.95 Noise Pow er Spectrum (NPS) 2 84 0 0 0 86 1.00 0.98 0.99 Outside Phan tom (OoP ) 0 0 6 0 0 6 1. 00 1. 00 1.00 Task Tr an sfe r Function (TT F) 4 0 0 65 0 69 1.00 0.94 0.97 Tapered Section (TaS) 1 0 0 0 112 113 1.00 0.99 1.00 AGP NPS OoP TTF TaS TOT = 347 Val id ati on Set (nP = 4096) N Samp les Precision Recall F1 Air Gap or Par tial Volume (AGP ) 72 0 0 1 0 73 0. 90 0. 99 0.94 Noise Pow er Spectrum (NPS) 7 79 0 0 0 86 0.99 0.92 0.95 Outside Phan tom (OoP ) 0 0 6 0 0 6 1. 00 1. 00 1.00 Task Tr an sfe r Function (TT F) 0 0 0 69 0 69 0.99 1.00 0.99 Tapered Section (TaS) 1 1 0 0 111 113 1.00 0.98 0.99 AGP NPS OoP TTF TaS TOT = 347 Prediction Truth Accuracy = 0.98 Accuracy = 0.98 Accuracy = 0.98 Accuracy = 0.97 Accuracy = 0.98 Con fu sion Matri x Metr ics Prediction Truth Con fu sion Matri x Metr ics Prediction Truth Con fu sion Matri x Metr ics Prediction Truth Prediction Truth Metr ics Con fu sion Matri x Con fu sion Matri x Metr ics Table A2 . Confu sion m atrice s and per- cat egory metrics for the model in Figu re 3 eva luated o n t he tes t set after train ing. Resu lts a re rep orted f or each variant as the nu mber of ch a nnels in the dense layer ( /nP) i s increa sed by factors of 2. Sim ilar to val idation set resul ts, a ll mod el var iant s clas sify the test s et w ith high acc uracy . One ta p ered section i mage is mis clas sified as an Out of Pha ntom image, bu t o t herwi se er r ors are in d eter mining s uitab le images. The model s are overa ll i ndis tingu ishab le by test set ac curacy , which are classi fied co rrec tly in m ost cas es. Test Set (n P = 256) N Samp les Precision Recall F1 Air Gap or Par tial Volume (AGP ) 71 0 0 2 0 73 0. 96 0. 97 0.97 Noise Pow er Spectrum (NPS) 1 83 0 0 0 84 1.00 0.99 0.99 Outside Phan tom (OoP ) 0 0 3 0 0 3 1. 00 1. 00 1.00 Task Tr an sfe r Function (TT F) 1 0 0 67 0 68 0.97 0.99 0.98 Tapered Section (TaS) 1 0 0 0 114 115 1.00 0.99 1.00 AGP NPS OoP TTF TaS TOT = 343 Test Set (n P = 512) N Samp les Precision Recall F1 Air Gap or Par tial Volume (AGP ) 71 0 0 2 0 73 0. 90 0. 97 0.93 Noise Pow er Spectrum (NPS) 3 81 0 0 0 84 1.00 0.96 0.98 Outside Phan tom (OoP ) 0 0 3 0 0 3 0. 75 1. 00 0.86 Task Tr an sfe r Function (TT F) 3 0 0 65 0 68 0.97 0.96 0.96 Tapered Section (TaS) 2 0 1 0 112 115 1.00 0.97 0.99 AGP NPS OoP TTF TaS TOT = 343 Test Set (n P = 1024) N Samp les Precision Recall F1 Air Gap or Par tial Volume (AGP ) 70 0 0 2 1 73 0. 91 0. 96 0.93 Noise Pow er Spectrum (NPS) 4 80 0 0 0 84 1.00 0.95 0.98 Outside Phan tom (OoP ) 0 0 3 0 0 3 1. 00 1. 00 1.00 Task Tr an sfe r Function (TT F) 2 0 0 66 0 68 0.97 0.97 0.97 Tapered Section (TaS) 1 0 0 0 114 115 0.99 0.99 0.99 AGP NPS OoP TTF TaS TOT = 343 Test Set (n P = 2048) N Samp les Precision Recall F1 Air Gap or Par tial Volume (AGP ) 72 0 0 1 0 73 0. 87 0. 99 0.92 Noise Pow er Spectrum (NPS) 5 79 0 0 0 84 1.00 0.94 0.97 Outside Phan tom (OoP ) 0 0 3 0 0 3 1. 00 1. 00 1.00 Task Tr an sfe r Function (TT F) 4 0 0 64 0 68 0.98 0.94 0.96 Tapered Section (TaS) 2 0 0 0 113 115 1.00 0.98 0.99 AGP NPS OoP TTF TaS TOT = 343 Test Set (n P = 4096) N Samp les Precision Recall F1 Air Gap or Par tial Volume (AGP ) 71 0 0 2 0 73 0. 88 0. 97 0.92 Noise Pow er Spectrum (NPS) 7 77 0 0 0 84 1.00 0.92 0.96 Outside Phan tom (OoP ) 0 0 3 0 0 3 1. 00 1. 00 1.00 Task Tr an sfe r Function (TT F) 1 0 0 67 0 68 0.97 0.99 0.98 Tapered Section (TaS) 2 0 0 0 113 115 1.00 0.98 0.99 AGP NPS OoP TTF TaS TOT = 343 Accuracy = 0.97 Con fu sion Matri x Metr ics Prediction Truth Accuracy = 0.97 Truth Accuracy = 0.97 Con fu sion Matri x Metr ics Prediction Truth Prediction Truth Accuracy = 0.97 Con fu sion Matri x Metr ics Prediction Con fu sion Matri x Metr ics Prediction Truth Accuracy = 0.99 Con fu sion Matri x Metr ics Table A3 . Confusion matrices and p er-categor y m etric s f or the model in Fi gur e 3 e valua ted on the ex treme test set af ter training . Resu lts are repor t ed for each variant as the num ber of ch annel s in the den se layer ( /nP) is inc reased by factors of 2. The more difficul t cases presen t i n the extre m e t est set hel p diff erent iate the model variants. The 1024 and 2048 varia nts underpe rfor m in t his eval uatio n. While the 256 var iant dram atic ally reduce s the size of the classi fier at simila r over all accura cy, the types o f errors i t produ c es are un desi rable in pra ctice. By contras t, the 512 an d 4096 var iants a re conse r vat ive, and more likely to classi fy an i mage as unsuitab le rathe r t han c lass ify a n unsuitab le AGP im age as a valid t est pat tern . We selec t the 512 mo del a s it minimiz es the ov e ral l para meter count wh i le ac hieving good ac curacy wi th more f avor able t ypes of error in the e xtreme test evalu ation. Extr em e T est Set (n P = 256) N Samp les Precision Recall F1 Air Gap or Par tial Volume (AGP ) 156 10 5 30 4 205 0.89 0.76 0.82 Noise Pow er Spectrum (NPS) 7 72 0 0 0 79 0.87 0.91 0.89 Outside Phan tom (OoP ) 4 0 0 0 0 4 0. 00 0. 00 0.00 Task Tr an sfe r Function (TT F) 0 0 0 58 0 58 0.66 1.00 0.79 Tapered Section (TaS) 8 1 0 0 103 112 0.96 0.92 0.94 AGP NPS OoP TTF TaS TOT = 458 Extr em e T est Set (n P = 512) N Samp les Precision Recall F1 Air Gap or Par tial Volume (AGP ) 173 11 0 19 2 205 0.84 0.84 0.84 Noise Pow er Spectrum (NPS) 13 66 0 0 0 79 0. 86 0. 84 0. 85 Outside Phan tom (OoP ) 2 0 2 0 0 4 1. 00 0. 50 0.67 Task Tr an sfe r Function (TT F) 0 0 0 58 0 58 0.75 1.00 0.86 Tapered Section (TaS) 19 0 0 0 93 112 0.98 0.83 0.90 AGP NPS OoP TTF TaS TOT = 458 Extr em e T est Set (n P = 1024) N Samp les Precision Recall F1 Air Gap or Par tial Volume (AGP ) 153 18 2 22 10 205 0. 78 0.75 0. 76 Noise Pow er Spectrum (NPS) 8 71 0 0 0 79 0.79 0.90 0.84 Outside Phan tom (OoP ) 4 0 0 0 0 4 0. 00 0. 00 0.00 Task Tr an sfe r Function (TT F) 0 0 0 58 0 58 0.72 1.00 0.84 Tapered Section (TaS) 31 1 0 0 80 112 0.89 0.71 0.79 AGP NPS OoP TTF TaS TOT = 458 Extr em e T est Set (n P = 2048) N Samp les Precision Recall F1 Air Gap or Par tial Volume (AGP ) 155 24 0 21 5 205 0.85 0.76 0.80 Noise Pow er Spectrum (NPS) 9 70 0 0 0 79 0.62 0.89 0.73 Outside Phan tom (OoP ) 4 0 0 0 0 4 0. 00 0. 00 0.00 Task Tr an sfe r Function (TT F) 2 0 0 56 0 58 0.73 0.97 0.83 Tapered Section (TaS) 12 18 0 0 82 112 0. 94 0.73 0. 82 AGP NPS OoP TTF TaS TOT = 458 Extr em e T est Set (n P = 4096) N Samp les Precision Recall F1 Air Gap or Par tial Volume (AGP ) 181 2 1 13 8 205 0.82 0.88 0. 85 Noise Pow er Spectrum (NPS) 24 55 0 0 0 79 0. 96 0. 70 0. 81 Outside Phan tom (OoP ) 4 0 0 0 0 4 0. 00 0. 00 0.00 Task Tr an sfe r Function (TT F) 3 0 0 55 0 58 0.81 0.95 0.87 Tapered Section (TaS) 8 0 0 0 104 112 0.93 0.93 0.93 AGP NPS OoP TTF TaS TOT = 458 Accuracy = 0.79 Con fu sion Matri x Metr ics Prediction Truth Accuracy = 0.86 Truth Accuracy = 0.79 Con fu sion Matri x Metr ics Prediction Truth Prediction Truth Accuracy = 0.86 Con fu sion Matri x Metr ics Prediction Con fu sion Matri x Metr ics Prediction Truth Accuracy = 0.85 Con fu sion Matri x Metr ics REFERENCES [1] Ria , F., Solo mon, J. B., Zhang , Y ., Wilson, J. M. a nd Samei , E., “Use of Mer cury Phanto m to Predi ct CT I mage Noise and Inform Protoco l Design ,” Med. Phys . 45 (6), E136 – E136 (201 8). [2] Y . LeCun, B . Boser , J. S. D enker, D. Henderson , R. E. Howard, W . Hubbar d and L. D. Jack el., “Backpropag ation Applied to Handwrit ten Zip Code Re cognition, ” Neur al Com put. 1 (4), 541 – 551 (1989) . [3] S zegedy, C ., Liu, W ., Jia, Y. , Serman et, P., Re ed, S., Angu e lov, D., Erhan, D., Vanho ucke, V . and Rab inovich, A., “Going De eper w ith Convolu tions,” Ar Xiv14094 842 Cs (2014). [4] Ronneb e rger, O., Fisch er, P. and Brox, T . , “U - Net : Convo lutional N etworks for Biom edical Im age Segm entation, ” ArXiv15050 4597 Cs ( 2015). [5] S zegedy, C ., Ioffe, S ., Vanhouc ke, V . and Al emi, A., “Incept ion -v4, Incept ion-ResNe t and the I mpact of Residu al Connect ions on Le arning,” ArXiv16020726 1 Cs (2016). [6] H e, K., Zhang, X., Ren, S. an d Sun, J., “Deep R esidual Lear ning for Im age Reco gnition,” ArXiv15120 3385 Cs (2015). [7] G irshick, R., Donahue , J., Darre ll, T. and M a lik, J., “ Rich featur e hierar chies for accurate ob ject d etection and semantic segmen tation,” ArXi v13112 524 Cs (2 014). [8] G irshick, R., “Fast R - CNN ,” ArX iv150408083 Cs (2015 ). [9] Ren, S., He , K., Girsh ick, R. and Sun, J., “Fast er R -CNN: To wards Real-T ime Obj ect Detect ion with R egion Proposal Networks, ” ArXiv15 0601497 Cs (2016). [10] He, K., Gk ioxari , G ., Dollár, P. and G i rshick, R ., “Mask R - CN N,” ArXiv17 0306870 Cs (2018). [11] Chollet, F., [Deep Learnin g with Pytho n, 1st ed.], M anning P ublications Co., U SA (2017) . [12] Simonyan , K. and Zisser man, A., “Very De ep Convo lutional Networks fo r Large - S cale Image Recogni tion,” ArXiv14091 556 Cs (2 015). [13] Goodfellow , I., Beng io, Y. and Courv ille, A., [De ep Lear ning], M IT Press ( 2016). [14] Deng, J., D ong, W., Socher, R ., Li, L.-J., Ka i Li and Li Fei- F ei., “Ima geNet: A large -scale hierarch ical imag e databas e,” 2009 IEEE Conf. Comput . Vis. Pa ttern Re cognit., 248– 255 (2009) . [15] A. Busla ev, V. I. I. , A. Parin ov, E. Khvedch enya and Kalin in, A. A ., “Albu mentatio n s: fast and flex ible image augmen tations,” ArXiv E -Prin ts (2018). [16] Ioffe, S . and Szeged y, C ., “Batch normalizat ion: acce lerating deep network tr aining by reducing internal covaria te shift,” Proc . 32nd Int. Conf. Int. Conf . Mach. L e arn. - Vol. 3 7, 448 – 456, J M LR.org, Li lle, Fra nce (2015) . [17] Kingma, D. P. and Ba, J., “A dam: A Method fo r Stoch astic Opti mization ,” ArXiv141269 80 Cs (2017). [18] Martín Ab adi, As hish Agarw a l, Paul Barham, Eugene Brevdo, Zhi feng Ch en, Cra ig Citro, Greg S . Corrad o, Andy Davis, Jef frey Dean , Mat thieu Devi n, Sanjay Ghem awat, Ian Goodf e llow, Andrew H arp, Geoffr e y Irving , Micha el Isard, Jia, Y., Raf al Jozefowi cz, Lukas z Kaiser , Manjuna t h Kudlur , et al., [T ensorFlow : Large -Sca le Machin e Learning o n Het erogeneous Systems] (2015). [19] Keskar , N . S., Mud igere, D ., Noced al, J., Sm elyanskiy , M. and T ang, P. T . P., “On Large -Batch Tr a ining for Deep Learning: Generali zation Ga p and Sharp Mini ma,” ArXiv 160904836 Cs M a th (20 17). [20] Masters , D . and Lus chi, C., “Revis iting Sma ll Batch T rainin g for De ep Neural Networks, ” ArXiv180 407612 Cs Stat (2018). [21] Chollet, F., “How convolut ional neura l networ ks see th e world,” (14 Ja nuary 2020 ) . [22] Howard, A. G., Zhu, M., Chen, B., Ka lenichenko , D., Wa ng, W., Weyand, T., Andr eetto, M . and Ada m, H., “MobileN ets: Effi cient Conv olution al Neura l Networks for Mobile V ision Appl ications,” ArXiv17040486 1 Cs (2017).
Original Paper
Loading high-quality paper...
Comments & Academic Discussion
Loading comments...
Leave a Comment