DC-AL GAN: Pseudoprogression and True Tumor Progression of Glioblastoma Multiform Image Classification Based on DCGAN and AlexNet
Pseudoprogression (PsP) occurs in 20-30% of patients with glioblastoma multiforme (GBM) after receiving the standard treatment. In the course of post-treatment magnetic resonance imaging (MRI), PsP exhibits similarities in shape and intensity to the …
Authors: Meiyu Li, Hailiang Tang, Michael D. Chan
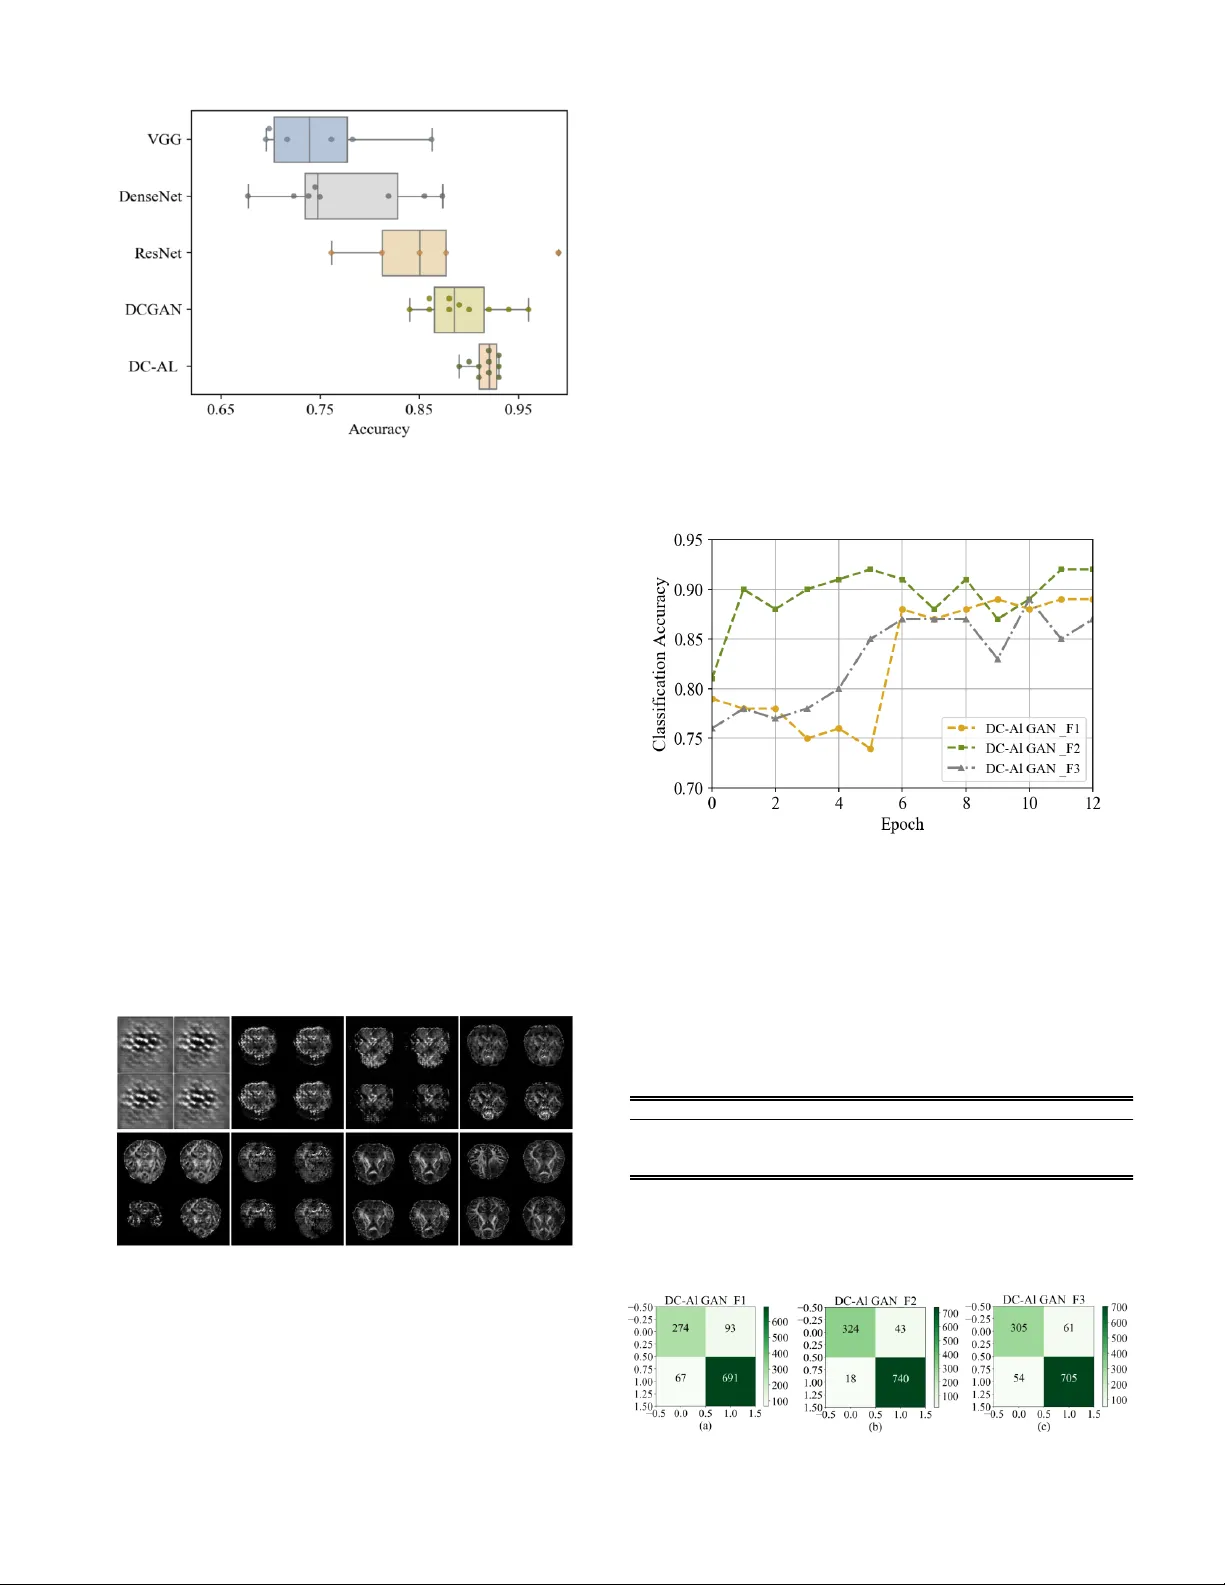
Abstrac t — Pseu do progress ion (Ps P) occurs in 20-3 0% o f patien ts with glioblasto ma mul tiform e ( GBM) after r ec eiving t he standard treatm ent. In t h e co urse of post-treatme nt magn etic resonanc e ima ging ( MRI), PsP exhibi ts sim ilariti es i n shap e a nd intens ity to th e t rue tumo r p rogres sion (TT P) of GBM. S o , these simila rities po se cha llenge s on the d ifferen tiatio n o f these ty pes o f progres sion and h enc e th e se lectio n of the appro pr iate c linical treatmen t strategy . In t hi s paper, we intro duce DC - AL G A N , a no vel feature learning method base d on dee p conv o luti o nal generat ive adv ersar ial ne twork (DCGAN) an d AlexN et, to discrim inate betw een P s P and TTP in MRI image s . Du e to the adv ersarial rela tionsh ip be twee n the g ene rator and the discrim inato r of DC GAN , hi gh-lev el discr iminat ive featu res of PsP and TT P can be deriv ed for the d iscr iminato r with AlexN et. Also, a fe ature fusion schem e is used to com bine h igh er - layer featur es with lo w er -layer inform atio n , l ead ing to mo re pow erful featur es t hat are used f o r effect ively discr iminati ng betwee n PsP and TT P. Th e expe rimen tal res ults sho w th at DC - AL GA N achiev es des irable P sP and TT P classif icatio n perform ance that is superio r to other s tate- of -th e-art me tho ds. Index Terms — G lioblasto ma multi forme , Pseudopro gress ion, Deep conv olution al genera tive adv ersarial netwo rks , AlexN et , Feature fusio n. I. I NT RODUCTION LIOBL ASTOM A m ult ifo rm e (GB M) is o n e of the most co mmon b rain tu mors, and i s p rima rily cause d by t he canceratio n of glia l cells in the brai n and t h e spi nal c o r d . M. Li is w ith Coll e ge of Electronic Scie nce and E ngi ne ering , Jil i n Univ e rsity , Changchu n 130012 , China, and also with I nstitute for Medical Imaging Technolo g y, School of Bio me dica l Engin ee ring, Shanghai Jiao T ong Univer s ity, S h anghai 2 0003 0 , China. H. T an g i s with D ep ar tment o f Neur osurgery, Hua sh a n H ospital, F uda n Univer s ity, S h anghai 2 0004 0, Ch ina. M . Chan i s with Departme n t of Ra diology, Wake Fo r es t School of Me dicin e, Winston -S alem , NC 27 157, USA. X . Zhou i s wit h School of B iomedical Informatics, T he Unive rs ity of T exas Health Sci e nce C en t e r at Hou s t on, H o u s ton, T X 77030 , U S A . X . Q ian is with Depart ment of Radiolog y, Wa ke F orest S chool of Medicine , Winston -S alem , N C 271 57, US A, a n d also with I ns titut e for M e di cal Imagi ng Technolo g y, School of Bio medic a l Engin eering, Shan ghai Jiao To ng Univer s ity, Sha nghai 200030 , Ch ina (corres p onden ce e-mail: Xiaohua.qia n@sjtu.edu.cn). Currently , the stand ard treatment o f GB M i n c ludes surgery , radiot h e r apy , chemo th e rapy , and t argeted the r apy [1]. A mong GB M pati e nts who hav e receive d r o utine tr e atment, the prob ability of occurre nce o f pse udo pr o gr ess ion (PsP) is abo ut 20 to 30% [2] . PsP is a subac ute s y mpt o m that mimi cs truetumo r prog r e ssio n ( TTP) at the tu mor s ite or r es ec tion margi n s, b ut PsP subse quen t ly r egresse s o r r em ains st able [3 , 4] . The di f ferentiation be tw een P sP an d TTP in cli ni c al practic e is mainly based on analy z ing vis ible change s in t he MRI o f the lesio n are a. H ow eve r, such analy sis is ty pically t im e- co nsuming, c an cause missing a patient's optim al tr e atme nt time, and has h e n c e t he treatme nt delay ca n have a de trime ntal effe ct o n the tre atment o utco mes. In a ddi tio n , bio psy of brain tumors isn’t wide ly r e co mmended due to the inv asiveness a n d increased risks of th e proce dure. In summary , it is nece ssary to find a be tter n o n i n v a siv e and effic ient method to disti nguish be t w een PsP and TTP of GBM . Ov er th e past decade, rese ar c h e r s hav e devo ted considerab le effo rt s to explo re me thods b ased o n genetic a nd mo lec ula r markers, as w ell as imag e featu res fo r d iffe r e ntiating Ps P and TTP of GBM. Genetic an d molec ular ma r ke r s asso ciated w it h PsP include: the MGM T p r omo ter m e thy l atio n [2 , 5-12] , K i67 expressio n [ 5], IDH 1 mutatio n [12] , p53 mutation [ 13 ] , inte r f eron-regulato r y f acto r 9 (IRF 9) [14] and DNA rep air protei n (XR CC1) [15]. Ne ve rth e less, the p redic tive v a lue of these marke rs r emai ns co ntr o v ersial [ 9 , 16- 18] . He nce, medical imaging t e chniques have be en eme rging as pote ntial alternat ives fo r PsP and TTP diffe rentiatio n . In pa rticula r, magnetic reso n a nce imaging (MR I) techniques t hat have been explo ited for this task i n c lude diff usion-we igh ted i maging (DWI) [19-22], perfusio n-we igh ted i m aging (PWI) [19 , 23 ] , diff usion tenso r imaging (DTI) [24 -28] , a nd t hr e e-di mensio nal ec h o plan a r spec tr o sc opic imaging (3D-EPS I) [29]. H ow ever, these methods have achieve d limited succe ss for seve r al reasons . Firstly , manual ide n tificatio n of l e sio n areas in medical images is sub jec tive and co stl y . Next, the analy sis of basic image fe atures c annot ade quately c apture the subtle d iff erences of Ps P an d TTP. Lastly , these methods have foc used on usi ng diffe r e nt image fe atur es to ev alua te va r io us MR I modalitie s, rather than dev eloping an obj ective an d a u toma tic classific atio n sy stem for PsP and TTP. DC -A L GAN: Pseudoprogression and T rue T umor Progression of Glioblastoma M ultiform I mage Classification Based on DCGAN a nd AlexNet Meiy u Li, H ai l iang Tang , Mi chael D. Chan , Xi aobo Zhou , and Xiaohua Qian G With the dev elo pment o f de ep learning, r e se archers hav e gradual ly discovered it s potential fo r use in the fie ld o f i ma ge reco gn i tion [30-36] . Sig nificant prog r es s has bee n m ade us ing dee p learni ng-based methods , espe cially deep c o n vo lutional neural n e two r k (CNN) . Thi s app roach ha s g r e atly pr o mo ted t h e deve lopment of im age c lassif ication and segme ntatio n sy stems [37-39]. Compared w ith tradi tional patte rn r ec o gn i tio n met h o ds, the g r eatest adv antage of CNN for i mage classif icatio n is that it can learn image f eatures auto matically . This impo r t ant adva ncement elimi nates th e c o mplicated featu r e-e ngineeri ng part of t h e traditio nal approac h . S pec ifically , it is not neces sar y to study th e l o cal o r glo bal featu r e s while sea rching fo r what aspec ts b est de scribe t he c h a racte r ist ics of the ima ge itself. So me a pp roaches [ 40 -44] base d on CNN have ac h ie ve d succ ess in i mage classific atio n tasks , b ut dee p c o n v o lutional n eu ral netwo rks o fte n co nfront a sev er e p r o b lem k n o wn as ov er f i tting. Ov erfitting occ urs bec ause machine learning methods are required to trai n many learnable pa rame ters, w hich in turn requires a large numbe r of traini n g sa mples. This issue be comes particularly tr icky w h e n the numbe r of tr a ining sa mples is limited . In this dom ain, the prob lem is exempl ified because medical image s are diff icult t o o b tai n in large quantities due to both limited ac ce ss an d the inh e r e n t co n f i de n t iality of t he sub ject ma t ter. If there i s an i n suf ficient number of training samples, the deep mode l i s o ften over-trained . Conseque n tly , the model pe rfo r ms w ell during the training phase, b ut relative ly poo r ly during the sub seque nt testi ng p hase. Thus , it is e ssential to c arry out a new and ef fe ctive t raining s trategy for dee p learning mo dels that solv e the prob l e m of over f itting. A generative a dv ersaria l n e two r k (GAN) [45] i s a deep learning ar c hitectu r e in w hich two neu r a l n e two rks co mpete against each ot her in a ze r o-sum game f ramewo r k. A GAN c an be r e garded as a regularize d learni ng sc h eme and can sig n if icantly all e viate t he ov er f itting p henome n o n. In pa rticu la r , a GAN mode l consists o f two parts : a ge n e r a tor and a discrimina tor. Th e g e n e rator produce s s y nth e tic images by imitating the origi nal dat a di st ributio n , whe r e as the discrimina tor is used to disti nguis h sa mples and c lassify the m as r eal o r generated [46- 52 ]. In the lea rning s tage of a GA N mode l [53], it is n e ce ssary to tr a in th e disc riminato r, D, to eff iciently disce rn the source of input data as ei ther ge n ui n e or fake . Simulta n e o usly , the ai m o f t he gen e r a tor, G, is t o cr e ate samples that a re incr e as ingly simila r to the r e al image s. Throug h t h e adve rsa r ial and compe titive relatio nship be tween th es e two n e two r ks, w h e n a limited n umb er of tra i ning s ampl es is used, the proce ss of t rai ning the disc r imi nato r wi ll no t immedia tely succumb to ove rfittin g . Wi th the help of GANs , the prob l e m of overfitting in deep lea rn i ng can be sig n if ica ntl y alleviated [51 , 54 , 55]. Al though GANs have perfo rmed w ell i n many fie lds, t he a dve rsarial natu re of t he met hod leads t o prob lems o f insta b i l ity. In o r de r to solv e th is , my ri ad techniqu es have b ee n used t o stabilize the trai ning proc ess. It has been discov ered that a dee p co nvolutional ge nerative adve rsarial netwo rk p lay s a n impo r ta nt r o le i n e liminati ng i nstabil ity prob lems. The dee p convo l utio n a l ge n e r ativ e adve r s arial n etw ork (DCGAN ), w h o se discriminato r and ge nerato r a r e built o n CNN, has a c h iev ed a hig h lev el of performance in image sy nth e sis tasks [56]. G e nerato r G, whic h ta ke s a unif orm nois e distribut ion as input, ca n be res ha pe d into a mult idime nsional tensor. Disc r imi nator D r eplace s po o lin g lay ers w ith st r i de co nvolutions on the b asis o f commo n CNN, a nd t h e acti v a t io n functio n s are leaky rectifie d linea r units . DCGAN show s pote nt i al in automatica lly learning d ata dist ributi on characteristics , and it ef fec tivel y alleviates the instab ility that co mes with GAN trai ning. In t h is w ork , A l e xNet [57] w as c h o sen as the d iscrim inator , and it was used t o identify t he featu r e s used f or final classif ication. AlexNet is an ar c h i tecture base d o n CN N that ha s prov en succ ess in scene classificat ion tasks. I t is reco gn ized as an exce llent basic leve l , automat ic sce ne classif icati on technolo gy [58 , 59]. W hile t h e ty pical poo l ing proc ess is n o n - ove rla pp ing, AlexN et ha s , i n de ed, a n o v erla pp ing poo l ing proce ss. This cont ri b utes to a h ighe r classific ati o n accuracy bec ause mo re origi nal i nfo r ma tio n is retai n e d. Su ppose th e kernel size s are z× z and the stride is s in eac h of t he co nvolutional and de co nvo lu tio n a l lay er s. U pon setti ng s=z, traditio nal loc al po oling, as co mmo n ly employed i n CNN, i s obtai n e d. If s< z is set , o verlapping po oli ng is ob tain e d. Mo dels w ith ov erla pp ing poo ling are slig htly mor e resista nt to ove rfitting du ring traini n g . In a ddition, f eatu r e f usio n h as b een employ ed t o c o m b ine hi g h - lay er features w ith lo w-laye r fe atur e s. This r es ults in a mo r e rob ust f eature, which improv es the final c lassificat ion accu r acy to s o m e extent. GANs represe nt a promis ing u n superv ised le arning sche me. How ever, so far, GA Ns have r a r e ly bee n applied in the classif ication of PsP and T TP o f GB M. We asse r t that fo r t his kind o f classific ati o n t ask, a GAN is a n exce lle n t c h o i c e bec ause a GAN is an u n su per v i sed l e arni n g architectu re that depe n ds o n t h e ge n e rator to c ompe n sa te fo r the s h o r t age of training data. Thus , in th is p aper, w e p r o pose a model DC - AL GAN, which c o mbines DCGA N w ith Ale xNet to learn t h e represe n t atio n o f GBM images. T h e co n tribut ions o f thi s w or k are the fo llow i ng. 1) The ant agonism and co m pe tition betw een the discrimina tor and the generato r lead to the extractio n o f high l y refined f eatu r e s f rom the disc r imi nato r . T h e ext ractio n o f such fe atur e s from PsP and TTP of GB M and the applic ation of GANs to th e classificat ion of th es e f eatures r e pr e sent a n o vel applicat ion. 2) AlexN et w a s emplo ye d as the discrimi nator in this w ork, and the extrac ted fe atur es a r e used du ring the final classif icati on. The ty pical poo ling p r o cess is no n -ov erlapping, w hile it is ove rla pp ing for AlexNet . This contrib utes to a h igh er classif ication accu r acy because more original info rmation is retained. 3) Fe ature f usion was impleme n ted suc h that it co mbines fe atur e s from bo t h hig h and low laye rs, lead ing to fe atur e s that are m o r e precise . The result is an improv ement in the f inal classif ication accu r acy . The framew o r k of t he propo se d DC - AL GAN mode l is show n i n Fig. 1 II. P RE LIMIN A RI ES Sec tion A introduce s the data use d in this paper. Sec tion B desc ri b es th e p rinciples of the ge n e r a tive adve rsa r i al netw o r ks and su mma rizes the traini n g proce dure invo l v i ng ge nerato r and discrimina tor. Sec tion C show s th e AlexNet a rchitecture. A. Data C ollecti on A dataset co mpose d of clinical reco rds and longit udinal D TI data fro m 84 GB M patie nts (23 w i t h PS P and 61 w ith T TP) was co llected at the Wake Fo rest Sc hoo l of Me dicine, Wi n s ton - Salem, NC. Each o f th e se patie nt s r e ce ive d a routine treatme nt , such as surgical r es ec tion fo llowe d by concurrent radiot herapy and c h emo th e rapy with te mozo lomide. Eac h of the enrolle d patients rece ive d a fixed dose of conformal radiot herapy (around 60 Gy ). Along wit h radiot h e r apy and ch e mot herapy , each patie n ts underwe nt DTI scanni n g (sc anne r: SIMCGEM R, GE Me dical Sy stems) ever y tw o or three months f or monitori ng. The ulti mate diagnosis r es ults of P sP an d TTP rely o n t h e follow -up images and prof es si o nal evaluatio n by expe r ience d phy sician s . B. Gene r ative Adversaria l Netw orks A gene r at ive adversarial n etw ork is a deep learning framew ork that i s trained using an adve r s arial sy stem. S y n th e tic data t hat adhe r e s to the origi nal dist ri b ut io n is generated t o assist in t h e proc ess of training . U n like ot h e r de ep learni ng mode ls, a GAN c onsis ts of two par ts: a ge n erato r and a discrimina tor. The generato r sy n thesize s images by imit ati ng the original da t a distributio n , w h e r eas the purpos e of the discrimina tor is t o disti nguis h a sa mple a s ei the r genuine or fake. In GANs, the gene rator and d iscrimina tor perfo r m training iterativ ely in se parate , alte rna ting r o u n ds base d o n t h e minimax game-play in g algorithm . First , t h e ge nerato r produc es fake samples from ran do m noise , which c an i n i tially foo l th e discrimina tor. The n the disc riminato r is supp l ie d w it h b o th genuine an d f ake images, and lea rn s t o disti n gu is h th e m. Throug hout the proc ess, the tw o parts update simultaneo usly , and this c onti n ue s until the Nash equil ibrium i s satisf ied. The mi n i max g ame rules t hat b oth the ge n e rator and t h e discrimina tor ob ey th e f o llowing o ptim izatio n prob lem: ~ ~ min max , log log 1 data z x p x G D z p z V D G E D x E D G z (1) D(x) r e prese nt s the p robab ility that x b elong s to the class o f real i mages, rat h e r than fake sa mples. Th e prima ry go al of t he discrimina tor is to calculate the p r ob abilit y at c lose to 1 w h e n the input data is that of r eal images. Whe n fake samples are co nsidered , the pu rpos e of th e dis criminato r is to judge the da ta and l e arn w hat distinguis hes them. S imulta n e ous l y , as D(G(z)) is c los e to 0, th e gen e r a tor aims to a pproac h 1 . This is ess entially a minimax-sty le ga me b etwe en generator and discrimina tor. In e ssence , during the learni ng p hase fo r GA Ns, the aim is to tr ain the m o del D suc h that it can e ff e c tively an d e ff i c ientl y discrimina te the sou r ce of in pu t as eit h e r r ea l o r f ake . Simultaneo usly , mo del G aims t o ge nerate s a mp les that are increasingly c loser to r ea l images . C. AlexNet Ar chitectur e AlexNe t is an architectu re base d on CNN that achiev e s co nvincing succ es s in sc ene classif icatio n t asks a n d has p roven Fig. 1. Frame w ork of the propos e d DC - AL G A N model. T h e purpo se of the generat o r is to pr oduce samples that cannot be di s tinguish ed by the discrimin ator. Th e job of the discriminat or i s to c la ss ify d ata as eith e r g e nuin e or synt hesized. Fe atur e f u s i o n sho ws the co mbi natio n o f high a nd low layer fe ature s. Cla ssificatio n expresse s the box p l o ts of A UC of ROC w hen applying the extra cted features to S VM with tenfold cr oss -validation. Noi se : z G en era tor ( DCG AN ) SV M Rea l i mag e Fak e i mag e D i scr im in a tor (A l ex N e t) Feat u re f u si on Fl a t ten Cl ass i fi ca t i o n data d _ real x ,z ~ p x ,z l E log D x , z z d _ fake x ,z ~ p x ,z l E log 1 D x , z z g _ image z ~ p z l E log 1 D G z mm ii g _ feature i 1 i 1 l f w x bias f w G z bias l d _ fak e l d _real l g _im a ge l g _ fea ture l d l g to be an exc elle nt b asic l e ve l , automat ic sce ne classific ation technolo gy . AlexNet c ontains fiv e c onvo luti o nal l ay ers and three fully -conn e cte d l ay ers. Lo cal r e spo n s e n o rmalizatio n is inco rporated w ithin AlexN et , to improv e n etw or k generalizat ion perfo r ma n c e. Assume that the input sample n i XR denotes th e input data, and 1 , .., i yK expresse s t he co rr es pondi ng g rou n d t r ut h labe l for X i. Furt her, suppo se that t h e AlexN et mo del in c ludes N lay ers, the we igh t co mbinat ions fo r the AlexNe t arc hitecture are 1 , .. , N W W W , and in this ar c h i tectu re, th e relationships be t w een the weig ht pa ramete r s an d the filters ar e r espe ctiv ely show n i n Eq. (2) a nd Eq. (3): nn P f C (2) 1 n n n C W P (3) In Eq. (2) and Eq. (3), C (n) ref ers to the conv olved respo nses on the p r e vio us featur e map; f() is t h e po oling f unctio n on C. P(W) refe r s to the o ut put ob jec tive, w h ic h is de fined in E q. (4): 2 , out out P W w L W w (4) w her e 2 out w and , out L W w are r e spec tively t he margin and squared hinge loss of th e suppo rt vec tor mac hine (SVM ) classif ier. The ov erall l o ss of the o utput lay er , out L W w is show n i n Eq. (5) : , 1 , , , out out N N k L W w w f P y f P y (5) Eq. (5) r e p r e sents th e squa r e d hin ge loss o f th e predictio n error. F r o m t he abov e descriptio n, it can b e unde r s too d t hat, in Eq. (5) , the Ale xNet ar c h i tecture lea rn s the c onvo l utio n kerne ls W. It can predict the labe l and give a st r o ng pus h to h avi ng discrimina tive a n d sensib le fe atur es at eac h lay er. In this w ay , the o verall goal of produci ng a go od classific ation resul t in the output lay er c an be achieve d . AlexN et architec tur e i s show n i n Fig. 2. III. DC - AL GAN A RCHIT ECTURE In this se ctio n , the netw o r k ar c h itec ture o f t he p r o posed mode l, DC - AL GAN , is de scrib ed. A. D i s criminator AlexNe t was utilize d as th e disc riminato r in this wo rk. I t co nta i n s f ive convo l utio n a l lay ers, and eac h o f these follows a ReLU activatio n f un c tio n. Th e ext racted featu r e s me n t ioned in this w ork ref er to output fe atures from th e discrimi nator ’s co nvolutional l ay er. Once traini ng of t he discriminato r is co mplete, t he o ut put of the f inal lay er in the d iscrimi nato r mode l i s r e garded a s t he r e presenta tio n o f the input image . Th e co ncept of fe atur e fusio n, w hi c h co mbin es f eatu r e s f r o m the diffe r e nt convo l utio n a l laye r s, has a posit ive effect on th e f inal classif ication accuracy . The reaso n f o r the improv ement is that more prec ise fe atures a re created duri n g t he fusion p roce ss. All of the conv olution lay er s in t he disc r i minato r a re sub jec t to t he ReLU activation fu nction, and th e slope is set to 0.2. Duri n g training, w e utilize d a sto chastic grad ient desc ent algorithm , w her e the b a tc h size is se t at 64 . Th e Ad am opti mizer is used in the n e tw ork, wit h the learni ng rate set to 0.0002 , and mome n t um β1 as 0 .5. The input images w ere scaled to [-1, 1] befo re t r aini ng t h e n etw ork . This is do n e in orde r to avo id any bias that i s c reated by ver y large or ve ry small n u merical value s. Anot h e r adv antage i s that it cu r b s nume r ica l c omplexi ty during co mputati o n. Whe n the disc rimi n a tor is trained , t h e pa ramete rs of the generato r a r e f ixed. O ptimiz ing t h e d iscrimi nator m e ans maximiz ation of t he dis crimi n a te acc uracy – the r e fore maximiz ing V D in Eq. (6) : , ~ , , ~ , l o g , l o g 1 , da ta z D x z p x z x z p x z V E D x z E D x z (6) Whe n o ptimizi n g t h e d iscrimi nator, it is assumed tha t the generato r has c reated f a ke sa mples. Op timizing the f ir s t item of Eq. (6) means tha t the o ut pu t of the disc r imi nato r i s maximize d w hen in pu t ti ng real images . This is b ecause the p redicti on results o f real images a r e expec ted to be close to 1. As for f ake samples, o ptimizatio n r e su lts s hould be m i nimi zed bec ause th e value s a r e idea lly clo se to 0. T hat is to say , the smalle r the D(G(z)) is, t he be tter th e pe r f o r m ance of t he o ptimiz er is. How ever, i t is co n tradicto ry that w h en the fir s t ite m i s increasing, the sec o n d it e m decreas ing. The r e fore, w e ad just the seco nd i tem fo r 1-D(G(z)). Giv en s uff icient a b i lity fo r t h e d i s crimina tor an d ge n e r a tor to learn, GANs w i ll hav e a glob a l o ptimum. T h e opti mum c an be obtai n e d by sim ple analy sis. First , t he di s c r i minator c an r e ac h an opt imum w hen the ge nerator is fixed. Base d on thi s value , an opt imal functio n o f th e gene rator can be derived. It c an b e prov en that the optimal fu nction r eac h es a glo bal m i nimu m w hen ge n erated dis tr ib utio n coincides wit h t h e actual data distribut ion. Whe n the ge n erato r is f ixed, in o r de r t o ac h ie ve an optimal discrimina tor, the disc riminato r mus t b e trained suc h that V(D, G) is maxi mized, as s h o wn in the fo l low i ng Eq. (7): , lo g log 1 log log 1 data x z z data x g V D G p x D x dx p z D G z dz p x D x p x D x dx (7) Fo r a n y 2 , \ 0 , 0 a b R , f un ct ion lo g log 1 y a y b y Fig. 2. Archite c tur e o f Ale x N e t. T he ReLU activatio n f un c tion i s appli e d to every conv o lutio nal la yer. Size 227 × 227 3 chan nels 27 × 27 256 13 × 13 384 13 × 13 384 13 × 13 256 Conv 11 × 11 5 × 5 5 × 5 5 × 5 5 × 5 1000 FC6 FC7 FC8 Size 4096 4096 Size 55 × 55 96 m ap s achiev es m aximiz ation at the point a ab , and th e r e sult follow s afte r apply in g this fu n ctio n to Eq. (8): * data G data g px Dx p x p x (8) That is, th e o ptimal discrimi nator i s as s h o w n i n Eq. ( 8) w h e n the ge nerator is fixe d. Jensen-S hannon (JS) d ive rgen c e is a method b ased o n Kullbac k-Leib ler ( KL ) div erge n c e t hat me asures the similari t y be t w een tw o p r o b abilit y distributio ns . I t has a sy mm e trical structu re and a limited ra n ge of values. The definit ion fo r JS dive rgen c e is s how n i n Eq. (9): 11 22 KL KL J SD P Q D P M D Q M (9) In the ab ove equality , 1 2 M P Q , P and Q r ep resent prob ability distri b utio n s, r e spec tive l y . KL dive r ge n c e is a method t o measu r e h o w a pro bab ilit y distribut ion dev iates from the standard p rob ability distri b ut io n, as show n in Eq. (1 0) : p log KL px D P Q x dx qx (10) p an d q r e prese nt th e density of pr o b ability di s tr ibutio n s P and Q, respec tively . Whe n data p x p x , it is c lear that 1 2 G Dx . Apply in g Eq. (8) to Eq. (7), Eq. (11) fo llow s where data data px m p x p x and data px n p x p x . , log log log log log 4 log 4 log 2 log 2 log 4 2 log 4 2 2 log 4 G data data data data KL data data KL data V D G p x m p x n dx p x m p x n dx p x dx p x m p x n dx p x p x D p x p x p x D p x JSD p x p x (11) The val ue of the JS div erge nce be twee n two distri b ut io n s is alway s non-neg ative . Also , JSD is zero w h e n data p x p x . Therefo r e, t he glo bal m i nimum is , lo g 4 G V D G . To clarify , whe n the ge nerative distrib ution c oi ncides wit h real data dist ributio n, the functio n reaches a glob al minimum. In the proce ss of training th e disc riminator, l d_real co rrespo n ds to the loss of r eal images. The output of th e disc riminator is expe cted t o b e as cl o se t o 1 as po ssib le . Th is is bec ause t he result i n c r e ases i n acco rdance w ith the pe r f orma nce o f th e discrimina tor. T h e l d_real is : d _ r ea l , ~ , l o g , da ta x z p x z l E D x z (12) The l d_ fak e matc h e s the lo ss o f generated sa mples. T h e outpu t should b e as smal l as po ssib le be cause an ideal discrim inato r w ill l abe l fake samples as 0. The l d_ fak e is : d_ , ~ , l o g 1 , z fa k e x z p x z l E D x z ( 13 ) The disc riminato r loss ( l d ) is co mprised of l d_rea l and l d_ fake __ d d rea l d fake l l l (14) The arc h i tecture of the disc riminato r is show n in Fig. 3. The size o f the input d ata is 512× 5 12× 1, w here 512 rep r e sents the w idth and h eig ht o f the input image, a n d 1 represe nt s the gray image o f 1 c h a nnel. The fi rst lay er o f t h e AlexN et po sse sses 96 co nvolution ke rn els, where the kernel size i s 11× 11, and the stride is se t to 4. Th e im age si ze ev olves into128× 128× 96 through the c onvo l utio n a l l ay er. By performing 4 × 4 max poo l ing w h o se kernel size is 3× 3 and stride i s 2, w e can produce fe atur e m a ps wit h a size of 64× 64× 96. Th e in pu t data of t he seco nd l ay er i s of th e size 64× 64× 96, the n u mbe r of convolutio n kernels is 256, t he kernel size is 5 × 5 and t he stride i s 1. Ot he r parameter values are the same as th o se of th e fir s t la y er. B y perfo rming co n v o luti o n and max-poo l i ng, we can produce 64× 64× 256 and 32× 32× 256 f eature maps, r e spec tively . The third and fo urth layers onl y carried out co n vo l utio n w ith 384 kernels, and t he size o f the d ata so ur ce r e mai n s unc hanged a f te r the R eLU activation functio n . The input of th e fif th laye r is 32× 32× 384, w h e re o th e r p ar a mete rs are t he s ame as the se cond lay er. Af t e r co n v olution a n d m ax - pooling, t h e feature maps a re 32 × 32 × 256 and 16 × 16 × 256, respec tively . Fi nally , the f eature s of dif ferent lay ers are fuse d and flatte n e d fo r the output. B. G e nera tor The generato r is an imp r o v ed n e two r k that i s base d on DCGAN . W hile th e ge n e r a tor c r eates sa mples that are si mila r to the origi nal data, the discriminato r ca n l e arn more prec ise fe atur e s f r o m the input s amples. This compe titive pro ces s has the eff ect of each p romo ting the ot h e r. T h e input of the generato r is a 100 -dimens ional u n if orm dist ributio n z, w h ic h is then co n ve rted into a fo ur -di mensio n a l t e n so r . DC - AL GA N has three mo r e co nvo lutional l ay ers than DCGA N . T h e se ven co nvolutional lay ers are used to gene rate images of 512× 512 pixels i n s i ze . The ReLU activ ation functio n is applie d to a ll of Fig. 3. AlexNet is u s ed as the discri m inat o r, which extra cts m o r e precise features b y u sing featur e f usio n for t he final c la ss ificati on. F1 , F2 and F3 represent the features from t h e la st o ne, t he last t wo a n d t he la s t th ree convoluti o nal layer, re spec tiv e ly. Th e yello w , blue, and gre e n lines r epresent the charac te ri s tic s of the out put of t h e fin al la yer, the second last la yer, and t he third last la ye r, r espectively. 32 × 32 256 5 × 5 S iz e 512 × 512 1 channel S iz e 128 × 128 96 maps 64 × 64 256 32 × 32 384 32 × 32 384 Conv 1 1 × 11 5 × 5 5 × 5 5 × 5 Feature fusion Fl att en F1:2 56 F3:3 84+38 4+256=1024 F2 :3 84+25 6=640 Features the laye r s in the ge n e r ato r, in a ddi tio n to the tanh fu n ctio n, w hi c h is used in the output la y er. Batc h n o rmalizatio n is employ ed in bo th generato r a n d disc r i minato r. Re gardin g the ge n e rato r and t h e mutua l co mpetitio n w i t h t h e discrimina tor, it is expe cted th a t th e output o f th e gene r at ed samples w ill approac h one afte r b ei n g ev aluated. The parameters of th e discrim inator are fixe d when the ge n e rato r is in the trai n i ng p hase. The pu rpose o f tr a ining the ge n e r a tor is to boos t the s co re o f th e sy n thetic sa mples, bringi n g t hem a s clo se to 1 as possib le. This m e ans that D(G(z) ) is inc reased, w h i ch affe cts V G in Eq . (1 5). I n o r de r to bring Eq. (1 5) into line wi th 1-D(G(z)) , we adapt Eq . (1 5) to E q. (1 6) . I n othe r wo rds, optimizi n g the ge n erato r is to realize minimi zing 1-D(G(z)), that is, m inimizing V G in Eq. (1 6 ): ~ l og z G z p z V E D G z (15) ~ l og 1 z G z p z V E D G z (16) In the proc ess of tr ai ning GAN s, the ge n e rato r loss ( l g ) is co mpri se d of l g _image and l g _feature . The l g _image repr e sents t he dev iation b etwee n the ge nerated samples and t h e r e a l image s , as s h o wn i n E q . (17 ). R educing l g _image by cont i nuous l y training the netw o r k and adjusti ng paramete r s will e nhan c e th e generated images, b ringing t hem clo ser t o t h e real ones. _ ~ l og 1 z g ima ge z p z l E D G z (17) The l g _feature de scribe s the dev i at ion b etween t h e o utput o f the generato r and that of the fe ature fusio n lay er. Th e g r e ater the similarity b et we en th e se, t he mo r e ge n ui ne the im ages appe ar. Here , we set f(x) as the activatio n functio n i n the discrimina tor. B oth t he co n v o lutional l ay er and the poo lin g lay er w i ll pos ses s a bias, a n d b e activate d suc h that t he no n line ar c h a racte ri s tics can b e b etter captured . The f ormula of l g _feature is show n i n Eq. (1 8). Samples{x 1 , x 2 , … , x m } co m e from th e G BM dataset, whereas s am p le s {z 1 ,z 2 , … , z m } o riginate f rom th e ran do m noise tenso r, and w represe n ts the co n vo l utio n kernel. _ 11 mm ii g feature ii l f w x bias f w G z bias (18) As a f orementioned , the generato r’s lo ss c ontains t w o pa r ts : l g _image and l g _feature . T h e c omb inati o n of t h e se two kin ds of lo ss increases the precisio n o f th e netwo r k duri ng tr ai ning . Conseque ntly , the sa mple image p r o duced by th e gene rator is increasingly similar to t he real image. I n tu rn, the d iscrim inato r can ext ract more a c curate f eatures, and it imp rov es t he final classif ication accuracy . The fu n c tional exp r es sion of l g is s h o wn in Eq. ( 19 ): __ g g imag e g featu re l l l (19) The arc hitectu r e used fo r t he ge n erator is show n in Fig. 4. C. Class ification Usi ng The SVM Algor ithm The Suppo rt Vecto r Mac h ine (SVM ) was first propo se d by Cortes and Vap nik in 199 5. It has many unique adva ntages i n so lving patte rn reco gn it ion prob l e ms that are n o nlinear , high- dime n sio nal, and have a smal l sample size . Th e architectu re ca n be extended to othe r machi n e lea rning c ases suc h as functio n fitting. A linea r SVM will c r eate a s ituatio n whe re n o t all of th e data will be partitioned; how ever, t he majo rity of th e d ata b e co rr ec tly classifie d. Tenfo ld c r o ss-v alida t ion is used wit h the r egu l a r linea r classif ier L2 -SVM f o r classif icatio n in DC - AL GAN. Th e fe atur e s ext racted f rom the d iscrimi nator are r ega rded as the input to t he SVM fo r class ification. IV. E X PERIMENT S In t his se ctio n, thr e e sets of e xperim e n ts are de scrib ed to ev aluate and compa re the results of our met hod, DC - AL GA N , to oth e r state- of -th e-a rt m e thods . I n the first expe r i ment, the results of DC - AL GAN are co mpared with fo ur relate d classif ication sy stems, including DCGAN , R esN et , DenseNe t and V GG. Th e se co n d experime nt inv olves the analy sis of classif ication r e sults betwe en sets o f la y ers. Specif ically , th e last co n v olutional laye r , the last tw o convolutional l ay ers and the l ast three co n vo l utio nal lay ers r e prese nt e d as F1 , F 2 and F 3, respec tively . In the third experime nt, th e be st-perfo rm i n g co m b i natio n f rom the se co nd e xpe riment (i.e., the features fro m the last two convo lutiona l la y ers) is c hose n and use d f or classif ication, and variatio n s i n k-fo l d c r o ss-validation are co mpar e d with v alues k=5, 10 and 20, respec tive l y . In DC - AL GA N, te nfo ld c r o ss-validation and r egul ar lin e ar classif ier L 2- SVM are used. This mo del use s Te n so r Lay er, w hi c h is a library to fac ili t ate d ee p learni n g (DL) and reinfo rcement learni ng (R L). It is an exte n sio n of Goo gl e TensorF low . Te nsorLaye r prov ides popular DL a n d RL module s th a t ca n be easil y customized and assemb led fo r tackling re al-wo rl d machi ne learni n g prob l e ms. A. C omparison w ith Oth er Models To analy z e th e classific ati o n per f ormance of DC - AL GAN ( DC - AL ) , we c o m pared DCGAN , Res Net , DenseNe t an d VG G . All of th e se archite ctures w ere used in diff er e nt i ating PsP and TTP o f GB M. DC - AL GA N, DCGAN , R es Net , De nseNet and VGG reac h e d an o ve ra l l acc uracy of 0.92 0, 0.844, 0.877, 0 .873 and 0 .862, respec tively . Bo xplots o f th e classif icatio n acc ur a cy for eac h o f the f i v e mo dels are show n in Fig. 5. It ca n be see n that amo n g the five methods , the medi an of DC - AL is muc h highe r t han the o th e rs. This means t hat Fig. 4 . Th e DC - AL G A N generat o r is u sed for GB M datas e ts, which is a modi f i ed net wo rk found ed on deep convolutio n al gen e rativ e adversarial networks. It contains seven co n volutio nal la yers, a nd c a n tra nsform a 100 dimensional u niform ten s or int o 51 2× 512 pixel images. Deconv : 5 × 5 100 z Project and Reshape Size 4 × 4 Maps 1024 8 × 8 512 128 × 128 32 64 × 64 64 16 × 16 256 Size 51 2 × 512 1 chann el 32 × 32 128 256 × 256 16 5 × 5 5 × 5 5 × 5 5 × 5 5 × 5 5 × 5 classif ication usi n g DC - AL is relative l y stable. Bec ause t he ave ra ge va lue i s h e avily in f lue n c ed by extre mes, it is s ome time s unreaso nable to use it as a measu r e. P r ef erably, the media n is a be tter c hoice b ecause it is l e ss likely to be aff ected by ve r y hi gh or ve r y low value s. By examini n g t h e l e ngth of th e box plots, it s h o w s that t h e cl a ss ificatio n a c curacy of DC - AL is r ela tively ce ntralized an d stable . I n co n trast, De n s eNe t is the w orst pe r fo r mer. It ca n be co ncluded t h a t the DC - AL GAN mode l propo s e d in t his pap er achiev es higher classific atio n acc uracy w h en co mpared w it h the prev ious m e thods f o r the task at ha n d . The sa mple i m ages produce d by t h e generato r a t dif ferent epoc h s are s how n i n Fig. 6. Th e last image in the figur e co nsists of real sa mples, w h e r e as the first sev en image s a r e the sampl es produce d by th e ge n e r a tor at d i f ferent epo chs. It is o b vious that as th e num b er of epo chs increases , th e gene r a ted samp le s gradual ly improv e, b eco min g mo r e like the genui ne data. Th e result i s a w ell-trained c omb inati o n of G an d D using o nl y unlabe led samples. Also , D has learned the fe atures from th e data, w hi c h i s b enef icial fo r classif icatio n in the next steps . B. C omparison of Classifica tion Results Usi ng Featur es Extracted from Differ ent Convol utional Lay er Sets In this w ork , A lexNe t has b ee n used as the disc riminato r , w hi c h is also r e spo n s ible f or e xtracting the fe atures used in the final c lassificatio n . Be sides , f eatu re f usio n has be en employ ed to c ombine co ar s e, hig h - l ay er features w ith fin e , l o w-laye r fe atur es . The intentio n is to ensure that th e netwo rk co n tai n s fe atur e s w ith f in e detail, y et retain high - lev el classif icatio n accuracy . Ultimately , t he disc riminato r ext ra c ts fe atur es f r o m the fusio n l ay er. F1 r ep resents t h e f eatures from the f inal co nvolutional lay er, F 2 s how s fe atur es f rom t he last tw o lay er s , and F3 co ntains f eatures f rom the last three lay ers. The results of DC - AL GAN a r e illust rated in Fig . 7. The curve s r e prese nt the a c cu racy for each o f the f eatur e sets . The ove ral l a c curacy a c hiev ed for eac h o f F1, F2 and F3 is 0 .893, 0.920 a nd 0.867 , r es pectiv ely . It is cle ar t h a t th e perfo rmanc e using set F2 is superio r to that o f the ot her s . This means th e co m b i natio n of th e last tw o co n vo luti o n al lay ers results i n the bes t co mbination. Po st-analy sis has sh o w n th a t F3 per f o rms poo r l y co mpar ed to F2. T his is be cause the increase of th e fus ion lay ers leads to lo w-level f eatures w hic h are useless fo r classif ication. Table I contains addi tional statist ics w ith respec t the classif ication pe r f o r m ance. T he calcul ations are as fo llows: Sensitiv ity = TP/( TP + FN). Spec ificity = TN/(FP + T N). Precisio n = TP /(TP + FP ). Whe re TP, FP , FN and TN refe r to true pos iti v e, false pos iti v e, false n ega tive and true n e gative , respec tively . Fig. 8 show s th e confus ion m atrix f or eac h of the three expe r i ments. As see n i n prev ious cha r ts and table s, th e model created us ing F2 is clea rly the top pe r f orm e r . TABLE I C OMPARISON OF C L ASSIFICAT I ON P ERFORMANCE U SING D IFFERENT F E A TURES Method s Sensitivit y Specificity Precision DC -AL GAN_ F 1 0.91 2 0.74 7 0.88 1 DC -AL GAN_ F 2 0.97 6 0.88 3 0.94 5 DC -AL GAN_ F 3 0.92 9 0.83 3 0.92 0 Fig. 6 . DC - AL GAN-g e nerat ed GBM ima ges u sing u nlabeled sa m ples shown at different e pochs. Th e first r ow r epresents ep och 0, epoch 5, epo ch 1 0, and epoch 1 5 from left to rig h t. The se c on d ro w show s epoch 2 0, epoch 25, ep och 26 and the r e al i m ag e fro m the G BM dataset. Fig. 8. (a) – (c ) correspond to t he c o nfu s io n matrix o f DC – AL G AN with feature s F1, F2 an d F3, r espectively. Fig. 7 . Th e cla ss ificatio n a ccuracy of DC -AL GAN wit h fe atur es F1, F2 a nd F3. Fig. 5. B oxplot s of th e classificat ion a cc urac y of t he f ive mo d el s : DC - AL GAN (DC -A L) , D CGAN, ResNe t, D enseNet and VG G. C. Com parison of Results for Differing Levels of Cross- Validation Using F2 Fig. 9(a) and Fig. 9(b) are bo xpl o t represe ntations o f accuracy and AU C of R OC, r e spec tive l y . Fig. 9(c) , s h o w s that the ave ra ge accu ra c ies we r e 0.902, 0.920 and 0.916 w h en CV=5, 10 an d 20, r e spec tive l y . Th es e r esults indica te that this approac h ha s a promisi ng dif fe ren t iation capab ility . Th e respec tive v alues fo r the AU C ar e 0.886, 0.947 an d 0.931 . In addition, as s how n i n Fig . 9(d), th e p-values be tween perfo rman c es with diff er e n t r e pea ted ti mes a r e a ll gre ater t han 0.05. Theref o r e , the dif fe ren c e in perfo r ma n c e is insignif ica nt and al lo w s us to conclude that the c lassificat ion sy stem is stable . In thi s sec tion, t h e pe rfo r ma n c e of diff er e n t cross -validatio n value s is co m pa r e d throug h the r e ce ive r operati n g c h arac teristic curve s. T h e R OC curve s co r respo nd to 5, 10 and 20 CV repetitio n s , as show n in Fig. 10. T h e resul ts show that this metho d ac hi e ve s t he b est perfo r ma n c e with 1 0 CV r e pet itio ns. In a r e a s onable r a nge, appropriate ly in c reasi ng the numbe r of folds of cross-validation can imp rov e th e generaliza tion abili t y of the mo del and lead to be tter pe r f o r m ance. Howe ver, t he co mputati o n a l load should also be co n sider ed at t h e same tim e. Fo r example , w h e n CV is increase d f r o m 5 to 10, the perfo rman c e o f t h e mo del is o bv i ously imp r o v ed. When CV is increased f rom 10 to 20, t h e o utput results do n o t c hange sig n if icantly , but t he calculatio n time is doub l e d. So in t his paper, w e adopt 10 CV r epe titions . In Fi g. 1 0(a ) – (c), the a r e as under th e R OC curv es ar e clo se to 1, an d th e TPR values are greater than 0.8. The areas under the R OC c ur v es of the 5 and 20 CV repetitio n are s malle r than 10 . Co n s equently , t he expe r i mental results confirm t h a t this method has a be tte r generalizat ion capab ility . V. C ONCLUSIONS A ND F U T URE W ORK This pape r introduc es an un supe r v ised r e prese n ta tio n learning a l go r i thm called DC - AL G AN. It is capable of l e arni n g inte r p retable r ep r es entations, ev en f rom challe nging GBM datase ts. AlexN et is an integral c ompo nent in the architec ture w her e i t is used as a disc riminato r to ext ract f eatures. The results show that t he disc r i minato r can extract f eatures that wo rk effe ctively fo r classif icatio n . I t does so by obse rvin g and analy z ing th e s ample ima ges created by th e generato r. A l s o , DC - AL GAN utilize s f eature f usion by c ombining co arse , high- lay er f eatures wit h f ine, low -l ay er features. This has s how n to be benefic ial in terms of classific ation perfo r mance. In summa ry, the e xpe rimental results h av e c o n f i rmed that DC - AL GAN ac hi e ve s hi g h accuracy on G BM da tasets for PsP and TTP classif ication. Ot h e r pos sible f utur e imp rov ement s t o t h e w or k propo sed in this paper include: opti mizing th e ar c hit e ctu re of the generato r t o produc e high-qual ity sampl e s of i ma ges and classify in g images in a semi-supe r v ised manne r to lo we r th e demand for lab el ed dat a. R EFERENCES [1] F. E. B leeker, R. J. Mol e naar, a nd L. Si eger, “ R ecen t a dvances in t he molecular under s tandi n g o f glioblastoma , ” J ourna l of Ne uro-O ncology, vol. 108, p p. 11 - 27, 20 12. [2] T. J. Kruser, M . P. M ehta, a nd H . I. R obins, “ Pseudoprogre ssion after glioma t h erap y: a c om pre hens iv e r eview, ” Exp ert Revie w of Neuro therapeutics , vol. 13, p p. 389 - 40 2, 2013 . [3] E. R. Gerstn e r, M. B. Mcnamara, A. D . N orden, D. La f ra n kie, and P. Y. Wen, “ E ffect of a dding te mozolomide t o radia tion therapy o n t h e incidenc e of pseudo -p r o gre ss io n , ” Journ al of Ne uro-On cology, vol. 9 4, pp. 97-101, 20 09. [4] T. Wa lter, B. Die ta, H. G. Bruin , De, J . E . Br omberg , A. T. Swaak - Kragten, P . A. E. S. S m itt , et al. , “ I n cide nc e of early p se ud o-progre ss ion in a cohort of maligna n t g lioma patient s tr eated wi t h chem o irra d iati o n with te m ozolo m ide, ” Cancer, vol. 11 3, pp. 405 -410, 201 0. [5] P. H e nri - Be n ja m in, S. Nilou far, B. Daniell e , M. Christian, D . W. Oli v ier, and L. F lo re nce, “ Hig h le vels of cellu lar proliferati o n predict pseudopro g ressio n in g l iobl a s to m a patient s, ” Interna tional Journal of Onco logy, vol. 40, pp. 92 3 - 9 28, 201 2. [6] A . A . Bra ndes, F. Enrico, T . Al i ci a, B. V aler ia, P. Annalisa, T. Gi ovanni , et al. , “ M GMT pr omoter methylation status can pr e dict the inciden ce and outcome of p se udopro g r essi on a fter con c omitan t ra dioche m othera py in newly diag n ose d glio bl a s to m a pat ien ts , ” Jou rnal of Clinical On cology Official Jo urna l o f th e American Soc iety of Clin ical Onco logy, v ol. 26 , p p . 2192 -7, 20 08. [7] I. Melguizo - Gavilan es, J. M . Bru ner, N. Guha - Thaku rta, K. R. Hess, and V. K . Puduvalli, “ Charact erization o f pseudoprogr ession in p ati en t s with gliobla s toma: is histology the g old s tandar d?, ” Journ al o f Neur o- Onco logy, vol. 123 , pp. 141 - 150 , 201 5. [8] H. Josie, T . H e l e ne, T. C h arl ot te , D . Alastair, B. Marjorie, T . A. Hu ghes , et al. , “ Predict ion of c linical outcom e in gliobla s to m a using a biologically relevant nine- m icroRN A signature, ” M olecu lar On cology , vol. 9, pp . 7 04- 714 , 20 1 5. [9] L. C. Hy g in o da Cruz, Jr., I. Ro driguez, R. C. D omingues, E. L. Gasparetto, and A. G . Sor ensen, “ Pseudoprogr ession an d pseud o respons e : imaging challenges i n th e assessment of p osttr e at m ent glioma, ” AJNR Am J Neuro radiol, vol. 32, pp. 19 78-85, Dec 2011. [10] J. A. Holmes, A. K. Paulsson, B. R . Pa g e, L. D . Mi l l e r, W. Liu, J . Xu , e t al. , “ Geno m ic p redictors of p att e r n s o f progressio n in glioblastoma a nd possible in f lu ences on ra diation fi eld design, ” Jou rnal o f Ne uro-On cology, vol. 124, p p. 447 -453, 201 5. [11] R. G. Y oon, H. S . K i m , W. Paik, W. H . Shi m , J. K. Sang, a nd J. H. K im, “ Different diagnos tic value s o f imagin g para me t e rs to predict pseudopro g ressio n in gli oblastoma s u b grou ps strat if i e d by MG M T promoter met hyl ati on, ” Euro pean R ad iol ogy , vol. 27, pp. 1 -12, 201 7. 5 10 20 0.44 7 0.05 2 Accuracy 0.9 0 2 0.9 2 0 0.9 1 6 0.6 1 7 0.29 7 AUC 0.8 9 0 0.9 4 8 0.9 2 7 0.6 1 2 0.38 7 Fig. 9. (a) Accurac y c o rresp o ndin g to C V = 5, 10 and 2 0. ( b ) Area un der the curve o f r eceiver operatin g c h arac teristics (ROC ). ( c) M e an valu es for accuracy and AUC . (d) P-valu es, c alculat ed wit h t - te s t, for accura c y and AUC results . Fig. 10. ROC c ur ves of these me thods with 5, 10 and 20 C V re p etitio ns. ( d) ( c) 5 10 20 A A CCU RACY 5 10 20 P-VALUE 8 8 8 8 8 8 MEAN VAL U E A UC 5 10 20 5 10 20 [12] Motegi, Hiroaki, Ka moshima, Yu uta, Tera s aka, Shun s uke , et al . , “ IDH1 mutation a s a potent ial novel biomarker fo r distingui s hing;p seudop r ogression f r om tru e progression in pati ents with gliobla s toma;tr e ated w ith temozolo m ide an d radioth e ra p y, ” Brain Tumor P atho logy, vol . 30, pp. 67-72, 201 3. [13] H. C . K a n g, C. Y. Kim, J. H. Han , G. Y. Choe, J. H. Kim, J. H . Kim , et al. , “ Pseudopro g r ess i o n in patie n ts with m al ignant gliomas tr e ated with concurr e nt temozol o mide and ra dioth e rapy: potent ial rol e of p53, ” Jou rn al of ne uro-onc ology, vol. 10 2, pp. 157 - 62, 20 11. [14] H. Yanai, H. N e gi s hi, and T. Ta n iguc h i, “ T he IRF family o f tran sc ripti o n factors: Ince p tion, i mp a c t and i m pli c ati o ns in on c og e nesis, ” Onco immunology , vol. 1, p. 1 376, 201 2. [15] K. W. Cal decott, J. D . Tucker, L. H. Stanker, and L. H. Thompson, “ Characterizat ion of th e XRCC1 - DN A ligase III compl e x in v itro and its absence f ro m muta nt hamster cell s , ” Nu cleic Acids Resear ch , vol. 23, pp. 4836 -43, 1995. [16] K. D - S, S . T. Ki m , K . E -H, D . H. Lim, W. S. Kim, S. Y - L , et al. , “ Diagno s tic d ilem m a of pseudo p r o gressio n i n the trea tment of n ewly diagno s ed gl ioblastoma s : the r o le of a ssessing r e lat ive cer ebral bl o od flow volume a nd oxy gen- 6 -methylguanine - DN A methyltran sferase pr omote r methylati o n s tatu s , ” Ajnr Ame rican Jou rnal of Neur oradiolo g y, vol. 32, p. 382, 201 1. [17] M. C. Pinho, P. P a vl i n a, K. C. Ja y a s hree, J . D ominique, K. E. Embl e m, R. K. Jai n , et al. , “ Lo w incide nc e of pseudopro gression by i m aging in newly diagno s ed gliobla s to m a pati ents treat ed w ith c e diranib in combinati o n with che m oradiat ion, ” Oncolog ist, vol. 19 , pp. 75 -81, 2014 . [18] C. K . Park , J. W. Kim, Y. Y. S u, A. R. Lee, J. H . Han , C. Y. Kim , et al. , “ Usefulnes s o f MS -MLP A f or detection o f M G MT promot e r methylati o n in th e ev alua tion of pseudo p rogre ss io n in g lioblasto m a patient s , ” Neur o- onc ology, vo l. 13 , p. 19 5, 2011. [19] J. C ha, ., S. T. K im, K. H -J, K . B-J, Y . K. Kim, J . Y . Lee , et al. , “ Differentiati on of tum o r pro g r ess i o n from p se ud o pro g r e ssion in pati e nts with posttreat me nt gliobla s to m a using multi p aram e tric histo g ram analysis, ” A j nr American Journ al of Neuro radiolo g y, vol. 3 5, p. 130 9, 2014. [20] K. H o Sung, G. Myeo n g Ju, K. Namkug, C. Choong Gon, K. S. J oon, and K. Jeong Hoon, “ Which combinati o n of MR imaging modaliti es is best for pre d ictin g re c urr ent gliobla s to m a? S tudy of dia gnostic ac c uracy a nd reproducibilit y , ” Radiolog y, vol. 273 , pp. 831 - 43 , 2014. [21] C. H ee H o, C . S eung H ong, R . I nseon, K. Soo Chin, J . A. Y eom, S. Hwaseon , et al. , “ D ifferentia tion of True Progressio n f r o m Pseudopr o gressio n in Gli ob la s to m a Treat e d with Radiatio n T he ra py a n d Concomita n t Temozol omide: C ompari s on Study of Stan dard a nd Hi gh-b- Value Di ff u sion-we ighted Imagin g , ” Rad iology, vol. 26 9, pp. 831 - 840 , 2013. [22] Z. C. Liu, L. F. Y an, Y. C. Hu, Y. Z. Su n , Q. Tian, H . Y . Nan , et al. , “ Combinat ion o f IVIM - DWI and 3D -AS L for differ e ntiati ng true progressio n fro m pseud o pro g r ession of G lioblasto m a multi fo rm e a fter concurr e nt ch em oradi o t herapy: stud y prot oc ol of a p ro spective diag nos tic trial, ” BMC Med Imagin g, vol. 17, p. 10 , Fe b 1 201 7. [23] C. H. Suh, H. S. K im, Y. J. C hoi, N . Kim, ., a nd S . J. Kim , “ Predi c tion of pseudopro gression i n patient s with gliobla s to m as u sing t he initial a n d final area under the cur ves ratio d e ri ve d fro m d y namic con tras t - enhanc e d T1 - weight e d per f u s ion M R i maging, ” A j n r American J ourna l o f Neuro radiology, vol. 34, pp. 2278 - 228 6, 2013. [24] K. Parv e z, A. Par vez, a nd G. Za deh, “ T he diagn os is a n d tr e at m ent of pseudopro g ressio n , radiati o n necro s is and brain tum o r recurrenc e , ” Int J Mol Sci, v o l. 1 5, pp. 1183 2-46, Jul 3 20 14. [25] N. Verma, M. C. C owperthwaite, M. G. Burn e tt, and M. K. Mark ey, “ Differentiati ng tumor recurr e nce from treat ment necro s is: a review o f ne ur o-oncologic imagin g strategie s , ” Neuro Onco l, vol. 1 5, p p. 515 - 34, May 2013 . [26] S. Wang, M. M ar tinez-Lag e , Y. Sakai, S. Chawla, S. G. K im , M. Alon s o - Basanta , et al. , “ Di fferentiatin g T umor Progressio n from Pseudopr o gressio n in P ati e nt s w ith G lioblasto m a s Us in g Di ff u s i o n Tensor I m a ging a n d D ynamic Susce p tibil i ty C ontrast MRI, ” Amer ican Jou rn al of Neu roradio lo gy, vol. 59 , pp. 355-357 , 20 15. [27] X. Qian , H. T an, J . Zhan g , W. Z hao, M. D. C h an, a nd X. Z ho u, “ Stratificatio n of pseudopr o gres s ion and true progr ess ion o f glio b la s to m a multiform based on l o ngitu d inal diffusio n t ensor i m a ging w ithout segmentatio n , ” Med Phys, vol. 43 , p. 588 9, No v 20 16. [28] A. Ag ar w al , S. K u m ar, J . Nara ng, L. S ch ul tz, T. Mikkelse n , S. Wan g , et al. , “ Morphol ogic MRI featur es, di ff u sion tensor im a ging a nd ra d iation dosimetri c a nalysi s t o diffe rentiate pseudo -p r o gres sion fro m e arly tumor progressio n , ” J Neu roonc ol, v ol. 112 , pp. 413 - 20, M ay 20 13. [29] G. Verma, S. Chawla, S. Mo han , S. Wa n g, M. Na s ralla h , S. Sheri ff , et a l. , “ T h ree-dimen s ional echo planar sp ectro scopic imagin g for d iffer e ntiati o n of tru e progr ession from pse u d opr ogression in patients wi t h glioblastoma, ” NMR Biomed , v ol. 32, p . e4042 , Feb 2019. [30] N. C. F. Code ll a, J. Cai, M. Abedi n i, R . Ga rnavi, A. Halpern, a nd J. R. Smith, Dee p Learn ing, Sp arse Co ding, and SVM for Mela noma Recog nition in Dermo scopy Image s , 2015. [31] K. H e , X. Zhan g , S. R e n, an d J. Su n, “ Deep R es idua l L e arning fo r Ima ge Recognition, ” 2015. [32] K. Simo n yan and A. Zisserma n , “ Very deep con v olutional networks f or large- s cale imag e rec o gni tion, ” 2015. [33] Z. Ya n, Y. Zhan, Z. Peng, L. Shu, Y. Shi n aga w a, S. Zhang , et a l. , “ M ulti - Instance D eep Learni ng: D iscover Di scriminative Local Anat omies for Bodypart Re cogni tio n , ” I EEE Transa ctions on Medic al Imaging, vol. 35, pp. 1332 - 134 3, 2016 . [34] N. Tajbak hs h, J. Y. Shin, S. R. Gurudu, R. T . Hurst, C. B. Ke n dall, M. B. Gotway , e t a l. , “ Convoluti onal N e ural Net wo rks for Medi c al I mage Analysi s : Full Tra in ing or Fine Tuni n g?, ” IE EE Transa ctions on Medical Imag ing, vo l. 35 , pp. 1299 - 131 2, 2016 . [35] H. C. Shin, H. R. Roth, M. Gao , L. Lu, Z . Xu, I . N ogues , et al. , “ D eep Convolutio n al N eural Net w ork s fo r C omputer -Aided D e te c tio n : CNN Architectur es, Da taset Chara c teristi cs and Tra nsfer L e ar n i n g, ” IEEE Transa ctions on Medica l Imag ing, vol. 35, pp. 12 85-129 8, 2016. [36] G. Litjens, T . Kooi, B. Ehteshami Bejn o rdi, A. A rindra Adiyoso Setio, F. Ciompi, M. Gha foo ria n , et al . , “ A Surv e y on D e ep Learni n g in M e d ic al Image A nalysis, ” 2017. [37] C. Wang, X. Yan, M. S m ith, K . Ko c hhar, M. Ru b in, S. M. Warr en , et al. , “ A uni fied f ra mewo rk for au tomatic wound segmentati on a nd a nalysis with deep c on v olutional neural net w orks, ” in Engine ering in Medicine & Biology Society , 20 15. [38] M. Zreik , T . L ei ner, B. D . D. Vos, R. W. V. Ha mersvelt, M. A. Viergever, and I. Isgum, “ A uto m ati c Seg m entatio n o f the Le f t Ventricle in Car d iac CT Angiography Using C onvolutio n al N eural Network, ” i n IEEE Intern ational Sy m posiu m on Biomedica l Imag in g , 201 6. [39] S. Pereira, A. Pin to, V. Alves, and C. A . S ilva, “ Brai n Tu m or Segmentati o n using Convo lut ional N e ural Networks in MRI Ima ges, ” IEEE Transa ctions on M edica l Imaging, v ol. 35, pp. 1240 - 125 1, 2016. [40] Q. Li, W. Cai, X. Wan g, Y. Zh ou, D . D. F eng, and M. Chen, “ M e dical image c las s ificatio n with c onvolutional n e ura l network, ” in Inter nationa l Confe rence on Con trol Automation Rob otics & V is ion , 20 14. [41] A. Karpat hy, G . To d eri c i, S. S h ett y , T. Leu ng, and F. F. Li, “ Large -Scale Video Cla ss ificat ion with Conv o luti onal Neural Net wo rks, ” in Compu ter Vision & Pattern Recog nition , 20 14. [42] J. Zhao, M. Z hang, Z . Zh ou, J. Chu, and F. Cao, “ A utomatic detection a n d classificatio n of leuk ocytes usin g conv o luti o nal neural netw o rks, ” Medical & Biolog ical E ng ineering & Compu ti ng , vol. 55, pp. 1 -15, 2016. [43] S. Sarra f a nd G . T ofighi, “ Cla ss i fication of Alzh e im e r's Disease u s ing fMRI Data a nd D eep Learning Co nvolutional Neural N etworks, ” 2016. [44] A. Rajkomar , S. Linga m , A . G. Ta y l o r, M . B lum, and J. Mon gan , “ Hi g h- Throughput Cla ss i fic atio n o f Radio g rap hs Usin g De e p Conv o luti o nal Neural N e tw o rk s , ” Jou rnal of Digital Imaging , vol. 30, pp. 95 - 10 1, 2 017. [45] I. J. Goodfello w , J. Poug e t -Abadie, M. Mir z a, X. Bi n g, D. Ward e-Farley, S. Ozai r , e t al. , “ G enerative Adversarial Net s, ” i n Inter nationa l Confe rence on Neur al Information P ro cessing S ystems , 2014. [46] A. Cre sw ell, T . Whit e , V. Dum o uli n , A. Kai, B . Se ngupt a, a nd A. A. Bharath, “ Generative Adversaria l N etwork s : An O verview, ” IEE E S ignal P roc essing Maga zine , v o l. 35 , pp. 5 3-65, 2017 . [47] J. T. Sprin g enberg , “ Uns up e rvi se d a nd Semi -s up e rvi se d L e ar ning w it h Categori c al G e nerativ e Ad v ersaria l N e tw o rks, ” Compute r Science , 2015. [48] A. O den a, “ S emi-Super v is ed Learnin g with G enerative Adversarial Network s , ” 2016. [49] L. Zh u, Y. Chen, P . G hamisi, and J. A tli B enediktsson, “ G enerative Adversarial N etworks for H y per spectral Image Cla ss i fication,” 2018. [50] M. Mir z a and S. O s indero, “ Conditional G ene rativ e Adversarial Nets, ” Comp uter Science, pp. 267 2-2680 , 201 4. [51] Z. Yi ng, H . Dan, Y. Wang, a nd X. Yu, “ Semi s uper v ised Hyper s pectral Image Classifi c ation Ba se d on G enerative Adver s arial N e twork s, ” IEEE Geos cience & Remote Se nsing Letters, v o l . 15, pp. 1 -5, 2017. [52] T . Salimans, I. G oodfe l low, W. Zaremba, V . Cheun g , A . Rad f ord, an d C. Xi, “ Impro ved Techniques f or Tra in in g G A N s , ” 2016. [53] T . S. V irdi, J. T. Gui b a s , an d P. S. Li, “ S y nthetic Medical I m ag es from Dual Genera tive Adversarial N etworks, ” 2018. [54] Z. Zhong and J. Li, “ G enerative Adver s arial N e twork s a nd Probab il i s tic Graph Mo d el s for H ype rs pectral Imag e Classifi cation, ” 2018. [55] A. Per ez , G . Swetava, S . Ermo n , G. Azzari, M. Burke , an d D . Lobell, “ Semi-Sup e rvi sed Mu lt ita s k Learni n g on Multi s pectral Satellit e I mages Using Was se r s tein G enerative Adv e rsaria l N etworks (G A Ns) fo r Predicting P ove rt y , ” 2017. [56] A. Ra dford, L. M etz, a n d S. C hintala, “ U nsupervi sed R e pre sent ati o n Learning with D eep C onvolutio n al G enerative Adversarial N etworks, ” 2016. [57] A. Krizhevsky, I. Sut s kev e r, a nd G. E. Hi nton, “ Imag e N e t C lassification with Deep C o nvoluti o nal Neural N etwork s , ” i n Intern ational Con ference on Neu ral Informa ti on P ro cessing S ystems , 20 1 2. [58] X. Han , Y. Z h on g , L. Cao , an d L. Zhan g, “ P re-Trai ned A lexNet Architectur e w ith Pyra m id Pooling and Super v isio n for H ig h Spatial Resolution Remote Sensing I m age Sc ene Classificatio n , ” Re mote Sen sing, vol. 9, p. 84 8, 2017. [59] S. Petscharnig an d K . Schoe ffm a n n, “ L earning laparo scopic video shot classificatio n for gynecol o gical surgery, ” Multimed ia Tools & Applica ti on s, p p. 1 - 19 , 201 7.
Original Paper
Loading high-quality paper...
Comments & Academic Discussion
Loading comments...
Leave a Comment