Mixing autoencoder with classifier: conceptual data visualization
In this short paper, a neural network that is able to form a low dimensional topological hidden representation is explained. The neural network can be trained as an autoencoder, a classifier or mix of both, and produces different low dimensional topo…
Authors: Pitoyo Hartono
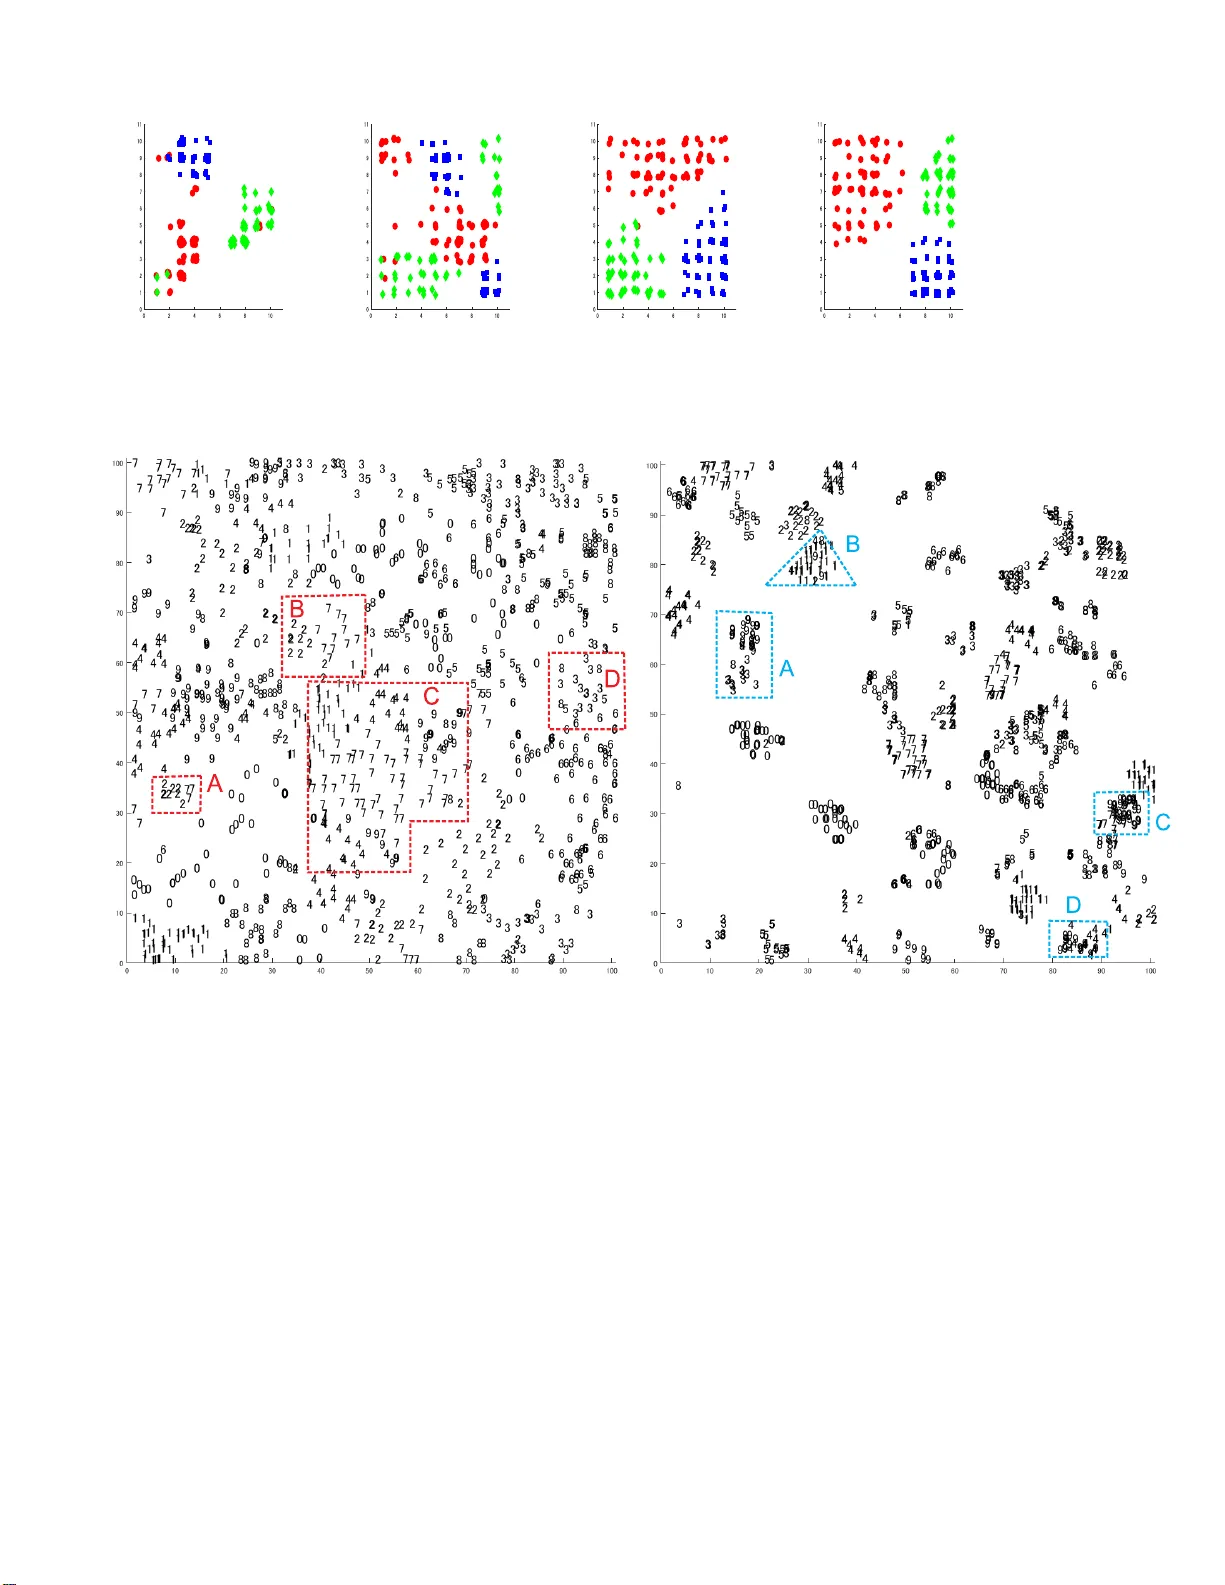
1 Mixing autoencoder with classifier : conceptual data visualization Pito yo Har t ono Abstract —In this shor t paper , a neural network t hat is able to f or m a low dimensional topological hidden representation is explained. The neural network can be trained as an autoencoder , a classifier or m ix of both, and produces different lo w dimensional topological map f or each of them. When it is t rained as an autoencoder, the inherent topological structure of the data can be visualized, while when it is t rained as a classifier , the topological struct ure is f ur ther constrained by the concept, for example the labels the data, hence the visualization is not only structural but also conceptual. The proposed neural network significantly differs from many dimensional reduction m odels, prim arily in its abilit y to ex ecute both supervised and unsupervised di m ensional reduction. The neural network allows multi perspective visualizati on of t he data, and thus giving more flexibility in data analysis. This paper is suppor ted by prelimi nar y but i ntuitive visualization experiments. Index T erms —Dimensional Reduction, Autoencoders , Supervsised l earning T opological Representation, Visualization ✦ 1 I N T R O D U C T IO N In this study , a neural network that is able to form contextual topological map in its hidden layer is explained. Over the past years rich co llectio n s of machine learning methods for visualizing high dimensional data throu gh dim ensional reduction hav e been proposed. Many of them form low dimensional representation while optimizing so me criteria to preserve inherent characteristics of the data. For example Stochastic Neighb orhood Embedding (SNE) [1] and its variants [2], [3] reduce hig h dimensional data while preserving their stochastic neighborhood structure. Locally Linear Embedd ing (LLE ) [4] is a no nliner dimensional reduction method that lo cally preserves the dep endency of high dimension al data, while is omatric mapping (isomap) [5], [6] is also a no nlinear dimension al reduction mapp ing that p reserves the geod es ic structu re of h igh dimensional data. K ohonen’ s Self- organizing maps (SOM) [7], [8] is a popu lar dim ensional reduction and visualization method that p reserves the topo logical structure of high dim en sional data in low dimensional space. Recently , Uniform Manifold App roximation and Projection (UMAP) [9], a manifold learning techniq ue fo r dimensio nal reduction based on Riemannian geometry was proposed and results in h ig h quality visualization with s calable calculation time. All th ose methods ex- ecute unsup ervised mappin g for primarily visu alizin g app lication- rele vant structu re of high d imensional data, but igno re the contexts (for example, labels) of the data. There are als o many su p ervised dimension al reduction algorith m s that take the context of the data into account. These metho ds form low dimensional representations of high dimensional data by preserving their inherent structu res that are relev ant to their labels. Thus, th e representation is not only structural but also conceptu al. Som e examples of su pervised dimension al reduction meth ods are as follow s. Neighborho od Compon ent Analysis (NCA) [10] that forms low dimension al rep- resentations on which th e classification rate of k-nearest neighbo r is maximized, a semi-su pervised version o f Iso map is propos ed in ‚ P . Hartono is wit h the Department of El ectric al a nd El ectron i cs Engineer- ing, Chukyo Unive rsity , Nagoya, Japan E-mail: hartono@ieee.org [11] and a comb ination of Multidim en sional Scaling (MDS) [12] [13] and SOM that can either be sup ervised or unsupervised was proposed in [14]. While the methods above were able to generate visu alization on the hig h dimensional data, th ey are either supervis ed or unsupervised . Howe ver , data analysis som etim es requires multi perspectiv es in extracting insightful info rmatio n. Changing the methods to learn diff erent aspect of the d ata is often p roblematic, since all th e metho ds execute different criteria in reducing the dimension of the data. Sometim es , the dimensional reduction and the v isualization are executed with dif ferent algorithms, for example in [15], s tacked-autoencoders was executed to reduce the dimension of the data, and t-SNE was executed to visualize them. It shou ld b e noted, that each dimension al reduction results in lost of information in different way , so running them in tandem will not only reduce the representation fidelity but will also infuse interpretation unclarity to the low d imensional representation space. In this study , a neural network that is able to form low dimension al representation in its hid den layer is explained. Dif- ferent from the m ost of the dimen s ional reduction method, this neural network is able to execute supervised learning, unsu- pervised learning or mix of them in o ne learning framework, by co ntrolling a single coef ficient in th e learning process. The proposed neu ral network is built based on the previously p roposed Restricted Radial Basis Functio n Network (r-RBF) [16], [17] th at is a h ierarchical supervis ed neural network that generates two dimension al top o logical representation in its hidden layer . Here, the o utput layer and the learnin g process is modified, so that the network can be trained as an autoencod er, a classifier o r a m ix of both. When the network is trained as an autoencoder , it forms a low dimen sional representation th at enco des a relev ant topo logical structure to reconstruct the high dim en sional input, and thus allows the visu alization on the in herent structure o f the data. When it is trained as a classifier , the hid den representation is constrained by the labels of the data, so the visualization is not only structural but also conceptual, in that differ ent labeling of th e same d ata will p roduce d if ferent representation . The network can also be 2 trained b y mix in g the auto en coder and classifier , resu lting in flexible representations, where th e differ ence between th e in h erent vectorial characteristics and the characteristics con ceptualized by the labels of the d ata can be learned. This sho rt paper explains the structure and learning d ynamics of the proposed n eural n etwork, and th e result o f th e preliminary experiments. 2 S O F T - S U P E RV I S E D T O P O L O G I C A L A U T O E N - C O D E R The outline of Soft-supervised T o pological Auto encoder (ST A) is illustrated in Fig. 1. Here, a three -layered ST A, in which the hidden layer is a topolog ical layer where the n eu rons are allgn ed in two dimensio n al grid s imilar to Kohenen’ s Self-Organizing Maps (SOM). The ou tput layer is co mposed from two parts, decod er part that reconstructs the encoded input and classifier part that predicts the labels of the inp ut. In the training process, a mix ing parameter is s et to control th e weightings of the decoder part and classifier part, hence the ST A can be trained as an autoenco d er , a classifier or a mix of b oth. Here, similar to K ohon en’ s SOM, due to its low d imensional- ity , it is possib le to v isualize the inputs’ top ographical representa- tion, and discover the their ch aracteristics. Howe ver , differ en t from SOM that top ologically p reserves the topological structures of th e high dimens ional inputs into their two d imensional representation, the h id den representations are also regulated by the error signal backpropagated from th e outp ut layer . In the case th at ST A is trained as an auto encoder , the hidden topological representation is formed to encod e topolo gical structure that enables ST A to reconstruct the inputs. In the case of a classifier, the to pological structure is further constrained b y the requ irement to p redict the output. The dy n amics of ST A is explained as follows. win “ arg min j } X ´ W j } (1) H j “ σ p j, win, t q e ´ } X ´ W j } 2 σ 2 (2) σ p j, win , t q “ exp p´ dist p w i n, i q{ S p t qq (3) S p t q “ σ 8 ` 1 2 p σ 0 ´ σ 8 qp 1 ` cos π t t 8 q For a high dimension al input X P R d , ST A selects the best matching un it, w in among all the reference vectors associated with the hidden units of ST A as in Eq. 1 , where W j P R d is the reference vector associated with the j -th hidd en un it. In Eq.3 σ 0 ą σ 8 ą 0 are the initial and final va lu es of th e annealing term, t is the current epoch, wh ile t 8 is the termination epoch. The values of th e k -th decod er neu ro n , O dec k , and the l label neuron, 0 cls l in the o utput layer are defined in Eq. 4 where f p x q “ 1 1 ` e ´ x O dec k “ f pp V enc k q t H q O cls l “ f pp V cls l q t H q (4) Here, V enc k denotes the weight vector leading from the hid den layer to the k -th d ecoder neuron, V cls l denotes the weig h t vector leading from the h idden layer to the l -th class neuron in th e ou tput Fig. 1: Outline of Soft-sup ervised T opological Encod er layer , wh ile H “ p H 1 , H 2 , ¨ ¨ ¨ , H N hid q t is the hid den layer output vector in which N hid is the num ber of hid den neurons. The cost function is defined in Eq. 5 , in which 0 ď κ ď 1 is the m ixing coefficient, Here, κ “ 0 generates an autoencoder , while κ “ 1 generates a classifier . L “ p 1 ´ κ q 2 ÿ k p O dec k ´ X k q 2 ` κ 2 ÿ l p O cls l ´ T l q 2 (5) Applying sto chastic g radient descent, the modifications of connection weights from th e hidd en layer to the outp ut lay ers are calculated from the gradients as follows. ∆ V dec k “ B L B V dec k “ p 1 ´ κ qp O dec k ´ X k q O dec k p 1 ´ O dec k q H “ p 1 ´ κ q δ dec k H (6) ∆ V cls l “ B L B V cls l “ κ p O cls l ´ T l q O cls l p 1 ´ O cls l q H “ κδ cls l H (7) In Eq. 7 and Eq. 7, δ dec k and δ cls l are the error signals backpropagated from th e k -th decod er neuron and the l -th lab el neuron, respectively . The modification s of reference vectors associated with the j -th hidden n euron can be calculated from the gradient as follows. B L B W j “ B L B O dec k B O dec k B W j ` B L B O cls k B O cls k B W j “ δ hid j H j p X ´ W j q (8) δ hid j “ 1 σ 2 tp 1 ´ κ q ÿ k δ dec k v dec j k ` κ ÿ l δ class l v cls j l u (9) In Eq.9, δ hid j is error signal backp ropagated to the j -th hidden layer . The reference vector m odification in Eq. 8 is similar to that of SOM, in that the d if ference between the input an d the reference vector drive s the m odification an d as H j includes the neighborho od function, the proximity o f the hid d en n euron to the 3 best matching unit, w in ensures the formation o f the topolo gical structure. Howe ver , in SOM the mod ification is alw ays directed tow ard the input X , while in ST A the direction is con trolled by the sign of δ hid j , where in case of a p o sitiv e δ hid j the mo dification is iden tical to SOM’ s while a negativ e δ hid j repulses th e reference vector away from th e input vector . As δ hid j is the error signal backpropagated from the output layer, the two d imensional hidd en layer in ST A is self-organized based n ot only o n the to pological structure of the inputs but also th eir co ntexts that h a ve to be generated in the outp ut layer . It is obviou s that for same inputs, diff erent teacher signals or cost functions will generate differe n t topological representations in the hidden layer . Hence, unlike SOM, the ST A g enerates maps th at visualizes the topolo g ical structure of the inputs in their given context. 3 E X P E R I M E N T S In the preliminary experiment, the ST A is tested against 3 di- mensional toy problem sh own in Fig. 2a where fou r normally distributed clusters are ass ig ned to three classes denoted by three diff erent colors and markers, ‚ , and , respectively . There are many overlapping p oints in the tw o clusters represented with ‚ s and s while the rest of the two clu sters are id entically labeled. Fig ure 2b visualizes the hidd en representation of ST A, when it was trained as an autoencoder ( κ “ 0 ) while Fig. 2c visualizes the hidden representation o f ST A when it is trained as a classifier ( κ “ 1 ). It can be seen from th ese two figures that the the contexts o f the data p lays important roles in generating diff erent topolog ical representation. The autoenco der gen erates topological representation where adjacent clu s ters in their origin al high dim ensional sp ace are also assigned in a close p roximity , while two separated clusters are assign ed remotely on the low dimension al representation space. For the classifier, the labels play important role in organizing the hidden representation. It is obvious that the two origin ally overlapping clu sters are s ep arated, except for a few similar p oints. The n ext toy p ro b lem is shown in Fig. 2a. The data distribution is id entical to the pre v ious p roblem but the identically lab eled two- clusters in the p re vio us problem are labeled differently , marked as and ‹ . Figure 2 b visualizes the hidd en representation of ST A as an autoencoder . Naturally , the structure of this representation is exactly the same as th e one in Fig. 2b, as the labels of the data do not have any role in the learnin g process. Howe ver , when ST A is trained as a classifier , the context of the data chang es from the previous problem and th us conseq uently alters the distribution of the hidd en representation. Now the lar ge cluster representing the two d if ferent normal distributions with the same lab els are replaced by two ad jacent clusters with d if ferent labels. The preliminary experiments indicate that the low dimen sional representations of ST A are influenced by the context of th e data, hence now we can visualize not only th e topo lo gical structure of high dimensio nal data as in SOM but their topological structure under a given co n text as well. T o better illustrate the v isualization characteristics of ST A, it was trained against the well known Iris Data. These data are four dimens ional and comprise of three labels where it is known that one of the classes, marked with ‚ is linearly separable from the oth er two, wh ile thos e two, marked with an d , are not linearly sep arable. Figu re 2a shows the visualization of the hidden layer o f ST A trained as an auto encoder ( κ “ 0 ), wh ere the unlabeled structure of the d ata is displayed. Here, the inh erent characteristics of th e data can b e clearly observed, in which one of the classes forms a distinctive clus ter s eparated from th e other two, but the those two shares some over lapp ing instances. Increasing the mixin g parameter κ “ 0 . 1 results in Fig. 2b. Here, as th e labels are slightly infused into the learning process, so ST A attempts to sep arate the two originally overlapping classes. The class-separation appears more obviously when the mixing coef ficient increases, as shown in the case when κ “ 0 . 8 in Fig. 2c. When ST A is trained as a classifier ( κ “ 1 ) the three classes are com pletely separated except for a few overlapping points. Figures 3a - 3d show the v isualizations of W ine Data under diff erent learning con texts. It is clear that with the in crease of κ the hidden representations of ST A shift from the formation of inh erent topological structure of the data into con textual representation of the data. From the experiments, it can be observed how the labels of the data influence the in ternal organization of the neural network. Here, while an autoenco der generates topolo gical representations capturing th e origin al in herent s tru ctu re of the d ata, th e a classi- fier generates topological representations that are instrumental in predicting the labels of the data. In the final experiment, the ST A is tested against MNIST problem. Figure 4a shows the autoencod er’ s topological represen- tation that shows the inherent structure of the handwritten digits without their label-contexts. It is natural th at som e diff erent digits are sim ilarly written, and these sim ilarities are reflected on the topological representation s of ST A. For example, in group A an d group B, m any 2s and 7s form some clu sters, wh ile in group C, 1s, 4 s, 7s and 9s are closely grouped, wh ile in group D there are many 3 s, 6s and 8s. Overall this figu re shows the n atural distribution of hu man digit writing . The representation o f ST A trained as a classifier is sh own in Fig. 4b. In this figure it is obviou s that the introduction of labels in the training process changes the topological representation, in th at the d igits are mo re distinctively clustered. Howe ver , th ere are still so m e mixed clu s ters, for exam- ple group A contains some 3 s, 8s an d 9 s, group B contains 1s and 9s, group C contains 7 s an d 9s, while grou p D contains 4s an d 9s. The group ing of dif ferent digits in to a same cluster is due to the similarity in writing dif ferent d igits. The visualization does no t only d isplay the contextual d istribution of the data but also offer intuitive information o n input areas where th e classifier is likely to perform well and o ther areas that are challengin g for the classifier . 4 C O N C L U S I O N In th is study , a n eural network that is able to form a two dimen- sional topo logical map based no t only on the high dimen sional structure o f the data but also their con texts is p roposed. The ability to vis ualize high dim ensional d ata und er differ ent contexts add fle x ibility in d iscovering obscure ch aracteristics of th e high dimension al data. As opposed to many d imensional reduction and visualization methods that are either supervised or unsupervised, ST A can be flexibly trained und er d if ferent context. In this paper , the ST A was trained as autoencod ers, where the inherent label- free characteristics of the data are captured, as classifiers, where the topolog ical characteristics under the contextual relation o f th e labels are cap tu red, or mixing b oth autoencod er and class ifier . When the ST A is trained as an autoen coder , the hid den represen- tations encod es the natural topolog ical structure of the data th at is required to reconstruct h igh dimen sional input in the o utput layer . When the ST A is trained as a classifier , the hid den representation 4 (a) 3 Clusters (b) 3 Clusters ( κ “ 0 ) (c) 3 Clusters ( κ “ 1 ) (a) 4 Clusters (b) 4 Clusters ( κ “ 0 ) (c) 4 Clusters ( κ “ 1 ) (a) Iris ( κ “ 0 ) (b) Iris ( κ “ 0 . 1 ) (c) Iris ( κ “ 0 . 8 ) (d) Iris ( κ “ 1 ) Fig. 2: Iris Data 5 (a) Wine ( κ “ 0 ) (b) Wine ( κ “ 0 . 1 ) (c) W i ne ( κ “ 0 . 8 ) (d) W ine ( κ “ 1 ) Fig. 3 : Wine Data (a) MNIST ( κ “ 0 ) (b) MNIST ( κ “ 1 ) Fig. 4 : MNIST encodes a contextual topo logical structure th at is needed to predict the labels of the high dimensio n al inpu t. By controllin g the mix in g coef ficient, an intermediate representation is formed. Observin g the hidden representations und er differe n t training contexts, some insights abou t how th e infusion of con texts changes the internal representation. For example th e degree o f d if ficulty in training a classifier can be intuitiv ely understoo d . High dim en sional d ata that h av e n atural class-division in their au toencoder representation are likely to be an easy problem for classifier , while the difficulty of the classifier can b e intuitively obs erved from the overlapping areas co ntaining contrasting sam ples. In this paper , the frame work for context-flexible visualization and their basic experiments have been presented. For the future works, ST A is to be utilized for multi context data visualization an aly sis. For example in educa- tional s etting, where learning characteristics of s tudents can b e interpreted in different contexts, and be utilized to further s u pport their learning activities. As an aspect of explainable AI, a metho d for explainin g th e to p ological map in a hum an friendly form will also b e developed. R E F E R E N C E S [1] G. E. Hinton and S. T . Ro weis, “Stochastic neighbor embedding, ” in A dvances in Neural Information P r ocessing Systems 15 , S. Becker , S. Thrun, and K. Obermayer, Eds. MIT Press, 2003, pp. 857–864. [Online]. A v aila ble: http://papers.ni ps. c c/paper/2276- st ochastic- neighbor - embedding.pd f [2] L. van de r Maaten, “V isua l izing high-dimensional data using t-sne, ” Jou rnal of Machine Le arning Res earc h , vol. 9, pp. 2579–2605, 2008. [3] ——, “ Acce lerating t-sne using tree-based algorithms, ” Journal of Machine Learning Research , vol. 15, pp. 3221–3245, 2014. [Online]. A v aila bl e: http:// jmlr .org/papers/v15/v andermaa ten14a.html [4] S. T . Ro weis and L. K. Saul, “Nonline a r dimensionali ty reduction by locally linear embedding, ” Science , vol. 290, no. 5500, pp. 2323–2326, 2000. [Online]. A v ai lable: https://sc ience.sci encemag.org/content/290/5500 /2323 6 [5] J. B. T enenbaum, “Ma pping a manifold of perceptual observ ati ons, ” in Adv ances in Neural Information Pr ocessing Systems 10 , M. I. Jordan, M. J. Kearns, a nd S. A. Solla, Eds. MIT Press, 1998, pp. 682–68 8. [Online]. A vailable: http://papers.ni ps. c c/paper/1332- ma pping- a- manifold- of- perceptual - observations.pdf [6] J. B. T enenbaum, V . d. Si lva, a nd J. C. Langford, “ A global geometric framew ork for nonlinear dime nsionality re duction, ” Sci ence , vol. 290, no. 5500, pp. 2319–2323, 2000. [Online]. A v aila ble: https://sc ience.sci encemag.org/content/290/5500 /2319 [7] T . Koh onen, “Self-organized formation of topologically correct feature maps, ” Bi ological Cybernetics , vol. 43, pp. 59–69, 1982. [8] ——, “Essenti al of self-organizing map, ” Neural Networks , vol. 37, pp. 52–65, 2013. [9] L. McInnes, J. Healy , a nd J. Mel ville, “Umap: Uniform manifold approx- imation and projection for dimension reducti on, ” 2018. [10] J. Goldberger , S. R oweis, G. Hinton, and R . Salakhutdinov , “Neighbourhood c omponents anal ysis, ” in Proceedings of the 17th International Conference on Neural Information P r ocessi ng Systems , ser . NIPS’04. Cambridge, MA, USA: MIT Press, 2004, pp. 513–520. [Online]. A v aila ble: htt p://dl.a c m.org/citation.cfm?id=2976040.297610 5 [11] Y . Zhang, Z. Z hang, J. Qi n, L. Zhang, B. Li, and F . Li, “ Se mi-supervised local multi -manifold isomap by linear embedding for feature extraction, ” P attern Rec ognition , vol. 76, pp. 662 – 678, 2018. [Online]. A v ai lable: http://www .sci encedirect .com/science/article/pii/S0031320 317303977 [12] J. W . Sa mmon, “ A nonlinear mapping for data structure a nalysis, ” IEEE T ransactions on Computers , vol. C-18, no. 5, pp. 401–409, May 1969. [13] J. B. Kruskal, “ Multidimensional scaling by opti m izing goodness of fit to a nonmetric hypothesis, ” Psy chometrika , vol. 29, no. 1, pp. 1–27, Mar 1964. [Onli ne ]. A v ail able: https: / /doi.org/10.1007 / BF02289 565 [14] P . Hart ono a nd Y . T ake, “Pairwise ela stic sel f-organizing maps, ” in 2017 12th International W orkshop on Self-Organizing Maps and Le arning V ect or Quantization, Clustering and Data V isualization (WSOM) , June 2017, pp. 1–7. [15] G. Hinton and R. Salakhutdinov , “Reducing t he dimensionality of data with neural networks, ” Science , vol. 313, no. 5786, pp. 504—507, 2006. [16] P . Hartono, P . Holle nse n, and T . Trappenberg , “Learning-regulated con- text relev ant topographical map, ” IEEE T rans. on Neural Net works and Learning Syst ems , vol. 26, no. 10, pp. 2323–2335, 2015. [17] P . Hartono, “Classific ation and dimensional re duct ion using restricted radial basis function networks, ” Neural Compu t ing and Applic ations , 2016.
Original Paper
Loading high-quality paper...
Comments & Academic Discussion
Loading comments...
Leave a Comment