Framework for Inferring Following Strategies from Time Series of Movement Data
How do groups of individuals achieve consensus in movement decisions? Do individuals follow their friends, the one predetermined leader, or whomever just happens to be nearby? To address these questions computationally, we formalize "Coordination Str…
Authors: Chainarong Amornbunchornvej, Tanya Berger-Wolf
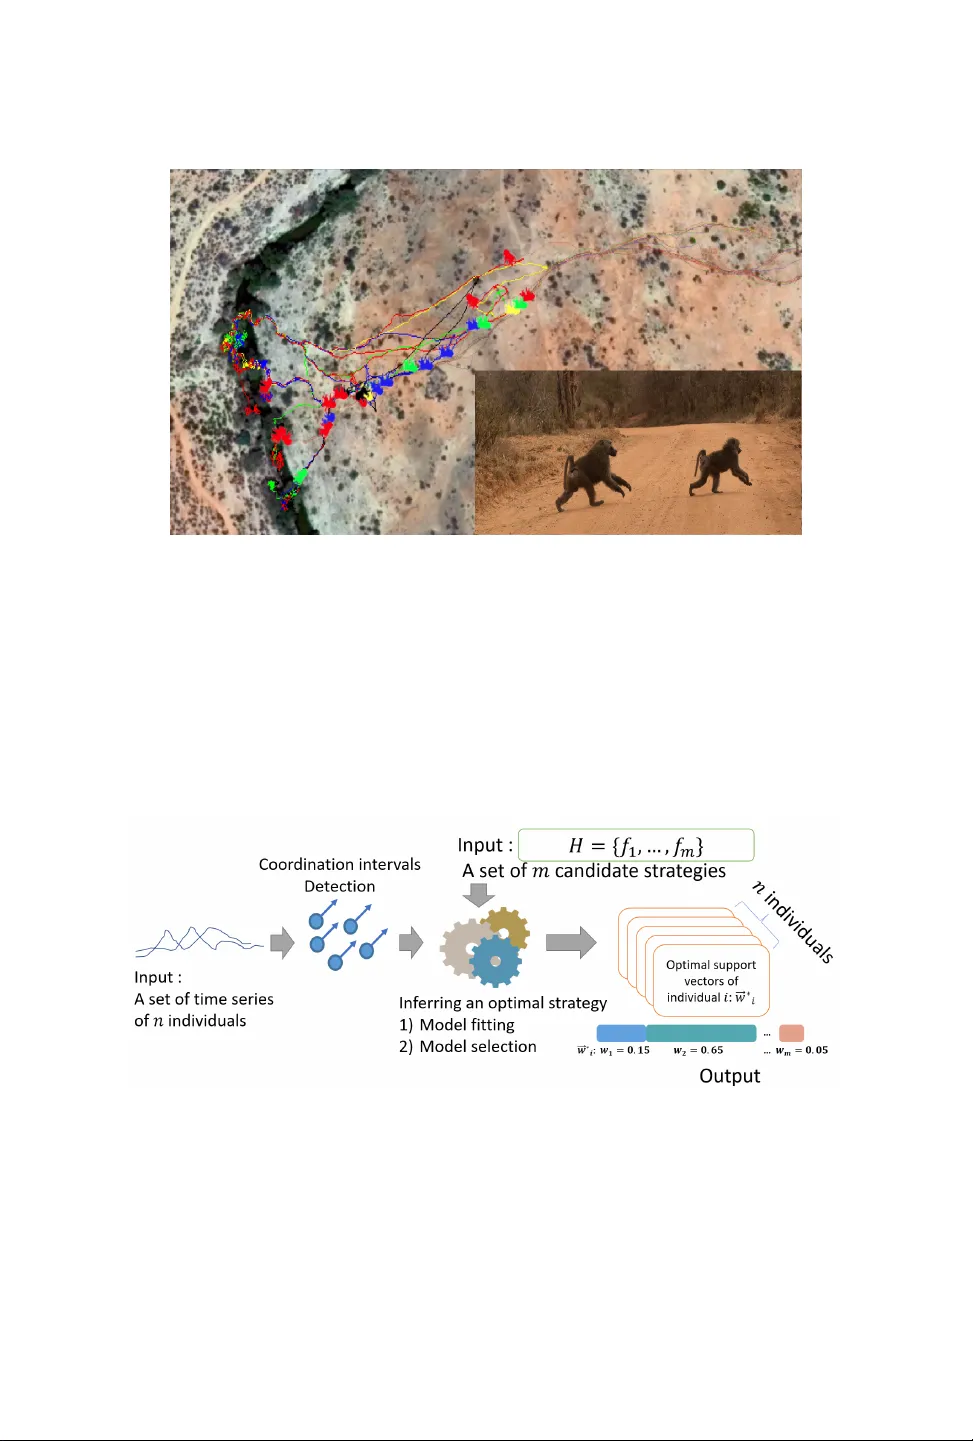
Framework for Inferring Follo wing Strategies from Time Series of Movement Data CHAINARONG AMORNBUNCHORN VEJ, National Electronics and Computer T echnology Center, Thailand T ANY A BERGER- W OLF, University of Illinois at Chicago, USA How do groups of individuals achieve consensus in movement decisions? Do individuals follow their friends, the one predetermined leader , or whomever just happens to be nearby? T o address these questions computationally , we formalize Coordina tion Stra tegy Inference Problem . In this setting, a group of multiple individuals moves in a coordinated manner towards a target path. Each individual uses a sp ecic strategy to follow others (e.g. near est neighbors, pre-dened leaders, preferred friends). Given a set of time series that includes coordinated movement and a set of candidate strategies as inputs, we provide the rst methodology (to the best of our knowledge) to infer whether each individual uses local-agreement-system or dictatorship-like strategy to achieve movement coordination at the group level. W e evaluate and demonstrate the performance of the proposed framework by predicting the direction of mov ement of an individual in a group in both simulated datasets as well as two real-world datasets: a school of sh and a troop of baboons. Moreover , since there is no prior methodology for inferring individual-le vel strategies, we compare our framework with the state-of-the-art approach for the task of classication of group-le vel-coordination models. The results show that our approach is highly accurate in inferring the correct strategy in simulated datasets even in complicated mixe d strategy settings, which no existing metho d can infer . In the task of classication of group-level-coordination models, our framework performs better than the state-of-the-art approach in all datasets. Animal data experiments show that sh, as expected, follow their neighbors, while bab oons have a preference to follo w specic individuals. Our methodology generalizes to arbitrary time series data of real numbers, beyond movement data. CCS Concepts: • Information systems → Spatial-temporal systems ; Data mining ; • Computing method- ologies → Cooperation and coordination . Additional K ey W ords and Phrases: Model Selection, Coordination, Time Series, Leadership A CM Reference Format: Chainarong Amornbunchornvej and T anya Berger- W olf. 2019. Framework for Inferring Following Strategies from Time Series of Movement Data. A CM Trans. Knowl. Discov . Data. 1, 1 ( January 2019), 22 pages. https: //doi.org/10.1145/1122445.1122456 1 INTRODUCTION Coordination is a form of group behavior aimed to make the group achieve a collective goal [ 33 ]. During the decision-making process, a collective goal is to reach a group’s consensus, which is dened as the state when all individuals share a common agreement [ 10 ]. One of the mechanisms by which a gr oup can achiev e a collective goal is leadership, which is a pr ocess of pattern initiation A uthors’ addr esses: Chainarong Amornbunchornvej, National Ele ctronics and Computer T e chnology Center, Pathum Thani, Thailand, chainarong.amo@nectec.or.th; T anya Berger-W olf, University of Illinois at Chicago, Chicago, IL, USA, tanyabw@uic.edu. Permission to make digital or hard copies of all or part of this work for personal or classroom use is granted without fee provided that copies are not made or distributed for pr ot or commercial advantage and that copies bear this notice and the full citation on the rst page. Copyrights for components of this work owned by others than A CM must be honored. Abstracting with credit is permitted. T o copy otherwise, or republish, to post on servers or to redistribute to lists, requires prior specic permission and /or a fee. Request permissions from permissions@acm.org. © 2019 Association for Computing Machinery . 1556-4681/2019/1- ART $15.00 https://doi.org/10.1145/1122445.1122456 A CM Trans. Knowl. Discov . Data., V ol. 1, No. 1, Article . Publication date: January 2019. 2 C. Amornbunchornvej et al. Fig. 1. An example of GPS-collar trajectories of Olive baboons living in Mpala Research Centre, Kenya [ 14 , 40 ]. In this event, the tr oop is forming coordinated movement. by specic individuals, leaders, then followed by the rest [ 4 ]. In behavioral studies, coordination problems, such as group decision making, coordinated movement, group hunting, social conicts, and territorial defense, can be solved by leadership [ 15 , 29 ]. T ypically , leaders might not be explicit or global to a group, yet the group can still create coordinated movement via a local strategy (e .g. individuals follow their neighbors) [ 15 ]. Moreover , many groups of individuals in Nature have neither leaders nor central authority , but these groups ar e capable of forming coordination patterns [ 24 , 37 , 42 ], such as honey bees [ 24 ], slime molds [ 37 ], etc. Fig. 2. An ov erview of the proposed framework. Given a set of time series as inputs, 1), the framework detects coordination intervals, 2) infers the optimal strategy from a set of candidates that optimally fit the training data, and 3) reports the optimal strategy for each individual from validation data. In cooperative control of multi-agent systems, the eld focuses on how to design a local strategy for each agent so that the group can achieve collective goals [ 10 , 31 , 42 ]. Many systems have been designed by inspiration of natural collective behaviors such as a ock of birds, a school of sh, etc. [ 42 ]. Recently , patterns of opinion formation that emerge from dynamic behaviors of social networks are studied in the view of multi-agent systems [ 5 , 35 ]. A CM Trans. Knowl. Discov . Data., V ol. 1, No. 1, Article . Publication date: January 2019. Framework for Inferring Following Strategies from Time Series of Movement Data 3 Agents can communicate only with their neighbors via a communication network, which is de- ned by any neighborhood concept in some space [ 31 ]. There is a large b ody of work in multi-agent systems that proposes local synchronization strategies [ 10 , 16 , 31 ]. In behavioral studies, the work in [ 15 , 39 ] tried to model the coordination process via a concept of information spreading. A small number of informe d agents can spread information through a large numb er of uninformed agents, which results in the group’s consensus and coordinated movement. The work by Chazelle [ 11 ] introduced a model, namely a reversible agreement system, that guarantees convergence of the group state, with or without leaders. In more complicated settings, the works in [ 2 , 16 ] provided the analysis of multiagent network systems that can form coordination where netw orks of relations of agent interactions can change over time. In online so cial networks, there is also a “Diusion Model” [ 20 , 21 , 26 ] that models an information spreading process among individuals that results in the entire network reaching a common state . Howev er , in this paper , w e focus on the inverse question of inferring the local strategies collective individuals use to achiev e a state of coordination. There are only a few studies that address this question. The works by Farine et al. [ 17 ] found that wild baboons can achieve the state of coordinated movement within a group by following their neighbors or long-term associates, depending on the time scale of the coordination process. There are several studies that lo ok at the collective b ehavior of sh. For example, the work in [ 18 ] modeled and inferred the rules of movement coordination of sh, which is aected by the group size; Herbert-Read et al. [ 22 ] r eported that the rules of movement coordination of sh mainly depend on attraction forces of the group; and Katz et al. [ 25 ] showed that sh tend to imitate the direction of neighbors ahead. The work in [ 30 , 34 ] proposed model selection metho ds to infer the animal-behavior model, but they cannot be use d to nd models that guarantee coordination. 1.1 The current state of the art approach The work in [ 4 ] provided a framew ork, FLICA, for leadership inference and model classication in time series data. FLICA considers the shape of time series to infer pairwise relationship who follows whom (instead of considering only directions or positions of individuals). Hence, FLICA subsumes all previous methods [ 4 ] including FLOCK patterns leadership [ 6 ], time-lag following leadership [ 28 ], etc. FLICA can infer an underlying possible group mo del that generate d co ordination via a classication metho d. Howev er , FLICA cannot be use d to infer individual-level strategies that collectively combine to coordinated movement at the group level. In fact, each individual within a group can use a dier ent strategy to achiev e collective coordination (Pr oposition 3.4 ). Hence , in this paper , we develop an approach to ll this methodological gap. Note that we use the words ‘model’ , ‘mechanism’ , and ‘strategy’ interchangeably . 1.2 Our Contributions In order to ll the gap in the literature, we formalize Coordina tion Stra tegy Inference Problem , analyze the oretical properties of a strategy that guarantees coordination, propose hierarchical and non-hierarchical strategies that guarantee coordination, as well as pr opose a computational framework to infer , fr om time-series data, individual-level coordination strategies. Given a set of candidate strategies and time series of coordinated movement, our framework is capable of: • Inferring the latent strategies: inferring the best t set of mixed or pure strategy for agents that provide the low est loss value for the task of predicting the direction of movement; and • Movement prediction: predicting the dir ection of the next move of each agent when the optimal strategy is unknown, using the set of the inferred latent strategies. W e evaluate and demonstrate the performance of our framework on simulated datasets as well as real-w orld datasets of animal movement. On simulated data, the task is to infer the corr ect latent A CM Trans. Knowl. Discov . Data., V ol. 1, No. 1, Article . Publication date: January 2019. 4 C. Amornbunchornvej et al. coordination model that was used to generate the simulated time series of co ordinated movement. W e use the baboon dataset to predict the next mov ement to nd which strategies each bab oon likely used to coordinate its movement. Lastly , in sh datasets, we show how to apply the framew ork to do the model selection to address a hypothesis about the original model that the sh use to achieve coordinated movement. Coordina tion Stra tegy Inference Problem : T o reach a group consensus, individuals have to coordinate with others. There are many strategies each individual can use to achieve coordination at the group level. Given time series of individual activities and a set of candidate strategies, the goal is to nd the set of original strategies individuals used that lead to the group consensus. 1.3 Flock mo deling, dictatorship, and our model-selection framework Do agents use some ock mo dels or they use a dictatorship model when they move? In this paper , given a set of candidate mo dels and time series of agents’ states (e.g. directions or positions of agents that move in a metric space), the main focus is to develop a model-selection framework for inferring which model(s) are generator of these time series. W e focus on two classes of models that the group can reach coordination: neighbors’ dependent model and individual-dependent mo del. For simplicity , the following example is dene d the states of agents as directions in movement context. In neighb ors’ dependent models, agents move following their group w .r .t. their neighb or di- rections and positions. This typ e of model is o ck modeling that has a rich literature. The ock models began with the work by CW Reynolds in 1980s [ 38 ]. The works in [ 13 , 32 , 38 ] proposed ock decentralized mo dels that need no leaders but still be able to self-organize and maintain coordination. The works in [ 7 , 8 , 27 ] proposed ock models that humans can control and change a state of group behaviors. The w ork in [ 41 ] pr oposed a ock multi-agent system with se veral leaders and showed that the group will converge towar d average of leaders’ states. In term of convex hull analysis, for each time step , an agent in neighbors’ dependent models changes its state within a convex hull of its neighbors’ states except some individuals who lead the ock. There are many state-of-the-art models in ock literature that have rules to make agents avoid collision and other problem. For example , the recent ock model [ 36 ] has been developed for the Unmanned aerial vehicle ( U A V) ocking control purpose so that a group can eectively avoid obstacles during a ight. Since a state (e .g. direction, v elocity , etc.) of mov ement of each agent in ock models rar ely leave a state convex hull of its neighbors, mathematically , according to the works in [ 11 , 12 ], almost all ock models can be viewed as agreement systems studied by Chazelle [ 11 ] and the recent A veraging system [ 12 ]. Hence, based on Chazelle’s works, we propose to use Local Reversible Agreement system (LRA), which is a variation of Chazelle ’s averaging system, as one of input models of our model-selection framework. In individual-dependent models, agents move following some specic individuals without any dependency with directions or positions of their neighb ors. The obvious case is a dictatorship model where everyone follows leader agents [ 2 , 4 , 19 ]. Inuence Maximization models (e.g. linear threshold, independent cascade models) [ 21 , 26 ] are other models that some individuals (inuencers) inuence other individuals. For these models, the common property is that agents follow some individuals (typically leaders) directly without considering environmental factors ( e.g. directions, positions, or velocities of neighbors). In this work, we pr opose to use a hierarchical model (HM) A CM Trans. Knowl. Discov . Data., V ol. 1, No. 1, Article . Publication date: January 2019. Framework for Inferring Following Strategies from Time Series of Movement Data 5 as a representativ e model of individual-dependent models to be an input of our model-selection framework. Nevertheless, almost all models proposed in the literature assume that all agents are under the same rules when they have to interact with others. In nature, however , dierent individuals might use dierent strategies to follow the group but the group still be able to reach co ordination. In this work, we propose a framework that can distinguish whether each agent follows its neighbors (LRA), specic individuals (HM), or itself (AR) from time series data. W e also show that ev en though dierent individuals within the same group use either LRA or HM, the group still be able to reach coordination (see Section 3 ). 2 PRELIMINARIES AND DEFINITIONS W e use the following notation throughout the paper: • N = { 1 , . . . , n } is a set of agents. • I ⊆ N is a set of informed agents. • S t i is a state value of agent i at time t , where S t i ∈ R d . • S t = { S t i } is a set of individual states at at time t . • S i = ( S 0 i , . . . , S T i ) is a state time series of agent i where T is a length of time series. • S w = ( S 0 w , . . . , S T w ) is a target path where S t w ∈ R d is a target state at time t . • H = { h i } is a set of strategy functions that agents use to update their current state where h i : R d → R d . • S = { S i } is a set of state time series generated by agents using some set of strategy functions F ⊆ H . • σ ∈ [ 0 , 1 ] is a noise-tolerance threshold. Given a set of n agents N with a set of their initial states S 0 = { S 0 i } , these n agents generate a set of state time series S = { S i } , where S i = ( S 0 i , . . . , S T i ) is the state time series of agent i ∈ N . For each time step t , each agent i updates its state via a strategy function h i ∈ H : S t i = h i ( S t − 1 i ) . Howev er , an informed agent j ∈ I always has its state the same as a target path S w : S t j = S t w . 2.1 Initiator of coordination W e use the denitions of coordination, following relation, and coordination initiator from [ 4 ]. Let S = { S i } be a set of time series. Let S i , t c denote the time series equal to S i that starts at time t c , that is ∀ t ∈ Z , S t + t c i , t c = S t i , and sim : S × S → [ 0 , 1 ] be any similarity function over time series. W e then dene the similarity function of a following relation b etween two time series ( similarity with a time shift): sim f o l l ( S i , S j ) = max ∆ t ∈ Z sim ( S i , 0 , S j , 0 + ∆ t ) . (1) W e can also dene the minimum time delay of a following relation below: In Eq. 2 , if ther e are multiple time delays that have the same max ∆ t ∈ Z sim ( S i , 0 , S j , 0 + ∆ t ) (similar patterns repeated many times), then we choose the minimum value of these time delays to represent the time delay between two time series that share similar patterns. For e xample, if a pattern is repeated periodically , Eq 2 will ensure that the rst iteration will be chosen. ∆ t f o l l ( S i , S j ) = min [ argmax ∆ t ∈ Z sim ( S i , 0 , S j , 0 + ∆ t )] . (2) Denition 2.1 ( σ -Following relation). Let P = ( P 0 , . . . ) and Q = ( Q 0 , . . . ) be time series. If sim f o l l ( P , Q ) ≥ σ and the time delay ∆ t f o l l ( P , Q ) ≥ 0 , then P is followed by Q , denoted by P ⪯ Q . In the case that ∆ t f o l l ( P , Q ) > 0 , then P is strictly followed by Q , denoted by P ≺ Q . A CM Trans. Knowl. Discov . Data., V ol. 1, No. 1, Article . Publication date: January 2019. 6 C. Amornbunchornvej et al. That is, Q follows P if Q is suciently similar to P , with a time delay . The σ threshold is used to dened the sucient level of similarity that we accepted that Q follows P . Denition 2.2 (Coordination interval). Let Q = { Q 1 , . . . , Q n } be a set of time series. For any interval [ t 1 , t 2 ] if ∀ t ∈ [ t 1 , t 2 ] , ∀ Q i , Q j ∈ Q s.t. i , j , either Q i ⪯ Q j or Q j ⪯ Q i , then [ t 1 , t 2 ] is a coordination interval. That is, a co ordination inter val is the time when everybo dy either follows or is followed by somebody . Denition 2.3 (Initiator). Let Q = { Q 1 , . . . , Q n } be a set of time series and [ t 1 , t 2 ] be a coordination interval of Q . For any Q L ∈ Q , if ∀ t ∈ [ t 1 , t 2 ] , ∀ Q i ∈ Q \ { Q L } , Q L ≺ Q i , then L is an initiator of coordination interval [ t 1 , t 2 ] . The initiator is the one who is followed by everybody during coordination. Denition 2.4 (Coordination event). Let Q = { Q 1 , . . . , Q n } be a set of time series. If there e xists any coordination interval in Q , then Q is a coordination event. Denition 2.5 (Coordination strategy). Let F ⊆ H be a set of strategy functions that the agents use to generate a set of state time series S = { S i } . Each agent i ∈ N uses a function f i ∈ F to update its state for each time step. F is a set of coordination strategies of S if S is a coordination event. Note that if all agents follow the target path S w , then an informed agent is an initiator of coordination. 2.2 Problem formalization Suppose there is a set of state time series S = { S i } that was generated by an unknown set of latent coordination strategies F ⊆ H w .r .t. some unknown σ . The only available inputs ar e S and the entire set H . The goal is to nd F . The real identity of the target path S w is unknown, but it is known that S w ∈ S . Before formalizing the pr oblem, we dene the risk function to measure the tness of any h k ∈ H that might be in F , for any agent i : r is k ( S i , h k ) = 1 T T Õ t = 1 l os s ( S t i , h k ( S t − 1 i )) , (3) where l os s : R d × R d → R is a loss function and h k ( S t − 1 i ) returns a predicted state ˆ S t i . No w , we are ready to formalize Coordina tion Stra tegy Inference Problem . In the next section, we introduce a concept of convergence in multi-agent systems and the r elationship between convergence and coordination strategy . Problem 1: Coordina tion Stra tegy Inference Problem Input : A set of state time series S = { S i } generated by multiple agents, where S is a coordination event; a set of strategy functions H = { h k } ; and a loss function l os s : R d × R d → R . Output : A set of minimum risk strategies F ∗ = { f ∗ i } where, for each agent i , f ∗ i = argmin h k ∈ H r is k ( S i , h k ) . A CM Trans. Knowl. Discov . Data., V ol. 1, No. 1, Article . Publication date: January 2019. Framework for Inferring Following Strategies from Time Series of Movement Data 7 3 MODELS AND PROPERTIES 3.1 Convergence and coordination strategy For the convergence of multi-agent systems, we adopt a notion of ϵ -convergence fr om [ 11 ]. Denition 3.1 ( ϵ -convergence). Given S 0 = { S 0 1 , . . . , S 0 n } , a system, which is a set of strategy functions, is said to ϵ -converge if, for 0 < ϵ < 1 / 2 1 , there e xists a time constant t c > 0 such that for all t > t c , a set of n agent’s states S t = { S t 1 , . . . , S t n } can be partitioned into disjoint subsets, where the maximum distance between any pair of agents’ states S t i , S t j from the same subset is less than or equal ϵ . Assuming that a distance function is dened in a metric space. Denition 3.2 ( ϵ -convergence of time series). Given two time series S 1 , S 2 , we say that S 1 ϵ - converges toward S 2 at time t if, for all time t c ≥ t , the distance between S t c 1 and S t c 2 is less than or equal ϵ , where 0 < ϵ < 1 / 2 . Proposition 3.3. Supp ose 0 < ϵ ≤ 1 , if all time series generated by a set of strategy functions F ⊆ H ϵ -converge towar d a target path S w , then F is a set of coordination strategies, where σ = 1 − ϵ . Proof. Suppose all time series generated by a set of strategy functions F ⊆ H ϵ -converge toward a target path S w . At the converging time t ∈ [ t 1 , . . . ] every agent’s state is within its group convex hull center ed at S t w that has the diameter at most ϵ . For some time t 2 ≥ t 1 , every time series has a distance between each other at most ϵ . By setting σ = 1 − ϵ , this implies that every time series σ -follows time series S w . By assigning all agents that have the state time series the same as S w to be informed agents, since others follow S w with some time delay , therefore , we have the 1 − ϵ -coordination inter val [ t 2 , . . . ] and all informed agents are initiators. □ Proposition 3.4. Let H = { h k } be a set of pure strategy functions. If all agents use any h i ∈ H as a pure strategy function and their state time series ϵ -converge toward a target path S w , then a mixe d strategy function f ′ , created by a linear combination of functions in H , generates a time series that ϵ -converges toward S w . Proof. Suppose all functions in H generate state time series that ϵ -converge toward S w . At the equilibrium time t , when all strategies converge, any strategy in H that agent i uses ensures that i ’s state S t i is in the convex hull of states center ed at S t w and has a diameter at most ϵ , since a linear combination of values within a convex hull is still in a convex hull. Therefore , a mixed strategy function f ′ that is created by a linear combination of functions in H generates a time series that ϵ -converges toward S w . □ 3.2 Convergence models 3.2.1 Hierarchical Model Dynamic System (HM). Let L be an informe d agent. Let a directe d acyclic graph (D A G) G = (V , E ) b e graph, where V is a set of agent nodes and E is a set of probabilistic edges, so that if p i , j is a probability that i follows j s.t. p i , j > 0 , then ( i , j ) ∈ E has the weight p i , j . W e call G = (V , E ) a probabilistic following network. In this model, G is connected and ev ery node has a path to a leader node L . For every time step t ≥ 0 , the system generates a communication network G t = (V , E t ) , which is a realization of G . The example of the pr ocess of generation of a communication network is shown in Fig. 3 . 1 In the work by Chazelle [ 11 ], at any time t , two agents that move and make a distance between them still less than 1 / 2 is considered as a trivial step. The bound 0 < ϵ < 1 / 2 is dened to ignore micr oscopic motions. A CM Trans. Knowl. Discov . Data., V ol. 1, No. 1, Article . Publication date: January 2019. 8 C. Amornbunchornvej et al. Fig. 3. An example of communication networks G t = (V , E t ) between t = 0 and t = 2 (above). These networks are the realization of the probabilistic following network G = (V , E ) (below). The arrows represent the directed edges while the dashed lines are empty edges. When the time step increases, the informed agent L can increasingly spread its state (orange no de) to more follower no des (blue nodes). Let S 0 = { S 0 1 , . . . , S 0 n } be a set of agent’s initial states, N t i = { j | ( i , j ) ∈ E t } ∪ { i } be a set of neighbors of i in G t that i follows, and S w be a target path. At any time t , the informed agent L updates its state to be S t w . For any other uninformed agent i , it updates the state S t i according to the aggregation of its neighbors’ states. Formally , we have a strategy function for this model as follows: f HM ( S t − 1 , i ) = ( S t w , if i = L 1 | N t i | Í j ∈ N t i S t − 1 j , otherwise. (4) Agents use the ab ove strategy function to update the state S t i = f HM ( S t − 1 , i ) in this mo del. In cooperative control literature , the Eq. 4 is called a local v oting protocol [ 31 ]. A system is known to converge if each communication network G t stays the same all the time and has a spanning tree that has a leader node L as the root [ 31 ]. This is why G must be connecte d in order to make a system converge. Theorem 3.5. Let S 0 = { S 0 1 , . . . , S 0 n } be a set of agents’ initial states within Euclidean space. Given a symmetric distance function DIST : R d × R d → R . If all agents use HM strategy (Eq. 4 ) to update their states, then all agents’ state time series ϵ -converge toward a target state S t w with the expectation of the convergence time at most t c = n · max i ( log 2 ( DIST ( S 0 i , S 0 w ) ϵ )/ p ∗ ) time steps if S t w = S 0 w for all t > 0 and p ∗ = min k , l ∈ N , p k , l > 0 p k , l . Proof. In the rst time step, S 0 = { S 0 1 , . . . , S 0 n } forms a convex hull and S 0 w is inside this convex hull because S 0 w ∈ S 0 . Given that L is the agent that represents the state of S t w where S t L = S t w = S t 0 , for any agent i s.t. N t i = { L , i } , this implies that i is an agent that has no e dges to other nodes A CM Trans. Knowl. Discov . Data., V ol. 1, No. 1, Article . Publication date: January 2019. Framework for Inferring Following Strategies from Time Series of Movement Data 9 except L at time t . According to Eq. 4 , because DIST ( S t L , S t i ) = 1 / 2 × ( S t L + S t i ) and S t L is the same all the time, the distance DIST ( S t L , S t i ) reduces by half whenever the link ( i , L ) ∈ E t . Let T i ∼ Binomial ( t i , p L , i ) be a random variable of the numb er of steps it takes until the app ear- ance of a link ( i , L ) such that DIST ( S t L , S t i ) = ϵ , using t i trials. W e can nd the expectation of the time E ( T i ) , i.e., the expecte d number of trials ˆ t i until DIST ( S t L , S t i ) ≤ ϵ . From Eq. 4 , ϵ = DIST ( S 0 i , S 0 w ) 2 T i 2 T i = DIST ( S 0 i , S 0 w ) ϵ T i = log 2 DIST ( S 0 i , S 0 w ) ϵ . Then, by denition of the Binomial expectation, E ( T i ) = ˆ t i × p i , L = log 2 DIST ( S 0 i , S 0 w ) ϵ . Therefore , ˆ t i = 1 p i , L log 2 DIST ( S 0 i , S 0 w ) ϵ . In general, we can have an upp er b ound t c ≥ ˆ t i of the expectation of the convergence time as follows: t c = n · max i 1 p ∗ log 2 DIST ( S 0 i , S 0 w ) ϵ , where p ∗ = min k , l ∈ N , p k , l > 0 p k , l . □ According to Theorem 3.5 and Proposition 3.3 , if the target path S w has its target state S t w as a xed point: S t w = S 0 w for all t > 0 , then the set of strategy functions F that contains only HM strategy functions is a set of coordination strategies. In other wor ds, if all agents use f HM to update their states, then their states converge to a target path. Therefore, a coordination interval exists in their state time series. In contrast, if a target state S t w can be changed, the the group still follows the path S w , because only L inuences the group and L ’s state path is S w . Howev er , the convergence might not exist if the dierence between two consecutive time steps within the target path is always greater than the group convergent rate . 3.2.2 Local Reversible A greement system (LRA). Let P 0 = { P 0 1 , . . . , P 0 n } be a set of physical points, S 0 be a set of initial states, S w be a target path, L be an informed agent who updates its state in correspondence to S w , and д ( P t , S t , i ) be a projection function that agents use to update their physical points. If a state point is a velocity vector , then the projection function is simply the current position plus the velocity vector times the timestep. First, for t > 0 , we update the physical point P t i = д ( P t − 1 , S t − 1 , i ) . Se cond, we create a set of Delaunay triangulations from P t to create a communication network G t = (V , E t ) . If P t i and P t j form the same triangle within the physical space, then ( i , j ) ∈ E t . Third, we update a state of each agent based on the structure of G t . The example of how to nd the neighbors of each individual in LRA is in Fig. 4 , which denes physical points as positions of individuals and states as movement directions. A CM Trans. Knowl. Discov . Data., V ol. 1, No. 1, Article . Publication date: January 2019. 10 C. Amornbunchornvej et al. Given a triangulation membership function δ and a set of all points P t = { P t i } . The function δ ( P t i , P t j ) = 1 if P t i , P t j are memb ers of a triangulation s.t. no other p oints in P t are in the triangulation (note that δ ( P t i , P t i ) = 1 ), otherwise it is zero. W e have a strategy function for LRA as follows. Fig. 4. An example of physical points as positions and state points as directions. In position space (abov e), the individual i (red node) has all gray nodes as its neighbors in LRA since they are neighbors in Delaunay triangulation. In the dir ection space (b elow), i updates its next dir ection to be A rather than B since B is outside the i ’s neighbor convex hull, and A is the averages of grey nodes. f LRA ( P t , S t − 1 , i ) = ( S t w , if i = L Í j S t − 1 j · δ ( P t i , P t j ) Í j δ ( P t i , P t j ) , otherwise (5) The dierence between f HM (Eq. 4 ) and f LRA (Eq. 5 ) is that f HM infers the next state based on a xed structur e of a probabilistic following network G , independently from the physical space P t , whereas f LRA predicts the ne xt state based on the physical space P t . In other words, f HM represents an assumption that an agent follows a xed set of specic individuals w .r .t. the preference graph G regardless of their relative physical position, while f LRA represents an assumption that an agent follows anyone who happens to be ar ound without any preference to follow specic individuals. The next theorem shows that the Local Reversible A greement is ϵ -convergent. A CM Trans. Knowl. Discov . Data., V ol. 1, No. 1, Article . Publication date: January 2019. Framework for Inferring Following Strategies from Time Series of Movement Data 11 Theorem 3.6 (Chazelle 2011[ 11 ]). For any 0 < ϵ ≤ ρ / n , an n -agent r eversible agreement system is ϵ -converged in time O ( 1 ρ · n 2 log 2 ( 1 ϵ ) ). Where ρ > 0 is the time-independent agreement parameter corresponding to the system. 2 According to the work by Chazelle [ 11 ], LRA is still converged e ven if one of the agents does not update. In our case, if S t w is the same for every time step, then the xed agent is L who always has S t L = S 0 w . Corollary 3.7. The n -agent LRA that has G t being created from Delaunay triangulation sets converges to a single point. Proof. The graph G t that is built from Delaunay triangulation is always connected. For each time step, each agent converges to the center of the neighbors’ convex hull. Since everyone is connected and the system is ϵ -converge, by transitivity , the entire group conv erges to the single point. □ In fact, if the xed point is S 0 w , then, at the equilibrium point, all states form a conve x hull around S 0 w with the diameter at most ϵ [ 11 ]. In contrast, if S t w is not always the same, then the gr oup mo ves following S t w with some time delay . The Corollary 3.7 tells us that if we follow our physical neighb ors (e.g. directions) and everyone does the same thing, the entire group will reach the same consensus (moving to the same direction). In general, if G t is strongly connected, ev eryone follows neighb ors in G t , and there is one individual L who never follo ws anyone, then the group converges to L ’s state. A dditionally , Corollary 3.7 is always true in any metric space where a Delaunay triangulation exists. According to Corollary 3.7 and Proposition 3.3 , if a target state never changes: S t w = S 0 w for all t > 0 , then the set of strategy functions F that contains only LRA strategy functions is a set of coordination strategies. 3.2.3 Discussion. According to Theorem 3.5 , Corollary 3.7 , Proposition 3.3 , and Pr oposition 3.4 , if the data has coordination behaviors, then either HM, LRA, or a mix of those strategies may be the cause of the coordination. How ever , the question still remains regarding how to infer which strategy is the cause of the co ordination. In the next section, we propose a solution to address this question. 3.3 Non-coordination strategy: A utoregressiv e-moving-average model Beside agents change their states randomly , A utoregressiv e-moving-average model ( ARMA) [ 43 ] is a strategy that agents change states based on their own states in the past. ARMA is a strategy that has no guarantee that if all agents use this strategy , then the entire group will converge to any state. Formally , given S t i is a time series of agent i at time t , ARMA model of S t i can be represented by a function below: S t i = c + γ t + p Õ a = 1 φ a S t − a i + q Õ b = 1 θ b γ t − b , (6) where γ t is a white-noise term at time t , φ 1 , . . . , φ p and θ 1 , . . . , θ q are parameters of the model, and c is a constant. The ARMA model repr esents that an agent state S t i has dependency from its own states in the past with some noise. In the A utoregressive model ( AR), the term Í q b = 1 θ b γ t − b 2 In a Bidirectional agreement system, which is a general model of a reversible agreement system, the ρ > 0 condition is a necessary condition to make systems converging [ 11 ]. A CM Trans. Knowl. Discov . Data., V ol. 1, No. 1, Article . Publication date: January 2019. 12 C. Amornbunchornvej et al. in Eq. 6 is omitted. For simplicity , in our paper , we study AR model only the case that S t i is the average of its p states in the past. 4 METHOD W e are now ready to formally state our approach of inferring movement coordination strategies of agents represented by a collection of time series. 4.1 Seing Fig. 5. An example of movement strategy inference for i . Given the information on positions and directions of individuals in the past ( blue and green nodes), we want to infer the i ’s strategy of movement that can be whether that i ’s next direction follows its neighb ors (A no de), or follows specific individuals (B node), or neither (C node). W e dene a movement direction as a state, but the approach generalizes to arbitrary denitions of states that are dene d on Euclidean space. Hence, S k is a set of time series of direction. W e use direction, rather than position, to dene the state of an individual and the proxy for collective coordination. The main reason is that directional coordination is common in biology . For example, in [ 25 ], the authors report that a sh tends to imitate the direction of neighbors ahead to form collective movement, and other examples abound. Secondly , synchronization to the same direction implies a collective movement while synchronization to the same position implies staying in the same position without movement. In this paper , we focus on coordination of movement, therefore, we cannot use positions as states to infer strategies of movement. The nal reason for dening states as directions is to use a dimension independent of the positions, which we use to dene states of individual strategies. W e need to dierentiate between the strategy that an individual follows specic individuals’ direction regardless of their physical neighbors’ choices of direction versus the strategy that an individual follows their physical neighbors’ direction without any preference to follow spe cic individuals. W e assume the following are given as inputs: a set of possible strategy functions H , a collection of position-time-series sets P = { P k } , and a colle ction of direction-time-series sets S = { S k } , where P k = { P 1 , . . . , P n } and S k = { S 1 , . . . , S n } . The data record of k th coordination event consists of a pair of P k , S k that were generated by n agents A CM Trans. Knowl. Discov . Data., V ol. 1, No. 1, Article . Publication date: January 2019. Framework for Inferring Following Strategies from Time Series of Movement Data 13 moving in tw o-dimensional position space to form directional coordination; all agents coordinately move to the same direction in this interval. Each S k contains a coordination interval. The goal to to infer the set of strategy functions F ⊆ H that generated S k . The framework ov erview is in Fig. 2 . For simplicity of the exposition, we deploy three strategy functions for our framework: HM, LRA, and A uto regressive model ( AR). Again, other candidate strategies are admissible. Howe ver , these three strategies are canonical e xemplars since they make it possible to determine whether the strategy functions that generated a time series of dir ections of each agent is mor e hierarchical (HM), or it is more dependent on the physically proximity neighbors (LRA), or it is just a simple function of the agent’s past histor y , independent of its neighb ors. W e separate P and S to be a training part, ( P train ⊂ P , S train ⊂ S ) , to perform a model tting, and a validation part, ( P val = P − P train , S val = S − S train ) , to perform a model selection. In the case that the input is only a single physical time series P , we use FLICA framework [ 4 ] to nd coordination events and treat each event as a single P k . Hence, we have P containing multiple coordination events from P . Then, we create a set of direction-time-series sets S from P . The example of movement strategy inference is in Fig. 5 4.2 Model fiing Algorithm 2: ModelFittingFunction input : Position-time-series sets P train , Direction-time-series S train , and a Threshold ® κ . output : Supp ort vectors: ® w ∗ 1 , . . . , ® w ∗ n . 1 Let T b e a time length of S train ; 2 Inferring dynamic following network G f o l l from S using FLICA [ 4 ]; 3 Inferring a global-leadership ranking R L from G f o l l ; 4 Aggregating G f o l l and pruning its edges using R L to create a D A G probabilistic network G ; 5 for i = 1 to n do for t = 1 to T do 6 Inferring f ′ HM ( S t − 1 , i ) = S t − 1 i + Í ( i , k ) ∈E p i , k · S t − 1 k 1 + Í ( i , k ) ∈E p i , k (Eq 7 w .r .t. G ) to predict S t i ; 7 Inferring f LRA ( P t , S t − 1 , i ) = Í j S t − 1 j · δ ( P t i , P t j ) Í j δ ( P t i , P t j ) (Eq 5 ) to predict S t i ; 8 Inferring f AR ( S t − 1 , i ) = ( 1 / p ) × Í p a = 1 S t − a i to predict S t i for auto regressive model; end end 9 Running Interior point algorithm [ 9 ] to solve Problem 10 in order to nd ® w ∗ 1 , . . . , ® w ∗ n ; 10 Return ® w ∗ 1 , . . . , ® w ∗ n ; W e concatenate all time series in P train to be a single time series P train and also concatenate S train to be S train . Then we use P train , S train to perform model tting. Before proceeding with the model tting, the HM strategy function requires a probabilistic following network G = (V , E ) . W e infer G from S by using FLICA [ 4 ] to create a dynamic following network of S train . In this paper , the time window threshold of FLICA has been set at ω = 60 time steps. In the next step, we nd a global-leadership ranking, then we aggregate and normalize this dynamic netw ork to be a D AG probabilistic netw ork, such that the high-rank agents do not have a probabilistic following edge to low-rank agents in G . After we have G , we calculate f ′ HM as follows: f ′ HM ( S t − 1 , i ) = S t − 1 i + Í ( i , k ) ∈ E p i , k · S t − 1 k 1 + Í ( i , k ) ∈ E p i , k , (7) A CM Trans. Knowl. Discov . Data., V ol. 1, No. 1, Article . Publication date: January 2019. 14 C. Amornbunchornvej et al. where p i , k ∈ [ 0 , 1 ] is a probabilistic weight of edge ( i , k ) ∈ E . For the LRA strategy function, we use the same function as in Eq 5 . Lastly , we apply auto r egressive model to t on S to represent f AR . The f AR predicts the next state of the agent w .r .t. the average of the states from previous p steps in S . In this paper , we set p = 5 . As mentioned before, we focus on three strategy functions: f HM (Eq 7 ), f LRA (Eq 5 ), and f AR . W e can view them as a mixed strategy , given a supp ort vector ® w = [ w 1 , w 2 , w 3 ] T . f mix ( a , ® w ) = w 1 f ′ HM ( a ) + w 2 f LRA ( a ) + w 3 f AR ( a ) (8) Here a = ( P t , S t − 1 , i ) , w 1 is a support of HM, w 2 is a support of LRA, w 3 is a support of an auto regressive model, and w 1 , w 2 , w 3 ∈ [ 0 , 1 ] . W e use the sum square error (SSE) as our loss function. Our main goal is to nd ® w ∗ that minimizes r is k ( P , S , ® w ∗ , i ) below: r is k (P , S , ® w , i ) = T Õ t = 1 ( D ( t )) T · ( D ( t )) , (9) where D ( t ) = | f mix ( P t , S t − 1 , i , ® w )− S t i | is a dierence between predicted and actual dir ection in which agent i moved at time t . For each agent i , given P train , S train and a threshold vector ® κ = [ k 1 , k 2 , k 3 ] T , we can nd the optimal support vector ® w ∗ as the optimization problem: minimize ® w r is k (P train , S train , ® w , i ) subject to w i ≥ κ i , w i ∈ ® w , κ i ∈ ® κ . Õ i w i = 1 w i , κ i ∈ [ 0 , 1 ] . (10) W e use the Interior point algorithm [ 9 ], which is a large-scale algorithm, to solve Problem 10 , which can be consider as a constrained linear least-squar es problem. A thr eshold ® κ represents a model bias toward specic strategies. For example , if we hav e prior information that, with high probability , an agent i uses LRA strategy function, then we can set κ 2 = 0 . 5 to enfor ce the optimizer to vary the support w 2 within [ 0 . 5 , 1 ] interval instead of the [ 0 , 1 ] interval. The b enet of having ® κ is to prev ent overtting. For any agent i , suppose ® w ∗ i , k is the optimal solution of an optimization problem 10 w .r .t. ® κ k , then we call ( ® w ∗ i , k , ® κ k ) a model. The pseudo code of the model tting is given in Algorithm 2 . 4.3 Model selection Algorithm 3: ModelSelectionFunction input : Position-time-series sets P train , P val , and Direction-time-series S train , S val . output : Supp ort vectors: ® w ∗ 1 , . . . , ® w ∗ n . 1 Setting K = { ® κ k } ; 2 for Each ® κ k in K do Inferring models, ( ® w ∗ 1 , k , ® κ k ) , . . . , ( ® w ∗ n , k , ® κ k ) , from P train , S train using Algorithm 2 ; end 3 Finding the optimal support vectors, ® w ∗ 1 , . . . , ® w ∗ n , from P val , S val using Eq. 11 ; 4 Return ® w ∗ 1 , . . . , ® w ∗ n ; First, we vary ® κ k and nd a model ( ® w ∗ i , k , ® κ k ) for each agent i from P train , S train . As the r esult, we have a set of models Φ i = { ( ® w ∗ i , k , ® κ i , k )} that is now used to perform model selection for an agent i . A CM Trans. Knowl. Discov . Data., V ol. 1, No. 1, Article . Publication date: January 2019. Framework for Inferring Following Strategies from Time Series of Movement Data 15 W e concatenate all time series in P val to be a single time series P val and also concatenate S val to be S val . Finally , for each agent i , w e nd the optimal support vector ® w ∗ i using the equation below: ® w ∗ i = argmin ( ® w ∗ i , k , ® κ k ) ∈ Φ i r is k (P val , S val , ® w ∗ k , i ) . (11) After we get the support vector ® w ∗ i = [ w ∗ i , 1 , w ∗ i , 2 , w ∗ i , 3 ] T , if w ∗ i , 1 is the highest support in ® w ∗ i , then we say that agent i uses the HM strategy function to coordinate with its group. If w ∗ i , 2 has the highest support, then we say that i follows its physical neighb ors to co ordinate with the group. If w ∗ i , 3 has the highest support, then i just follows its own linear path indep endently , and if i ’s path is the target path S w then i is an informed agent. Lastly , if at least two of w ∗ i , 1 , w ∗ i , 2 , w ∗ i , 3 show signicantly high weights, then we conclude that i uses a mixed strategy . The pseudo code of the model selection is given in Algorithm 3 . 5 EXPERIMENT AL SET UP W e test our approach both on simulated and on biological data. 5.1 Simulations W e generated a set of time series of 2-dimensional positions P by four dierent sets of strategy functions: H HM , H LRA , H HM&LRA , and H MIX . A dataset of H HM&LRA is the dataset that contains some agents that use H HM while some other agents use H LRA . In H HM&LRA , when agents use either H HM or H LRA , the y use the same strategy for all time steps. In contrast, a dataset of H MIX has agents that alternately choose to use b etween H HM and H LRA w .r .t. some probability . Hence, agents within H MIX do not use the same strategy for all time steps. W e dene a set of state-time-series S = { S i } as a set of time series of dir ectional degrees of P = { P i } , where P i = ( P 0 i , . . . , P T i ) is a time series of positions of an agent i ; S i = ( S 0 i , . . . , S T i ) is time series of directional degrees of an agent i derived from a position time series P i ; and S t i ∈ (− 180 , 180 ] is a degree angle between a direction vector ® v t i = P t i − P t − 1 i and x -axis direction vector [ 1 , 0 ] T . Note that we ne ed to be careful also of the distance b etween any S t i and S t j since − 179 ◦ and 180 ◦ have a dierence of 359 degrees but very similar implications for coordination. DIST dir ( S t i , S t j ) = | S t i − S t j | , if | S t i − S t j | ≤ 180 360 − | S t i − S t j | , otherwise (12) Where DIST dir ( S t i , S t j ) ∈ [ 0 , 180 ] . W e have only P as an input for our framework since we can create S from P . In all simulated datasets, there are 20 agents and ID(1) is the informed agent. ID(1) creates the target path by uniformly and randomly choosing a xed dir ection S 0 w as the initial state, then continuing to move in the direction of S 0 w until the end of coordination. 5.1.1 Hierarchical Mo del Dynamic System. In this system, we use d a set of strategy function H HM = { f i } to generate P HM where all f i is f HM (Eq. 4 ). The parameter in this model is the following probability ρ ∈ [ 0 , 1 ] . W e set the probability weight of all edges in a probabilistic following network G equal to ρ . The communication network G t generated by G is used to update the directional state S t i by the strategy function f ′ HM . All 19 agents always follow only ID(1) with the probability ρ . In other words, all nodes have edges to ID(1) with the w eight ρ in G . For each coordination event, it lasts 400 time steps. So, P HM = { P 1 , . . . , P 20 } s.t. P i = ( P 0 i , . . . , P 400 i ) . W e vary ρ ∈ { 0 . 25 , 0 . 50 , 0 . 75 , 1 . 00 } . For each ρ , we generated 100 coordination events. In total, we have 400 datasets. A CM Trans. Knowl. Discov . Data., V ol. 1, No. 1, Article . Publication date: January 2019. 16 C. Amornbunchornvej et al. 5.1.2 Local Reversible agreement system. W e created 100 other datasets for the LRA system. W e used a set of strategy function H LRA = { f i } to generate P LRA where all f i is f LRA (Eq. 5 ). For each dataset, it contains a set of time series of positions from 20 agents, P LRA = { P 1 , . . . , P 20 } , where P i = ( P 0 i , . . . , P 400 i ) . All agents updates their state S t i corresponding to their local neighbors’ states using a strategy function f LRA . 5.1.3 Hierarchical and Local Re versible agreement system. W e created 100 other datasets of HM & LRA coordination ev ents by H HM&LRA . W e use this simulation to represent the group that has a coordination inter val even if some agents use the HM strategy function but others use the LRA strategy function. For each dataset, it contains a set of position time series from 20 agents, P HM & LRA = { P 1 , . . . , P 20 } , where P i = ( P 0 i , . . . , P 400 i ) . The ID(1) is the informed agent. Agents who possess ID(2-10) use f HM with ρ = 1 . 00 . The rest of ID(11-20) agents use f LRA . 5.1.4 Mixe d strategy system. Lastly , we created 100 other datasets of mixed strategy of coordination events. For each dataset, it contains a set of 20-agent position time series P MIX = { P 1 , . . . , P 20 } where P i = ( P 0 i , . . . , P 400 i ) is time series of p ositions of agent i . The ID(1) is the informed agent. Other agents updates their state S t i corresponding to both f HM with probability 0 . 5 and f LRA with probability 0 . 5 . 5.1.5 Evaluation. In this section, we evaluate the task of inference of the latent strategies given that we know the set of possible strategies. For each model, we performe d 10-fold cross validation to evaluate the performance. For each round of cross validation, we hav e 100 datasets that can be separated into 45 training datasets, 45 validation datasets, and 10 testing datasets. W e concatenated all time series in P test to b e a single time series P test and also concatenate S test to b e S test . Then we use P test , S test to evaluate the direction prediction performance. W e compare four strategy functions: f HM , f LRA , f AR , and f OPT , which is our framework optimal strategy function derived from Eq. 8 and 11 . W e use the risk function that has Eq. 12 as a loss function to evaluate the mo del performance. r is k (P , S , f , i ) = 1 T T Õ t = 1 DIST dir ( S t i , f ( S t − 1 , P t , i )) (13) For each agent i , the best tting model is the model that minimizes the risk function r is k (P test , S test , f , i ) in Eq. 13 . f ∗ i = argmin f ∈ { f HM , f LRA , f AR , f OPT } r is k (P test , S test , f , i ) (14) For each strategy function f , we report the distribution of loss values of direction prediction from all agents in each time step as well as the gr oup’s av erage optimal weight ® w ∗ i from Eq. 11 . If the framework performs well, then it should give the highest weight for the model that generated the dataset. 5.2 Baboon b ehavioral experiment The dataset is the recording of GPS collars of an oliv e baboon ( Papio anubis ) troop in the wild in Mpala Resear ch Centre, K enya [ 40 ]. The GPS was recorded at 1 Hz from 7am until 7pm. The dataset consists of 16 individuals whose GPS trackers r emained functional for 10 days. A 2-dimensional trajectory of latitude and longitude for each individual has a length of 419,095 time steps. W e extracted coordination events by FLICA varying the network density threshold at 25th, 50th, 75th, and 99th percentile and the time windo w at 240 time steps to infer coordination e vents and 60 time steps to infer a dynamic following network. W e used the 10-fold cross validation to report the results. For each round of cross validation, it has 45% of training, 45% of validation, and 10% of testing A CM Trans. Knowl. Discov . Data., V ol. 1, No. 1, Article . Publication date: January 2019. Framework for Inferring Following Strategies from Time Series of Movement Data 17 coordination events. The remainder of the e valuation follows the description in the Evaluation Section . W e use this experiment to demonstrate the ability of our framework to predict the next movement direction of agents even when the optimal strategy is unknown. The result can be used to generate (and test) hypotheses about the latent coordination strategies in collective movement data. 5.3 Fish behavioral experiment W e used the time series of golden shiners ( Notemigonus crysoleucas ) sh positions from [ 39 ]. The dataset was initially created to study information propagation via the sh visual elds [ 39 ]. In total, there were 24 trails of sh position time series P = { P 1 , . . . , P 24 } in 2-dimensional space. For each P k , it consists of 70 sh, with 10 trained sh who are considered to be informed agents in our setting. On average, the time series in P k has its length around 600 time steps. The trained sh moved toward the fe eding site (the target path) and the group follows them. Due to the lack of information of identity for each individual in the dierent trails, w e cannot train our framework in this dataset. Hence, we use sh data to demonstrate how to apply our frame work to compare performance of each candidate strategy on direction prediction. W e compared the Informed strategy function f TF against f LRA in Eq. 5 . For each time step, f TF updates S t i for any agent i from the average of S t j where j is a traine d sh. W e use the risk function in Eq. 13 to compare the performance among these strategy functions. For each strategy function f , we report the distribution of all agents’ direction prediction error in each time step from DIST dir ( S t i , f ( S t − 1 , P t , i ) . 5.4 Comparison with the state of the art method Our method is the rst approach to infer individual-level strategies that lead to gr oup-level coor- dination. Thus, we compare our framework with the-state-of-the-art method, FLICA [ 4 ], for the task of leadership model classication. Since FLICA cannot infer the individual-level strategy , we evaluate both frameworks at the group-le vel classication task. W e use simulated datasets from Section 5.1 . Each set of time series has its label from one of the four models: HM, LRA, HM & LRA, and Mix strategy model. FLICA maps each set of time series to the leadership ranking and convex hull features. In our framew ork, we use the median of ® w ∗ i (Eq. 11 ) to represent the feature vector of each dataset. W e use 10-fold cross validation on Random Forests [ 23 ] to report the evaluation results for both framew orks. T o evaluate results, we dene true positive (TP), false positive (FP), and false negative (FN) cases as follows. TP is the case when the predicted and ground-truth models of the dataset ar e the same . FP of model X is the case that a dataset that is not generated by model X is predicted as a model X’s dataset. FN of model X is the case when a dataset of model X is predicted to be a model that is not X. W e use TP, FP , and FN to calculate precision, recall, and F1 score to report results. 6 RESULTS 6.1 Simulations The results of inferring the coordination strategy in simulated datasets are sho wn in T able 1 . A row represents the results fr om datasets generated by a sp ecic model. A column represents a strategy prediction error measured in degree units [ 0 ◦ , 180 ◦ ] . OPT is the optimal strategy function trained by our framework. HM is Eq. 7 . LRA is Eq. 5 . AR is the auto regressive strategy function that chooses the current direction t based on the pr evious ve time steps from the same agent. W e use AR as the baseline. In all datasets, our framework ( OPT column) has roughly smallest error among all other strategies. For the rst two rows of HM and LRA datasets, OPT has almost the same performance A CM Trans. Knowl. Discov . Data., V ol. 1, No. 1, Article . Publication date: January 2019. 18 C. Amornbunchornvej et al. T able 1. The result of predicting the direction of movement via 10-fold cross validation. W e compared the result of our framework (OPT) against the base-line pure strategies: HM, LRA, and AR (auto regressive strategy). (*indicates the STD ≥ 20 ◦ ) A verage degree prediction error [ 0 ◦ , 180 ◦ ] Datasets\Strategies OPT HM LRA AR HM 12.40 12.98 20.49 30.21* LRA 7.77* 16.93* 7.76* 13.78* HM & LRA 4.42 13.39* 13.59 23.87* Mixed Str . 29.33* 30.53* 31.69* 46.28* Random 89.74* 90.11* 89.70* 90.21* Baboon 53.16* 53.16* 72.36* 85.84* as the strategies used to generate the data (HM row/column and LRA row/column). For HM & LRA datasets in the third row , each individual might use either HM or LRA strategy . Hence, using the homogeneous strategy to predict directions for all agents results in larger error (HM and LRA column). On the contrar y , our framework can detect which individual uses which strategy . Hence, OPT performed b etter than all pure strategies. Similarly , for the mixed strategy datasets (Mixed Str . row ), each individual might use either HM or LRA as its strategy with the probability 0.5. Since our framework can infer mixed strategies, it performed better than using any pure strategy . Lastly , we reported the results of the direction prediction from the 100 datasets of time series generated from n agents moving uniformly and randomly in any direction (Random r ow). The r esult shows that all strategies included in our framew ork produced the same bad result with the loss value at 90 ◦ degree. This shows that our framew ork does not nd an artifact model where none exists. T able 2. The av erage optimal support vector ® w of all agents from 10-fold cross validation, inferred by our framework from simulate d and the Baboon datasets. A verage Support ® w (predict/actual) Datasets w 1 :HM w 2 :LRA w 3 :AR HM 0.85/1.00 0.12/0.00 0.03/0.00 LRA 0.02/0.00 0.98/1.00 0.00/0.00 HM & LRA (HM part) 1.00/1.00 0.00/0.00 0.00/0.00 HM & LRA (LRA part) 0.00/0.00 1.00/1.00 0.00/0.00 Mixed Strategy 0.48/0.50 0.48/0.50 0.04/0.00 Random 0.09/0.00 0.86/0.00 0.05/0.00 Baboon 1.00/NA 0.00/NA 0.00/NA T able 2 shows the support vectors for each strategy corresponding to the datasets in T able 1 in the OPT column. For each element in the table, the rst number is the predicte d support from our framework and the second is the actual support that w e used to create the datasets. For e xample, in the rst element of HM row , 0.85/1.00 means we used HM strategy to create HM datasets and the framework inferred the HM support in these datasets as 0.85. O verall, our framework correctly inferred the support vectors of all non-random datasets, while avoiding overtting. 6.2 Baboon b ehavioral experiment W e varied the threshold of the following netw ork density to infer coordination events in the bab oon dataset. W e report the average result from all the thresholds. The last row of T able 1 shows the result of the direction prediction of baboons, using dierent co ordination strategies. The OPT A CM Trans. Knowl. Discov . Data., V ol. 1, No. 1, Article . Publication date: January 2019. Framework for Inferring Following Strategies from Time Series of Movement Data 19 coordination strategy , as derived by our framework, is in the last row in T able 2 . According to the result, OPT use d HM as the pure strategy . The errors of HM and OPT strategies suggest that babo ons may have a slight prefer ence to follow a pre-determined individual or a set of individuals, rather than their neighbors in the position space. This is consistent with the biological understanding of the baboon social b ehavior [ 17 ]. Howev er , the more accurate strategy should be investigated and biologically veried. 6.3 Fish behavioral experiment T able 3. Comparison b etween LRA and Informed strategies to predict directions of 24 trails of fish 3 . Error of degree prediction [ 0 ◦ , 180 ◦ ] Strategies Mean STD LRA 41.51 45.11 Informed Strategy 54.46 47.68 The results of the direction prediction in sh datasets, for LRA and Informed strategies, are in T able 3 . The LRA performed better than the Informe d strategy , indicating that sh follow their immediate neighbors in space. This result is supported by the work in [ 25 , 39 ] and many others, showing that sh do not directly know who leads the group but follo w their neighbors. 6.4 Comparison with the state of the art method The result of model classication using FLICA as well as the proposed framework is in Table 4 . In all datasets, the proposed framework performed better than FLICA. This indicates that the group-level features that FLICA pr ovides for classication ar e not suciently informative to be used to categorize complicated datasets where individuals may use a heter ogeneous set of strategies (e .g. HM & LRA). For the baboon and sh datasets, since there is no ground truth available regarding classes of strategies, we can only discuss the results of both datasets from FLICA and the new insight from our proposed framew ork here. The FLICA r esult of classication in [ 4 ] stated that baboons used a linear threshold model to form coordination; there is no association of orders of movement velocity and position of individuals vs. ranking of movement initiation. In other w ords, initiators do not ne cessary move rst or in a front of a group. In this work, T able 1 suggests that there is 3 The reason that sh datasets hav e their own table while other datasets ar e in another table is because of the following reason. T o use 10-fold cross validation, we hav e to be able to learn each individual strategy from one set of coordination events (training datasets) to pr edict the strategy of the same individual in another set of coordination ev ents (validation datasets). In sh datasets, there are 24 sh coordination events. How ever , sh datasets lack of individual identities. Precisely , two individuals with the same ID from two dierent sh-coordination events might not be the same individual. In contrast, two individuals with the same ID from two dierent coordination events are always the same individual in both simulation and baboon datasets. Hence, we cannot use 10-fold cross validation procedure on sh datasets the same way as we did on baboon and simulation datasets. T able 4. The results of mo del classification of FLICA and the proposed framework via 10-fold cross validation. W e use Random Forest for classification. FLICA Proposed Method Classes Precision Re call F1 scor e Precision Recall F1 score HM 1 0.75 0.86 1 1 1 LRA 0.8 1 0.89 1 1 1 HM & LRA 0.94 1 0.97 0.98 1 0.99 Mixed Str . 0.90 0.94 0.92 1 0.98 0.99 Random 1 0.9 0.95 1 1 1 A CM Trans. Knowl. Discov . Data., V ol. 1, No. 1, Article . Publication date: January 2019. 20 C. Amornbunchornvej et al. a hierarchy among baboons; babo ons trend to follow the directions of specic individuals. This result is consistent with the result in [ 3 ] that performed analysis on the same baboon dataset, which showed that there are several pairs of baboons that follow each other with high supports in various situations. For the sh datasets, the result of FLICA framework [ 4 ] suggests that trained sh truly initiated coordination movement. In this work, T able 3 suggests that scho ols of sh used LRA strategy; individuals in school of sh do not follow trained sh directly , but they follow their neighbors. 7 LIMIT A TIONS AND F UT URE W ORK Even though our framework can address Coordina tion Stra tegy Inference Problem , there are several limitations in our work. First, our framework considers only three types of strategies: HM, LRA, and AR. Hence , our frame work can distinguish only whether each agent follows its neighbors (LRA), specic individuals (HM), or itself (AR). Second, our framew ork assumes that there is only one target path that a group tries to form coordination with. In the case of multiple target paths, we need another framework (e.g. mFLICA [ 2 ]) to segment each faction of coordination events that has a dierent target path, then applying our propose d framework to infer individual strategies. Third, our framework considers each agent as a p oint without considering environmental factors (e.g. obstacles, gap between agents before collision, constrains of mov ement). Lastly , our framework assumes that a state of an agent at time t is aected by previous states of other agents and/or itself at time t − 1 . These limitations enable opportunities for future research. 8 CONCLUSIONS In this paper , we formalized a new computational problem, Coordina tion Stra tegy Inference Problem . Given a set of candidate strategies and a set of time series of co ordinated movement as inputs, our goal is to infer the original strategy that each individual used to achie ve the group coordination. W e showed that a strategy that has the convergence property can guarantee that the group reaches coordination. W e provide the rst approach to infer the set of strategies that each individual uses to achieve movement coordination at the group level. W e evaluated and demonstrated our framework performance in simulate d datasets as well as two biological datasets: baboon and sh. Our framework was able to infer the original set of strategy functions that generated each simulate d dataset. The results show that our approach is highly accurate in inferring the correct strategy in simulated datasets even in complicated mixed strategy settings. Moreover , our framework p erformed classication of gr oup-level co ordination models fr om time series b etter than FLICA framework, which is the-state-of-the-art appr oach for the task. Animal data experiments show that shes, unsurprisingly , follow their neighb ors, while bab oons have a preference to follow specic individuals. Although we used the sp ecic setting of focusing on the dir ection of movement as the denition of an agent’s state and used three exemplar candidate strategy , our methodology easily generalizes to arbitrary time series data on Euclidean space, beyond movement data, and other candidate strategies. While for the fairness of comparison with the biological datasets we used simulated data of 20 individuals, it is clear that there are no inherent limitations in the approach to scale to much larger datasets. The only barrier is the availability of data. The code and datasets that we used in this paper can be found at [ 1 ]. REFERENCES [1] [n. d.]. Coordination Mo del Sele ction Frame work co de and data. https://github .com/CompBioUIC/ CoordinationModelSelectionFramework . ([n. d.]). Accessed: 2018-02-06. [2] Chainarong Amornbunchornvej and T anya Berger- W olf. 2018. Framework for inferring leadership dynamics of complex movement from time series. In Proceedings of the 2018 SIAM International Conference on Data Mining . SIAM, A CM Trans. Knowl. Discov . Data., V ol. 1, No. 1, Article . Publication date: January 2019. Framework for Inferring Following Strategies from Time Series of Movement Data 21 549–557. [3] Chainarong Amornbunchornvej and T anya Y . Berger-W olf. 2019. Mining and mo deling complex leadership– followership dynamics of movement data. Social Network A nalysis and Mining 9, 1 (03 Oct 2019), 58. https: //doi.org/10.1007/s13278- 019- 0600- z [4] Chainarong Amornbunchornvej, Ivan Brugere, Ariana Strandburg-Peshkin, Damien Farine, Margaret C Crofoot, and T anya Y Berger- W olf. 2018. Coordination Event Detection and Initiator Identication in Time Series Data. A CM T rans. Knowl. Discov . Data 12, 5, Article 53 (6 2018), 33 pages. https://doi.org/10.1145/3201406 [5] Brian D. O. Anderson and Mengbin Y e. 2019. Recent Advances in the Modelling and Analysis of Opinion Dynamics on Inuence Networks. International Journal of Automation and Computing 16, 2 (01 Apr 2019), 129–149. https: //doi.org/10.1007/s11633- 019- 1169- 8 [6] Mattias Andersson, Joachim Gudmundsson, Patrick Laube, and Thomas W olle. 2008. Reporting leaders and followers among trajectories of moving point objects. Ge oInformatica 12, 4 (2008), 497–528. [7] Daniel S Brown, Michael A Goodrich, Shin- Y oung Jung, and Sean Kerman. 2016. Tw o invariants of human-swarm interaction. Journal of Human-Robot Interaction 5, 1 (2016), 1–31. [8] Daniel S Brown, Sean C Kerman, and Michael A Goodrich. 2014. Human-swarm interactions based on managing attractors. In Proceedings of the 2014 A CM/IEEE international conference on Human-robot interaction . ACM, 90–97. [9] Richard H. Byrd, Mary E. Hribar , and Jorge Nocedal. 1999. An Interior Point Algorithm for Large-Scale Nonlinear Programming. SIAM Journal on Optimization 9, 4 (1999), 877–900. https://doi.org/10.1137/S1052623497325107 [10] Y . Cao, W . Yu, W . Ren, and G. Chen. 2013. An O verview of Recent Progress in the Study of Distributed Multi- Agent Coordination. IEEE T ransactions on Industrial Informatics 9, 1 (Feb 2013), 427–438. https://doi.org/10.1109/TII.2012. 2219061 [11] Bernard Chazelle. 2011. The T otal s-Energy of a Multiagent System. SIAM Journal on Control and Optimization 49, 4 (2011), 1680–1706. https://doi.org/10.1137/100791671 arXiv: https://doi.org/10.1137/100791671 [12] B. Chazelle. 2019. A Sharp Bound on the s -Energy and Its Applications to A veraging Systems. IEEE T rans. Automat. Control 64, 10 (Oct 2019), 4385–4390. https://doi.org/10.1109/T AC.2019.2899509 [13] Iain D Couzin, Jens Krause, Richard James, Graeme D Ruxton, and Nigel R Franks. 2002. Collective memory and spatial sorting in animal groups. Journal of theoretical biology 218, 1 (2002), 1–11. [14] Margaret C Crofoot, Roland W Kays, and Martin Wikelski. 2015. Data from: Shared decision-making drives collective movement in wild baboons. (2015). [15] John RG Dyer , Anders Johansson, Dirk Helbing, Iain D Couzin, and Jens Krause. 2009. Leadership, consensus decision making and collective behaviour in humans. P hilosophical T ransactions of the Royal Society of London B: Biological Sciences 364, 1518 (2009), 781–789. [16] S Rasoul Etesami. 2019. A Simple Framework for Stability Analysis of State-Dependent Networks of Heterogeneous Agents. SIAM Journal on Control and Optimization 57, 3 (2019), 1757–1782. [17] Damien R Farine, Ariana Strandburg-Peshkin, T anya Berger-W olf, Brian Ziebart, Ivan Brugere, Jia Li, and Margaret C Crofoot. 2016. Both near est neighb ours and long-term aliates predict individual locations during collective movement in wild baboons. Scientic reports 6 (2016), 27704. [18] Jacques Gautrais, Francesco Ginelli, Richard Fournier , StÃľphane Blanco, Marc Soria, Hugues ChatÃľ, and Guy Theraulaz. 2012. Deciphering Interactions in Moving Animal Groups. PLOS Computational Biology 8, 9 (09 2012), 1–11. https://doi.org/10.1371/journal.pcbi.1002678 [19] Amit Goyal, Francesco Bonchi, and Laks VS Lakshmanan. 2008. Discovering leaders from community actions. In Proceedings of the 17th A CM confer ence on Information and knowledge management . ACM, 499–508. [20] Amit Goyal, Francesco Bonchi, and Laks VS Lakshmanan. 2010. Learning inuence probabilities in social networks. In Proceedings of the thir d A CM international conference on W eb search and data mining . A CM, 241–250. [21] Xinran He and David Kempe. 2016. Robust Inuence Maximization. In Proceedings of the ninth A CM SIGKDD . A CM, 1–10. [22] James E. Herbert-Read, Andrea Perna, Richar d P. Mann, Timothy M. Schaerf, David J. T . Sumpter , and Ashley J. W . W ard. 2011. Inferring the rules of interaction of shoaling sh. Procee dings of the National Academy of Sciences 108, 46 (2011), 18726–18731. https://doi.org/10.1073/pnas.1109355108 [23] Tin Kam Ho. 1998. The random subspace method for constructing decision forests. IEEE Transactions on Pattern A nalysis and Machine Intelligence 20, 8 (1998), 832–844. [24] Michael Hrncir , Camila Maia-Silva, and W alter M. Farina. 2019. Hone y bee workers generate low-frequency vibrations that are reliable indicators of their activity level. Journal of Comparative Physiology A 205, 1 (01 Feb 2019), 79–86. https://doi.org/10.1007/s00359- 018- 1305- x [25] Y ael Katz, Kolbjørn T unstrøm, Christos C. Ioannou, Cristián Huepe, and Iain D. Couzin. 2011. Inferring the structure and dynamics of interactions in schooling sh. Proc. of the National Academy of Sciences 108, 46 (2011), 18720–18725. https://doi.org/10.1073/pnas.1107583108 A CM Trans. Knowl. Discov . Data., V ol. 1, No. 1, Article . Publication date: January 2019. 22 C. Amornbunchornvej et al. [26] David Kempe, Jon Kleinberg, and Éva T ardos. 2003. Maximizing the spread of inuence through a social network. In Proceedings of the ninth A CM SIGKDD . A CM, 137–146. [27] S. Kerman, D . Brown, and M. A. Goodrich. 2012. Supporting human interaction with robust robot swarms. In 2012 5th International Symp osium on Resilient Control Systems . 197–202. https://doi.org/10.1109/ISRCS.2012.6309318 [28] Mikkel Baun Kjargaard, Henrik Blunck, Markus Wustenberg, Kaj Gronbask, Martin Wirz, Daniel Roggen, and Gerhard Troster . 2013. Time-lag method for detecting following and leadership behavior of pedestrians from mobile sensing data. In Proceedings of the IEEE PerCom . IEEE, 56–64. [29] J Krause, D Hoare, S Krause , CK Hemelrijk, and DI Rubenstein. 2000. Leadership in sh shoals. Fish and Fisheries 1, 1 (2000), 82–89. [30] Roland Langrock, J. Grant C. Hopcraft, Paul G. Blackw ell, Victoria Goodall, Ruth King, Mu Niu, T oby A. Patterson, Martin W . Pe dersen, Anna Skarin, and Robert S. Schick. 2014. Mo delling group dynamic animal movement. Methods in Ecology and Evolution 5, 2 (2014), 190–199. https://doi.org/10.1111/2041- 210X.12155 [31] Frank L Lewis, Hongwei Zhang, Kristian Hengster-Movric, and Abhijit Das. 2013. Cooperative contro l of multi-agent systems: optimal and adaptive design approaches . Springer Science & Business Media. [32] Ugo Lop ez, Jacques Gautrais, Iain D Couzin, and Guy Theraulaz. 2012. From behavioural analyses to mo dels of collective motion in sh schools. Interface focus 2, 6 (2012), 693–707. [33] Thomas W Malone and Kevin Crowston. 1994. The interdisciplinary study of coordination. A CM Computing Surveys (CSUR) 26, 1 (1994), 87–119. [34] Richard P. Mann, Andrea Perna, Daniel Str Ãűmbom, Roman Garnett, James E. Herbert-Read, David J. T . Sumpter , and Ashley J. W . W ard. 2013. Multi-scale Inference of Interaction Rules in Animal Groups Using Bayesian Model Selection. PLOS Computational Biology 9, 3 (03 2013), 1–13. https://doi.org/10.1371/journal.pcbi.1002961 [35] Anton V . Proskurnikov and Roberto T empo. 2018. A tutorial on modeling and analysis of dynamic social networks. Part II. A nnual Re views in Control 45 (2018), 166 – 190. https://doi.org/10.1016/j.arcontrol.2018.03.005 [36] Huaxin Qiu and Haibin Duan. 2020. A multi-objective pigeon-inspired optimization approach to U A V distributed ocking among obstacles. Information Sciences 509 (2020), 515–529. [37] Subash K Ray , Gabriele V alentini, Purva Shah, Abid Haque, Chris R Reid, Gregory F W eb er , and Simon Garnier . 2019. Information transfer during foo d choice in the slime mold Physarum polycephalum. Frontiers in Ecology and Evolution 7 (2019), 67. [38] Craig W Reynolds. 1987. Flocks, herds and scho ols: A distributed behavioral model . V ol. 21. ACM. [39] A. Strandburg-Peshkin and et al. 2013. Visual sensor y networks and eective information transfer in animal groups. Current Biology 23, 17 (2013), R709–R711. [40] Ariana Strandburg-Peshkin, Damien R Farine, Iain D Couzin, and Margaret C Crofoot. 2015. Shared decision-making drives collective movement in wild baboons. Science 348, 6241 (2015), 1358–1361. [41] Housheng Su, Xiaofan W ang, and W en Y ang. 2008. F locking in multi-agent systems with multiple virtual leaders. Asian Journal of control 10, 2 (2008), 238–245. [42] Gabriele V alentini. 2019. How robots in a large group make decisions as a whole? From biological inspiration to the design of distributed algorithms. arXiv preprint arXiv:1910.11262 (2019). [43] Peter Whitle. 1951. Hypothesis testing in time series analysis . V ol. 4. Almqvist & Wiksells. A CM Trans. Knowl. Discov . Data., V ol. 1, No. 1, Article . Publication date: January 2019.
Original Paper
Loading high-quality paper...
Comments & Academic Discussion
Loading comments...
Leave a Comment