Simulation Assisted Likelihood-free Anomaly Detection
Given the lack of evidence for new particle discoveries at the Large Hadron Collider (LHC), it is critical to broaden the search program. A variety of model-independent searches have been proposed, adding sensitivity to unexpected signals. There are …
Authors: ** Kyle Cranmer, Johann Brehmer, Gilles Louppe
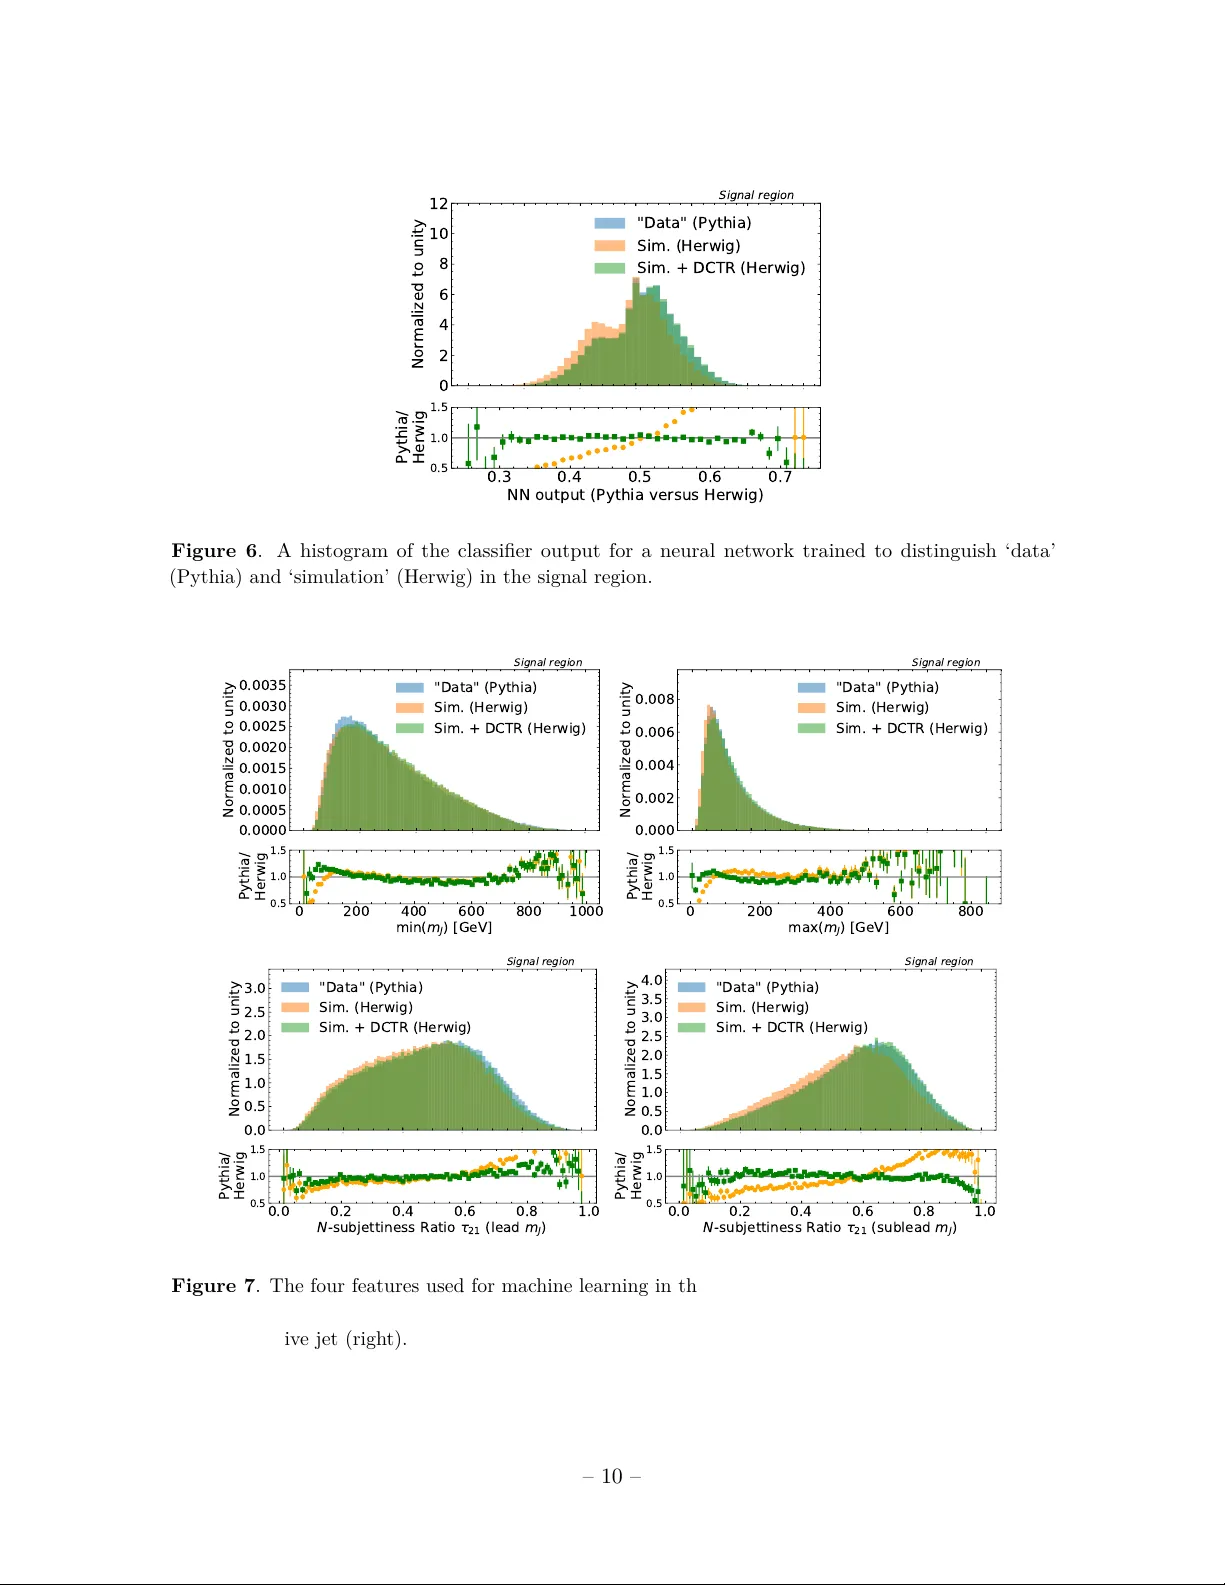
Simulation Assisted Lik eliho o d-free Anomaly Detection Anders Andreassen, 1 Benjamin Nachman, 2 and David Shih 2 , 3 , 4 1 Go o gle, Mountain V iew, CA 94043, USA 2 Physics Division, L awr enc e Berkeley National L ab or atory, Berkeley, CA 94720, USA 3 NHETC, Dept. of Physics and A str onomy, Rutgers, Pisc ataway, NJ 08854, USA 4 Berkeley Center for The or etic al Physics, University of California, Berkeley, CA 94720, USA E-mail: ajandreassen@google.com , bpnachman@lbl.gov , shih@physics.rutgers.edu Abstract: Giv en the lack of evidence for new particle discov eries at the Large Hadron Collider (LHC), it is critical to broaden the searc h program. A v ariety of mo del-indep enden t searc hes ha v e b een prop osed, adding sensitivity to unexpected signals. There are generally tw o t yp es of such searches: those that rely hea vily on sim ulations and those that are entirely based on (unlab eled) data. This pap er introduces a h ybrid metho d that makes the b est of b oth approac hes. F or p oten tial signals that are resonan t in one kno wn feature, this new metho d first learns a parameterized rew eighting function to morph a giv en simulation to matc h the data in sidebands. This function is then interpolated in to the signal region and then the rew eighted background-only simulation can b e used for sup ervised learning as w ell as for bac kground estimation. The bac kground estimation from the rew eighted simulation allows for non-trivial correlations b et w een features used for classification and the resonan t feature. A dijet search with jet substructure is used to illustrate the new metho d. F uture applications of Simulation Assisted Likelihoo d-free Anomaly Detection ( salad ) include a v ariety of final states and p oten tial com binations with other mo del-indep enden t approaches. Con tents 1 Introduction 1 2 Metho ds 3 3 Simulation 4 4 Parameterized Reweigh ting with DCTR 8 5 Sensitivity 11 6 Background Estimation 12 7 Conclusions 14 1 In tro duction An immense searc h effort b y the LHC collab orations has successfully prob ed many extreme regions of the Standard Mo del phase space [ 1 – 7 ]. Despite strong theoretical and non-collider exp erimen tal motiv ation, there is curren tly no convincing evidence for new particles or forces of nature from the LHC searches. Ho w ever, man y final states are uncov ered [ 8 , 9 ] and the full hyperv ariate phase space accessible by mo dern detector tec hnology is only starting to b e prob ed holistically with deep learning metho ds [ 10 – 13 ]. There is a great need for new searc hes that can identify unexp ected scenarios. Un til recently , nearly all mo del indep enden t searches relied hea vily on sim ulation. Generi- cally , these searc hes op erate b y comparing data with bac kground-only simulation in a large n umber of phase space regions. Such searc hes hav e b een p erformed without machine learning at D0 [ 14 – 17 ], H1 [ 18 , 19 ], CDF [ 20 – 22 ], CMS [ 23 , 24 ], and A TLAS [ 25 – 27 ]. A recent phe- nomenological study prop osed extending this idea to deep learning classifiers [ 28 , 29 ]. While indep enden t of signal mo dels, these approac hes are dependent on the fidelit y of the background mo del simulation for b oth signal sensitivit y and bac kground accuracy . If the bac kground sim ulation is inaccurate, then differences b et ween simulation and (bac kground-only) data will hide p otential signals. Ev en if a biased simulation can find a signal, if the background is mis-mo deled, then the signal sp ecificity will b e p o or. A v ariety of approaches hav e b een prop osed to enhance signal sensitivity without sim- ulations. Suc h prop osals are based on clustering or nearest neigh b or algorithms [ 30 – 32 ], auto enco ders [ 33 – 38 ], probabilistic mo deling [ 39 ], weak supervision [ 40 , 41 ], density esti- mation [ 42 ], and others [ 43 ]. These approac hes must als o b e combined with a bac kground – 1 – estimation strategy . If sim ulation is used to estimate the background, then the sp ecificity is the same as the mo del-dep enden t searches. Man y of these approac hes can b e com bined with a resonance search, as explicitly demonstrated in Ref. [ 40 , 41 ]. The background estimation strategy may imp ose additional constrain ts on the learning, such as the need for decorrelation b et w een a resonan t feature and other discriminative features [ 44 – 54 ]. A detailed ov erview of mo del indep enden t approaches can b e found in Ref. [ 42 ]. While it is desirable to b e robust to bac kground mo del inaccuracies, it is also useful to incorp orate information from Standard Mo del simulations. Even though these sim ulations are only an approximation to nature, they include an extensiv e set of fundamental and phenomenological physics mo dels describing the highest energy reactions all the w a y to signal formation in the detector electronics. This pap er describ es a metho d that uses a background sim ulation in a w ay that depends as little on that sim ulation as possible. In particular, a mod el based on the De ep neur al networks using Classific ation for T uning and R eweighting ( dctr ) pro cedure [ 55 ] is trained in a region of phase space that is exp ected to b e dev oid of signals. In a resonance searc h, there is one feature where the signal is known to b e lo calized and the sideband can b e used to train the dctr mo del. This rew eighting function learns to morph the sim ulation into the data and is parameterized in the feature(s) used to mask p otential signals. Then, the mo del is in terp olated to the signal-sensitiv e region and the rew eighted background sim ulation can b e used for both enhancing signal sensitivity and estimating the Standard Mo del background. As deep learning classifiers can naturally prob e high dimensional spaces, this reweigh ting mo del can in principle exploit the full phase space for b oth enhancing signal sensitivit y and sp ecificit y . This pap er is organized as follo ws. Section 2 introduces the Simulation A ssiste d Likeliho o d- fr e e A nomaly Dete ction ( salad ) metho d. A dijet search at the LHC is em ulated to illustrate the new metho d. The sim ulation and deep learning setup are introduced in Sec. 3 and then the application of dctr is sho wn in Sec. 4 . The signal sensitivity and sp ecificit y are presen ted in Sec. 5 and 6 , resp ectively . The pap er ends with conclusions and outlo ok in Sec. 7 . – 2 – 2 Metho ds Let m b e a feature (or set of features) that can b e used to lo calize a p otential signal in a signal region (SR). F urthermore, let x b e another set of features which are useful for isolating a potential signal. The protot ypical example is a resonance search where m is the single resonan t feature, such as the in v ariant mass of tw o jets, while x are other properties of the ev ent, such as the substructure of the tw o jets. The salad metho d then pro ceeds as follo ws: 1. T rain a classifier f to distinguish data and sim ulation for m 6∈ SR . This classifier is parameterized in m b y simply augmenting x with m , f = f ( x, m ) [ 56 , 57 ]. If f is trained using the binary cross entrop y or the mean squared error loss, then asymptotically , a w eight function w ( x | m ) is defined b y w ( x | m ) ≡ f ( x ) 1 − f ( x ) = p ( x | data ) p ( x | sim ulation ) × p ( data ) p ( sim ulation ) , (2.1) where the last factor in Eq. 2.1 is an ov erall constant that is the ratio of the total amoun t of data to the total amount of simulation. This prop erty of neural netw orks to learn lik eliho o d ratios has b een exploited for a v ariet y of full phase space reweigh ting and parameter estimation prop osals in high energy ph ysics [ 55 , 56 , 58 – 61 ]. 2. Sim ulated even ts in the SR are reweigh ted using w ( x | m ) . The function w ( x | m ) is in terp olated automatically by the neural netw ork. A second classifier g ( x ) is used to distinguish the reweigh ted sim ulation from the data. This can b e ac hiev ed in the usual w ay with a weigh ted loss function such as the binary cross-en tropy: loss ( g ( x )) = − X m i ∈ SR data log g ( x i ) − X m i ∈ SR simulation w ( x i | m i ) log(1 − g ( x i )) . (2.2) Ev ents are then selected with large v alues of g ( x ) . Asymptotically 1 , g ( x ) will b e monotonically related with the optimal classifier: g ( x ) 1 − g ( x ) ∝ p ( x | signal+bac kground ) p ( x | bac kground ) . (2.3) It is imp ortan t that the same data are not used for training and testing. The easiest w ay to achiev e this is using different partitions of the data for these t wo tasks. One can mak e use of more data with a cross-v alidation pro cedure [ 40 , 41 ]. 1 Sufficien tly flexible neural netw ork arc hitecture, enough training data, and an effectiv e optimization pro cedure. – 3 – 3. One could com bine the previous step with a standard data-driven bac kground estimation tec hnique like a sideband fit or the ABCD metho d. Ho w ev er, one can also directly use the weigh ted simulation to predict the num b er of even ts that should pass a threshold requiremen t on g ( x ) : N predicted ( c ) = X m i ∈ SR simulation w ( x i | m i ) I [ g ( x i ) > c ] , (2.4) for some threshold v alue c . The adv antage of Eq. 2.4 ov er other data-based metho ds is that g ( x ) could b e correlated with m ; for sideband fits, thresholds requirements on g cannot sculpt lo cal features in the m sp ectrum. 3 Sim ulation A large-radius dijet resonance search is used to illustrate the salad metho d. The simulations are from the LHC Olympics 2020 communit y c hallenge R&D dataset [ 62 ]. The background pro cess is generic 2 → 2 parton scattering (lab eled QCD for quan tum chromodynamics) and the signal is a hypothetical W 0 b oson that decays into an X b oson and Y b oson. Each of the X and Y deca y to quarks. The masses of the W 0 , X , and Y particles are 3.5, 0.5, and 0.1 T e V, resp ectiv ely . The mass hierarch y b et ween the W 0 particle and its deca y pro ducts means that the X and Y particles are Loren tz b o osted in the lab frame and therefore their tw o-prong decay pro ducts are captured inside a single large-radius jet. P article-level simulations are pro duced with P ythia 8 [ 63 , 64 ] or Herwig++ [ 65 ] withou t pileup or multiple parton in teractions and a detector simulation is p erformed with Delphes 3.4.1 [ 66 – 68 ]. P article flow ob jects are clustered in to jets using the F astjet [ 69 , 70 ] implementation of the an ti- k t algorithm [ 71 ] using R = 1 . 0 as the jet radius. Ev en ts are selected by requiring at least one such jet with p T > 1 . 3 T e V. In the remaining studies, the Pythia dataset is treated as ‘data’, while the Herwig dataset is treated as ‘simulation’, to mimic the s cenario in practice where the simulation is different than data. Figure 1 presents the inv ariant mass of the leading tw o jets. The p T selection is evident from the p eak around 3 T e V. The signal p eaks around the W 0 mass and aside from the kinematic feature from the jet selection, the background distribution is featureless. The sp ectra from Pythia and Herwig are nearly iden tical, which ma y be exp ected since the inv ariant mass is mostly determined by hard-scatter matrix elemen ts and not final state effects. T o demonstrate the salad approac h, tw o features 2 ab out eac h of the leading jets are used for classification. The first feature is the jet mass and the second feature is the N -sub jettiness ratio [ 73 , 74 ] τ 21 = τ 2 /τ 1 . This second feature is the most widely used feature for differen tiating jets that ha ve tw o hard prongs (as in the signal) from jets that hav e only one hard prong (as for 2 In principle, salad can readily accommo date the full phase space as used by the original dctr metho d [ 55 ] based on particle flow netw orks [ 72 ]; this will b e explored in future studies. – 4 – 2000 4000 6000 8000 10000 1 0 0 1 0 1 1 0 2 1 0 3 1 0 4 1 0 5 Events "Data" (Pythia) Sim. (Herwig) Signal 2000 4000 6000 8000 10000 m J J [ G e V ] 0.50 0.75 1.00 1.25 1.50 Pythia/ Herwig Figure 1 . The in v ariant mass of the leading tw o jets. most of the background). The t w o jets are ordered by their mass and the four features used for mac hine learning are presented in Fig. 2 . As exp ected, the signal mass distributions sho w p eaks at the X and Y masses and the τ 21 distributions are small, indicating tw o-prong substructure. Pythia and Herwig differ mostly at low mass and across the en tire τ 21 distribution. The baseline p erformance for classifying signal v ersus the QCD background is presen ted in Fig. 3 . As is the case for all neural net works presented in the follo wing sections, three fully connected lay ers with 100 hidden no des on each in termediate lay er are implemen ted using Keras [ 75 ] and T ensorFlow [ 76 ] with the Adam [ 77 ] optimization algorithm. Rectified linear units are the activ ation function for all in termediate lay ers and the sigmoid is used for the final output lay er. Net works are trained with binary cross entrop y for 50 ep o chs with early stopping (with patience 10). The sup ervised classifier presented in Fig. 3 effectively differen tiates signal from bac kground, with a maxim um significance improv emen t of ab out 10. It is exp ected that the p erformance of any mo del indep endent approac h will b e b ounded from ab o v e by the p erformance of this classifier. – 5 – 0 200 400 600 800 1000 1 0 0 1 0 1 1 0 2 1 0 3 1 0 4 1 0 5 1 0 6 Events "Data" (Pythia) Sim. (Herwig) Signal 0 200 400 600 800 1000 m a x ( m J ) [ G e V ] 0.50 0.75 1.00 1.25 1.50 Pythia/ Herwig 0 200 400 600 800 1000 1 0 0 1 0 1 1 0 2 1 0 3 1 0 4 1 0 5 Events "Data" (Pythia) Sim. (Herwig) Signal 0 200 400 600 800 1000 m i n ( m J ) [ G e V ] 0.50 0.75 1.00 1.25 1.50 Pythia/ Herwig 0.0 0.2 0.4 0.6 0.8 1.0 0.0 0.5 1.0 1.5 2.0 2.5 3.0 3.5 4.0 Normalized to unity "Data" (Pythia) Sim. (Herwig) Signal 0.0 0.2 0.4 0.6 0.8 1.0 N - s u b j e t t i n e s s R a t i o 2 1 ( l e a d m J ) 0.50 0.75 1.00 1.25 1.50 Pythia/ Herwig 0.0 0.2 0.4 0.6 0.8 1.0 0.0 0.5 1.0 1.5 2.0 2.5 3.0 3.5 Normalized to unity "Data" (Pythia) Sim. (Herwig) Signal 0.0 0.2 0.4 0.6 0.8 1.0 N - s u b j e t t i n e s s R a t i o 2 1 ( s u b l e a d m J ) 0.50 0.75 1.00 1.25 1.50 Pythia/ Herwig Figure 2 . The four features used for mac hine learning: jet mass (top) and the N -sub jettiness ratios τ 21 (b ottom) for the more massiv e jet (left) and the less massive jet (right). – 6 – 0.0 0.2 0.4 0.6 0.8 1.0 0.0 2.5 5.0 7.5 10.0 12.5 15.0 17.5 Normalized to unity "Data" (Pythia) Sim. (Herwig) Signal 0.0 0.2 0.4 0.6 0.8 1.0 NN output (Pythia versus Signal) 0.50 0.75 1.00 1.25 1.50 Pythia/ Herwig 0.0 0.2 0.4 0.6 0.8 1.0 Signal Rate 1 0 0 1 0 1 1 0 2 1 0 3 1 0 4 1 0 5 1 / QCD Rate Pythia versus Signal Random 0.0 0.2 0.4 0.6 0.8 1.0 Signal Rate 0 2 4 6 8 10 12 14 S / B Pythia versus Signal Random Figure 3 . A sup ervised classifier trained to distinguish signal from Pythia QCD. The top plot is a histogram of the neural netw ork output, the left bottom plot is a Receiv er Op erating Characteristic (R OC) curv e, and the righ t b ottom plot is a significance improv ement (SIC) curv e. S is the signal efficiency or true p ositiv e rate and B is the background efficiency or false p ositive rate. – 7 – 4 P arameterized Reweigh ting with DCTR The first step of the dctr rew eighting pro cedure is to train a classifier to distinguish the ‘data’ (Pythia) from the ‘simulation’ (Herwig) in a sideband region. The output of suc h a classifier is sho wn in Fig. 4 , where the signal region is defined as m j j 6∈ [3250 , 3750] Ge V. There are ab out 850k even ts in the sideband region and 150k even ts in the signal region. Unlik e the classifier in Fig. 3 , the separation in Fig. 4 is not as dramatic b ecause Pythia and Herwig are muc h more similar than signal is with QCD. As exp ected, the netw ork is a linear function of the lik eliho o d ratio so the ratio plot in Fig. 4 is linear. In terestingly , the signal is more Herwig-like than Pythia-like. The rew eigh ting function is applied to the Herwig in Fig. 4 to show that the rew eighted sim ulation (Sim.+ dctr ) lo oks nearly iden tical to the ‘Data’ . All of the ev ents used for Fig. 4 are indep endent from the ones used for training the net work. Figure 5 shows shows that this reweigh ting works for all of the input distributions to the neural net work as w ell. 0.2 0.3 0.4 0.5 0.6 0.7 0.8 0 2 4 6 8 10 Normalized to unity S i d e b a n d r e g i o n "Data" (Pythia) Sim. (Herwig) Sim. + DCTR (Herwig) Signal 0.2 0.3 0.4 0.5 0.6 0.7 0.8 NN output (Pythia versus Herwig) 0.5 1.0 1.5 Pythia/ Herwig Figure 4 . A histogram of the classifier output for a neural netw ork trained to distinguish ‘data’ (Pythia) and ‘simulation’ (Herwig) in the sideband region. The next step for salad is to in terp olate the rewei gh ting function. The neural netw ork presen ted in Fig. 4 is trained conditional on m j j and so it can b e ev aluated in the SR for v alues of the inv ariant mass that w ere not av ailable during the net work training. Note that the signal region m ust b e c hosen large enough so that the signal contamination in the sideband do es not bias the reweigh ting function. F or this example, for 25% signal fraction in the signal region, the con tribution in the sideband is ab out 1% and has no impact on the dctr mo del. Figure 6 sho ws a classifier trained to distinguish ‘data’ and ’simulation’ in the signal region b efore and after the application of the interpolated dctr mo del. There is excellent closure, also for each of the input features to the classifier as sho wn in Fig. 7 . – 8 – 0 200 400 600 800 1000 0.0000 0.0005 0.0010 0.0015 0.0020 0.0025 0.0030 0.0035 0.0040 Normalized to unity S i d e b a n d r e g i o n "Data" (Pythia) Sim. (Herwig) Sim. + DCTR (Herwig) 0 200 400 600 800 1000 m i n ( m J ) [ G e V ] 0.5 1.0 1.5 Pythia/ Herwig 0 200 400 600 800 1000 0.000 0.002 0.004 0.006 0.008 0.010 Normalized to unity S i d e b a n d r e g i o n "Data" (Pythia) Sim. (Herwig) Sim. + DCTR (Herwig) 0 200 400 600 800 1000 m a x ( m J ) [ G e V ] 0.5 1.0 1.5 Pythia/ Herwig 0.0 0.2 0.4 0.6 0.8 1.0 0.0 0.5 1.0 1.5 2.0 2.5 3.0 Normalized to unity S i d e b a n d r e g i o n "Data" (Pythia) Sim. (Herwig) Sim. + DCTR (Herwig) 0.0 0.2 0.4 0.6 0.8 1.0 N - s u b j e t t i n e s s R a t i o 2 1 ( l e a d m J ) 0.5 1.0 1.5 Pythia/ Herwig 0.0 0.2 0.4 0.6 0.8 1.0 0.0 0.5 1.0 1.5 2.0 2.5 3.0 3.5 4.0 Normalized to unity S i d e b a n d r e g i o n "Data" (Pythia) Sim. (Herwig) Sim. + DCTR (Herwig) 0.0 0.2 0.4 0.6 0.8 1.0 N - s u b j e t t i n e s s R a t i o 2 1 ( s u b l e a d m J ) 0.5 1.0 1.5 Pythia/ Herwig Figure 5 . The four features used for mac hine learning in the sideband region, b efore and after applying dctr : jet mass (top) and the N -sub jettiness ratios τ 21 (b ottom) for the more massive jet (left) and the less massive jet (righ t). – 9 – 0.2 0.3 0.4 0.5 0.6 0.7 0.8 0 2 4 6 8 10 12 Normalized to unity S i g n a l r e g i o n "Data" (Pythia) Sim. (Herwig) Sim. + DCTR (Herwig) 0.3 0.4 0.5 0.6 0.7 NN output (Pythia versus Herwig) 0.5 1.0 1.5 Pythia/ Herwig Figure 6 . A histogram of the classifier output for a neural netw ork trained to distinguish ‘data’ (Pythia) and ‘simulation’ (Herwig) in the signal region. 0 200 400 600 800 1000 0.0000 0.0005 0.0010 0.0015 0.0020 0.0025 0.0030 0.0035 Normalized to unity S i g n a l r e g i o n "Data" (Pythia) Sim. (Herwig) Sim. + DCTR (Herwig) 0 200 400 600 800 1000 m i n ( m J ) [ G e V ] 0.5 1.0 1.5 Pythia/ Herwig 0 200 400 600 800 1000 0.000 0.002 0.004 0.006 0.008 Normalized to unity S i g n a l r e g i o n "Data" (Pythia) Sim. (Herwig) Sim. + DCTR (Herwig) 0 200 400 600 800 m a x ( m J ) [ G e V ] 0.5 1.0 1.5 Pythia/ Herwig 0.0 0.2 0.4 0.6 0.8 1.0 0.0 0.5 1.0 1.5 2.0 2.5 3.0 Normalized to unity S i g n a l r e g i o n "Data" (Pythia) Sim. (Herwig) Sim. + DCTR (Herwig) 0.0 0.2 0.4 0.6 0.8 1.0 N - s u b j e t t i n e s s R a t i o 2 1 ( l e a d m J ) 0.5 1.0 1.5 Pythia/ Herwig 0.0 0.2 0.4 0.6 0.8 1.0 0.0 0.5 1.0 1.5 2.0 2.5 3.0 3.5 4.0 Normalized to unity S i g n a l r e g i o n "Data" (Pythia) Sim. (Herwig) Sim. + DCTR (Herwig) 0.0 0.2 0.4 0.6 0.8 1.0 N - s u b j e t t i n e s s R a t i o 2 1 ( s u b l e a d m J ) 0.5 1.0 1.5 Pythia/ Herwig Figure 7 . The four features used for mac hine learning in the signal region, before and after applying dctr : jet mass (top) and the N -sub jettiness ratios τ 21 (b ottom) for the more massive jet (left) and the less massive jet (righ t). – 10 – 5 Sensitivit y After reweigh ting the signal region to match the data, the next step of the searc h is to train a classifier to distinguish the reweigh ted simulation from the data in the signal region. If the reweigh ting works exactly , then this new classifier will asymptotically learn p ( signal + bac kground ) /p ( bac kground ) , which is the optimal classifier b y the Neyman-P earson lemma [ 78 ]. If the reweigh ting is suboptimal, then some of the classifier capacity will b e div erted to learning the residual difference b et w een the simulation and bac kground data. If the rew eighted sim ulation is nothing lik e the data, then all of the capacity will go tow ards this task and it will not b e able to iden tify the signal. There is therefore a tradeoff b etw een ho w different the (rew eighted) simulation is from the data and ho w different the signal is from the background. If the signal is m uch more different from the background than the simulation is from the bac kground data, it is p ossible that a sub-optimally reweigh ted sim ulation will still b e able to iden tify the signal (see Sec. 6 for problems with background estimation). Figure 8 sho ws the sensitivity of the salad tagger to signal as a function of the signal- to-bac kground ratio ( S/B ) in the signal region. In all cases, the background is the QCD sim ulation using Pythia 3 . The Pythia lines corresp ond to the case where the sim ulation follows the same statistics as the data ( = Pythia). The area under the curve (AUC) should b e as close to one as p ossible and a tagger that is op erating uniformly at random will pro duce an A UC of 0.5. Anti-tagging (preferen tially tagging even ts that are not signal-like) results in an A UC less then 0.5. The maximum significance impro vemen t is calculated as the largest v alue of S / √ B + 0 . 01% , where the 0.01% offset regulates statistical fluctuations at low efficiency . When the S/B ∼ O (1) , then the p erformance in Fig. 8 is similar to the fully sup ervised classifier presented in Sec. 3 . As S/B → 0 , the Pythia curv es approac h the random classifier, with an A UC of 0.5 and a max significance improv ement of unit y . The Herwig curv e has an AUC less than 0.5 as S/B → 0 b ecause the signal is more Herwig-like than Pythia-lik e (see Fig. 4 ) and thus a tagger that requires the features to b e data-like (data = Pythia) will an ti-tag the signal. Lik ewise, the efficiency of the tagger on the simulation is higher than 50% when placing a threshold on the NN that keeps 50% of the even ts in data. The maximum significance improv ement quic kly drops to unity for Herwig when S/B . 1% , indicating the the netw ork is sp ending more capacity on differentiating Pythia from Herwig than finding signal. F or all four metrics, salad significantly impro ves the p erformance of the Herwig-only approac h. In particular, the salad tagger is effectiv e to ab out S/B . 0 . 5% , whereas the Herwig-only tagger is only able to pro vide useful discrimination p ow er down to ab out S/B ∼ 1% . F or the significance improv emen t and false p ositive rate at a fixed true p ositive rate, the salad tagger tracks the Pythia tagger almost exactly do wn to b elo w 1%. The 3 Note that the full one million Pythia even ts are divided in tw o pieces, one that acts as the test set for all metho ds and one that is used for further study . The remaining half is further split in half to represen t the data or the simulation for the lines marked ‘Pythia’ in Fig. 8 . F or a fair comparison, the Herwig statistics are comparable to 25% of the full Pythia dataset. – 11 – A UC ab out half w ay b etw een Pythia and Herwig at high S/B , which is indicative of p o or p erformance at low efficiency . 1 0 3 1 0 2 1 0 1 Signal Region S/B 0.2 0.3 0.4 0.5 0.6 0.7 0.8 0.9 AUC Pythia Herwig Herwig+DCTR 1 0 3 1 0 2 1 0 1 Signal Region S/B 1 0 0 1 0 1 m a x S / B Pythia Herwig Herwig+DCTR 1 0 3 1 0 2 1 0 1 Signal Region S/B 0.0 0.2 0.4 0.6 0.8 B @ 5 0 % S Pythia Herwig Herwig+DCTR 1 0 3 1 0 2 1 0 1 Signal Region S/B 0 2 4 6 8 10 S / B @ 5 0 \ % S Pythia Herwig Herwig+DCTR Figure 8 . F our metrics for the sensitivity of the salad classifier as a function of the signal-to- bac kground ratio ( S/B ) in the signal region: the area under the curve (AUC) in the top left, the maxim um significance improv ement (top righ t), the false positive rate at a fixed 50% signal efficiency (b ottom left), and the significance improv ement at the same fixed 50% signal efficiency (b ottom righ t). The ev aluation of these metrics requires signal labels, even though the training of the classifiers themselv es do not hav e signal labels. Error bars corresp ond to the standard deviation from training fiv e differen t classifiers. Eac h classifier is itself the truncated mean o ver ten random initializations. 6 Bac kground Estimation The p erformance gains from Sec. 5 can b e combined with a sideband background estimation strategy , as long as threshold requirements on the classifier do not sculpt bumps in the m j j sp ectrum. Ho wev er, there is also an opp ortunity to use salad to directly estimate the background from the interpolated simulation. Figure 9 illustrates the efficacy of the – 12 – bac kground estimation for a single classifier trained in the absence of signal. Without the dctr reweigh ting, the predicted background rate is to o lo w by a factor of tw o or more b elo w 10% data efficiency . With the in terp olated rew eighting function, the bac kground prediction is accurate within a few p ercent down to ab out 1% data efficiency . 1 0 3 1 0 2 1 0 1 1 0 0 NN Threshold Efficiency 0.00 0.25 0.50 0.75 1.00 1.25 1.50 1.75 2.00 Prediction / Data Sim. (Herwig) Sim. + DCTR Figure 9 . The predicted efficiency normalized to the true data efficiency in the signal region for v arious threshold requirements on the NN. The x -axis is the data efficiency from the threshold. The error bars are due to statistical uncertain ties. In practice, the difficult y in using salad to directly estimate the background is the estimation of the residual bias. One ma y b e able to use v alidation regions b etw een the signal region and sideband region, but it will never require as m uc h interpolation as the signal region itself. One can rely on simulation v ariations and auxiliary measurements to estimate the systematic uncertaint y from the direct salad background estimation, but estimating high-dimensional uncertainties is challe nging [ 79 , 80 ]. With a low-dimensional reweigh ting or with a prop er high-dimensional systematic uncertaint y estimate, the parameterized reweigh ting used in salad should result in a lo wer uncertaint y than directly estimating the uncertain ty from simulation. In particular, an y nuisance parameters that affect the sideband region and the signal region in the same wa y will cancel when rew eighting and in terp olating. – 13 – 7 Conclusions This pap er has introduced Simulation A ssiste d Likeliho o d-fr e e A nomaly Dete ction ( salad ), a new approach to searc h for resonan t anomalies b y using parameterized reweigh ting functions for classification and bac kground estimation. The salad approach uses information from sim ulation in a w ay that is nearly background-model indep endent while remaining signal-mo del agnostic. The only requirement for the signal is that there is one feature where the signal is kno wn to b e lo calized. In the example presen ted in the pap er, this feature was the inv ariant mass of tw o jets. The lo cation of the resonance need not b e known ahead of time and can b e scanned using a series of signal and sideband regions. This scanning will result in a trials factor p er non-o verlapping signal region. An additional lo ok elsewhere effect is incurred by scanning the threshold on the neural netw ork. In practice, one could use a small num b er of widely separated thresholds to b e broadly sensitive. As long as the data used for training and testing are indep endent, there is no additional trials factor for the feature space used for classification. Strategies for maximally using the data for training can b e found in Ref. [ 40 , 41 ]. While the numerical salad results presented here did not fully achiev e the p erformance of a fully sup ervised classifier trained directly with inside knowledge ab out the data, there is ro om for improv ement. In particular, a detailed h yp erparameter scan could improv e the qualit y of the reweigh ting. A dditionally , calibration techniques could b e used to further increase the accuracy [ 56 ]. F uture work will inv estigate the p otential of salad to analyze higher-dimensional feature spaces as well as classifier features that are strongly correlated with the resonant feature. It will also be in teresting to compare salad with other recently prop osed mo del indep enden t metho ds. When the nominal bac kground simulation is an excellen t mo del of nature, salad should p erform similarly to the metho ds presen ted in Ref. [ 28 , 29 ] and pro vide a strong sensitivity to new particles. In other regimes where the bac kground simulation is biased, salad should con tin ue to provide a ph ysics-informed but still mostly background/signal mo del-indep endent approac h to extend the search program for new particles at the LHC and b ey ond. Co de and data a v ailability The co de can b e found at https://github.com/bnachman/DCTRHunting and the datasets are av ailable on Zendo as part of the LHC Olympics [ 62 ]. A ckno wledgmen ts BN would lik e to thank Jack Collins for coun tless discussions ab out anomaly detection, including ideas related to salad . Some of those discussions happ ened at the Asp en Cen ter for Physics, which is supp orted b y National Science F oundation grant PHY-1607611. This w ork w as supp orted by the U.S. Departmen t of Energy , Office of Science under con tract DE-A C02-05CH11231. DS is supp orted b y DOE grant DOE-SC0010008. DS thanks LBNL, – 14 – BCTP and BCCP for their generous sup p ort and hospitality during his sabbatical y ear. BN w ould like to thank NVIDIA for providing V olta GPUs for neural netw ork training. References [1] A TLAS Collab oration, Exotic Physics Se ar ches , 2019. https://twiki.cern.ch/twiki/bin/view/AtlasPublic/ExoticsPublicResults . [2] A TLAS Collab oration, Sup ersymmetry se ar ches , 2019. https://twiki.cern.ch/twiki/bin/view/AtlasPublic/SupersymmetryPublicResults . [3] A TLAS Collab oration, Higgs and Dib oson Se ar ches , 2019. https://twiki.cern.ch/twiki/bin/view/AtlasPublic/HDBSPublicResults . [4] CMS Collab oration, CMS Exotic a Public Physics R esults , 2019. https://twiki.cern.ch/twiki/bin/view/CMSPublic/PhysicsResultsEXO . [5] CMS Collab oration, CMS Sup ersymmetry Physics R esults , 2019. https://twiki.cern.ch/twiki/bin/view/CMSPublic/PhysicsResultsSUS . [6] CMS Collab oration, CMS Beyond-two-gener ations (B2G) Public Physics R esults , 2019. https://twiki.cern.ch/twiki/bin/view/CMSPublic/PhysicsResultsB2G . [7] LHCb Collab oration, Public ations of the QCD, Ele ctr owe ak and Exotic a W orking Gr oup , 2019. http://lhcbproject.web.cern.ch/lhcbproject/Publications/LHCbProjectPublic/ Summary_QEE.html . [8] J. H. Kim, K. Kong, B. Nac hman, and D. Whiteson, The motivation and status of two-b o dy r esonanc e de c ays after the LHC Run 2 and b eyond , . [9] N. Craig, P . Draper, K. K ong, Y. Ng, and D. Whiteson, The unexplor e d landsc ap e of two-b o dy r esonanc es , A cta Phys. Polon. B50 (2019) 837, []. [10] A. J. Lark oski, I. Moult, and B. Nac hman, Jet Substructur e at the L ar ge Hadr on Col lider: A R eview of R e c ent A dvanc es in The ory and Machine L e arning , Phys. R ep orts (2019) []. [11] D. Guest, K. Cranmer, and D. Whiteson, De ep L e arning and its A pplic ation to LHC Physics , A nn. R ev. Nucl. Part. Sci. 68 (2018) 161, []. [12] M. Abdughani, J. Ren, L. W u, J. M. Y ang, and J. Zhao, Sup ervise d de ep le arning in high ener gy phenomenolo gy: a mini r eview , Commun. The or. Phys. 71 (2019) 955, []. [13] A. Radovic, M. Williams, D. Rousseau, M. Kagan, D. Bonacorsi, A. Himmel, A. A urisano, K. T erao, and T. W ong jirad, Machine le arning at the ener gy and intensity fr ontiers of p article physics , Natur e 560 (2018) 41. [14] B. Knuteson. Ph.D. thesis, Univ ersit y of California at Berk eley (2000). [15] D0 Collab oration, B. Abb ott et al., Se ar ch for new physics in eµX data at DØ using Sherlo ck: A quasi mo del indep endent se ar ch str ate gy for new physics , Phys. R ev. D62 (2000) 092004, [ hep-ex/0006011 ]. [16] D0 Collab oration, V. M. Abazov et al., A Quasi mo del indep endent se ar ch for new physics at lar ge tr ansverse momentum , Phys. R ev. D64 (2001) 012004, [ hep-ex/0011067 ]. – 15 – [17] D0 Collab oration, B. Abb ott et al., A quasi-mo del-indep endent se ar ch for new high p T physics at DØ , Phys. R ev. L ett. 86 (2001) 3712–3717, [ hep-ex/0011071 ]. [18] H1 Collab oration, F. D. Aaron et al., A Gener al Se ar ch for New Phenomena at HERA , Phys. L ett. B674 (2009) 257–268, []. [19] H1 Collab oration, A. Aktas et al., A Gener al se ar ch for new phenomena in ep sc attering at HERA , Phys. L ett. B602 (2004) 14–30, [ hep-ex/0408044 ]. [20] CDF Collab oration, T. Aaltonen et al., Mo del-Indep endent and Quasi-Mo del-Indep endent Se ar ch for New Physics at CDF , Phys. R ev. D78 (2008) 012002, []. [21] CDF Collab oration, T. Aaltonen et al., Mo del-Indep endent Glob al Se ar ch for New High-p(T) Physics at CDF , . [22] CDF Collab oration, T. Aaltonen et al., Glob al Se ar ch for New Physics with 2.0 fb − 1 at CDF , Phys. R ev. D79 (2009) 011101, []. [23] CMS Collab oration, MUSiC, a Mo del Unsp e cific Se ar ch for New Physics, in pp Col lisions at √ s = 8 T e V , CMS-P AS-EX O-14-016 (2017). [24] CMS Collab oration, Mo del Unsp e cific Se ar ch for New Physics in pp Col lisions at √ s = 7 T e V , CMS-P AS-EXO-10-021 (2011). [25] A TLAS Collaboration, M. Aaboud et al., A str ate gy for a gener al se ar ch for new phenomena using data-derive d signal r e gions and its applic ation within the A TLAS exp eriment , Eur. Phys. J. C79 (2019) 120, []. [26] A TLAS Collaboration, A gener al se ar ch for new phenomena with the A TLAS dete ctor in pp c ol lisions at √ s = 8 T e V , A TLAS-CONF-2014-006 (2014). [27] A TLAS Collaboration, A gener al se ar ch for new phenomena with the A TLAS dete ctor in pp c ol lisions at √ s = 7 T e V , A TLAS-CONF-2012-107 (2012). [28] R. T. D’Agnolo and A. W ulzer, L e arning New Physics fr om a Machine , Phys. R ev. D99 (2019) 015014, []. [29] R. T. D’Agnolo, G. Grosso, M. Pierini, A. W ulzer, and M. Zanetti, L e arning Multivariate New Physics , . [30] A. De Simone and T. Jacques, Guiding New Physics Se ar ches with Unsup ervise d L e arning , Eur. Phys. J. C79 (2019) 289, []. [31] A. Mullin, H. Pacey , M. Park er, M. White, and S. Williams, Do es SUSY have friends? A new appr o ach for LHC event analysis , . [32] G. M. Alessandro Casa, Nonp ar ametric semisup ervise d classific ation for signal dete ction in high ener gy physics , . [33] M. F arina, Y. Nakai, and D. Shih, Se ar ching for New Physics with De ep A uto enc o ders , arXiv:1808.08992 . [34] T. Heimel, G. Kasieczka, T. Plehn, and J. M. Thompson, QCD or What? , SciPost Phys. 6 (2019) 030, []. [35] T. S. Ro y and A. H. Vijay , A r obust anomaly finder b ase d on auto enc o der , . – 16 – [36] O. Cerri, T. Q. Nguyen, M. Pierini, M. Spiropulu, and J.-R. Vlimant, V ariational A uto enc o ders for New Physics Mining at the L ar ge Hadr on Col lider , JHEP 05 (2019) 036, []. [37] A. Blance, M. Spannowsky , and P . W aite, A dversarial ly-tr aine d auto enc o ders for r obust unsup ervise d new physics se ar ches , JHEP 10 (2019) 047, []. [38] J. Ha jer, Y.-Y. Li, T. Liu, and H. W ang, Novelty Dete ction Me ets Col lider Physics , arXiv:1807.10261 . [39] B. M. Dillon, D. A. F aroughy , and J. F. Kamenik, Unc overing latent jet substructur e , Phys. R ev. D100 (2019) 056002, []. [40] J. H. Collins, K. How e, and B. Nachman, A nomaly Dete ction for R esonant New Physics with Machine L e arning , Phys. R ev. L ett. 121 (2018) 241803, []. [41] J. H. Collins, K. Ho w e, and B. Nachman, Extending the se ar ch for new r esonanc es with machine le arning , Phys. R ev. D99 (2019) 014038, []. [42] B. Nachman and D. Shih, A nomaly Dete ction with Density Estimation , arXiv:2001.nnnnn . [43] J. A. Aguilar-Saa vedra, J. H. Collins, and R. K. Mishra, A generic anti-QCD jet tagger , JHEP 11 (2017) 163, []. [44] G. Loupp e, M. Kagan, and K. Cranmer, L e arning to Pivot with A dversarial Networks , arXiv:1611.01046 . [45] J. Dolen, P . Harris, S. Marzani, S. Rapp o ccio, and N. T ran, Thinking outside the ROCs: Designing De c orr elate d T aggers (DDT) for jet substructur e , JHEP 05 (2016) 156, []. [46] I. Moult, B. Nachman, and D. Neill, Convolve d Substructur e: A nalytic al ly De c orr elating Jet Substructur e Observables , JHEP 05 (2018) 002, []. [47] J. Stevens and M. Williams, uBo ost: A b o osting metho d for pr o ducing uniform sele ction efficiencies fr om multivariate classifiers , JINST 8 (2013) P12013, []. [48] C. Shimmin, P . Sado wski, P . Baldi, E. W eik, D. Whiteson, E. Goul, and A. Søgaard, De c orr elat e d Jet Substructur e T agging using A dversarial Neur al Networks , Phys. R ev. D96 (2017) 074034, []. [49] L. Bradshaw, R. K. Mishra, A. Mitridate, and B. Ostdiek, Mass A gnostic Jet T aggers , arXiv:1908.08959 . [50] A TLAS Collaboration, Performanc e of mass-de c orr elate d jet substructur e observables for hadr onic two-b o dy de c ay tagging in A TLAS , A TL-PHYS-PUB-2018-014 (2018). [51] L.-G. Xia, QBDT, a new b o osting de cision tr e e metho d with systematic al unc ertainties into tr aining for High Ener gy Physics , Nucl. Instrum. Meth. A930 (2019) 15–26, [ ]. [52] C. Englert, P . Galler, P . Harris, and M. Spannowsky , Machine L e arning Unc ertainties with A dversarial Neur al Networks , Eur. Phys. J. C79 (2019), no. 1 4, []. [53] S. W unsch, S. Jórger, R. W olf, and G. Quast, R e ducing the dep endenc e of the neur al network function to systematic unc ertainties in the input sp ac e , . – 17 – [54] G. Kasieczka and D. Shih, DisCo F ever: R obust Networks Thr ough Distanc e Corr elation , arXiv:2001.nnnnn . [55] A. Andreassen and B. Nachman, Neur al Networks for F ul l Phase-sp ac e R eweighting and Par ameter T uning , . [56] K. Cranmer, J. Pa vez, and G. Louppe, A ppr oximating Likeliho o d R atios with Calibr ate d Discriminative Classifiers , . [57] P . Baldi, K. Cranmer, T. F aucett, P . Sadowski, and D. Whiteson, Par ameterize d neur al networks for high-ener gy physics , Eur. Phys. J. C76 (2016), no. 5 235, []. [58] J. Brehmer, G. Loupp e, J. P av ez, and K. Cranmer, Mining gold fr om implicit mo dels to impr ove likeliho o d-fr e e infer enc e , . [59] J. Brehmer, K. Cranmer, G. Loupp e, and J. P av ez, A Guide to Constr aining Effe ctive Field The ories with Machine L e arning , Phys. R ev. D98 (2018) 052004, []. [60] J. Brehmer, K. Cranmer, G. Loupp e, and J. P av ez, Constr aining Effe ctive Field The ories with Machine L e arning , Phys. R ev. L ett. 121 (2018) 111801, []. [61] A. Andreassen, P . T. Komisk e, E. M. Meto diev, B. Nac hman, and J. Thaler, OmniF old: A Metho d to Simultane ously Unfold Al l Observables , . [62] G. Kasieczka, B. Nachman, and D. Shih, R&D Dataset for LHC Olympics 2020 A nomaly Dete ction Chal lenge , Apr., 2019. https://doi.org/10.5281/zenodo.2629073. [63] T. Sjöstrand, S. Mrenna, and P . Z. Skands, PYTHIA 6.4 Physics and Manual , JHEP 05 (2006) 026, [ hep-ph/0603175 ]. [64] T. Sjöstrand, S. Mrenna, and P . Z. Skands, A Brief Intr o duction to PYTHIA 8.1 , Comput. Phys. Commun. 178 (2008) 852, []. [65] M. Bahr et al., Herwig++ Physics and Manual , Eur. Phys. J. C58 (2008) 639–707, []. [66] DELPHES 3 Collab oration, J. de F av ereau, C. Delaere, P . Demin, A. Giammanco, V. Lemaitre, A. Mertens, and M. Selv aggi, DELPHES 3, A mo dular fr amework for fast simulation of a generic c ol lider exp eriment , JHEP 02 (2014) 057, []. [67] A. Mertens, New fe atur es in Delphes 3 , J. Phys. Conf. Ser. 608 (2015) 012045. [68] M. Selv aggi, DELPHES 3: A mo dular fr amework for fast-simulation of generic c ol lider exp eriments , J. Phys. Conf. Ser. 523 (2014) 012033. [69] M. Cacciari, G. P . Salam, and G. Soy ez, F astJet U ser Manual , Eur. Phys. J. C72 (2012) 1896, []. [70] M. Cacciari and G. P . Salam, Disp el ling the N 3 myth for t he k t jet-finder , Phys. L ett. B641 (2006) 57, [ hep-ph/0512210 ]. [71] M. Cacciari, G. P . Salam, and G. Soy ez, The anti- k t jet clustering al gorithm , JHEP 04 (2008) 063, []. [72] P . T. K omiske, E. M. Metodiev, and J. Thaler, Ener gy Flow Networks: De ep Sets for Particle Jets , JHEP 01 (2019) 121, []. – 18 – [73] J. Thaler and K. V an Tilburg, Maximizing Bo oste d T op Identific ation by Minimizing N-subjettiness , JHEP 02 (2012) 093, []. [74] J. Thaler and K. V an Tilburg, Identifying Bo oste d Obje cts with N-subjettiness , JHEP 03 (2011) 015, []. [75] F. Chollet, “Keras. ” https://github.com/fchollet/keras , 2017. [76] M. Abadi, P . Barham, J. Chen, Z. Chen, A. Da vis, J. Dean, M. Devin, S. Ghemaw at, G. Irving, M. Isard, et al., T ensorflow: A system for lar ge-sc ale machine le arning. , in OSDI , vol. 16, p. 265, 2016. [77] D. Kingma and J. Ba, A dam: A metho d for sto chastic optimization , . [78] J. Neyman and E. S. P earson, On the pr oblem of the most efficient tests of statistic al hyp otheses , Phil. T r ans. R. So c. L ond. A 231 (1933) 289. [79] B. Nachman, A guide for deploying De ep L e arning in LHC se ar ches: How to achieve optimality and ac c ount for unc ertainty , . [80] B. Nachman and C. Shimmin, AI Safety for High Ener gy Physics , . – 19 –
Original Paper
Loading high-quality paper...
Comments & Academic Discussion
Loading comments...
Leave a Comment