New insights for setting up contractual options for demand side flexibility
This paper exploits the Duration-of-Use of the demand patterns as a key concept for dealing with demand side flexibility. Starting from the consideration that fine-grained energy metering is not used at the point of supply of the electricity consumer…
Authors: Gianfranco Chicco, Andrea Mazza
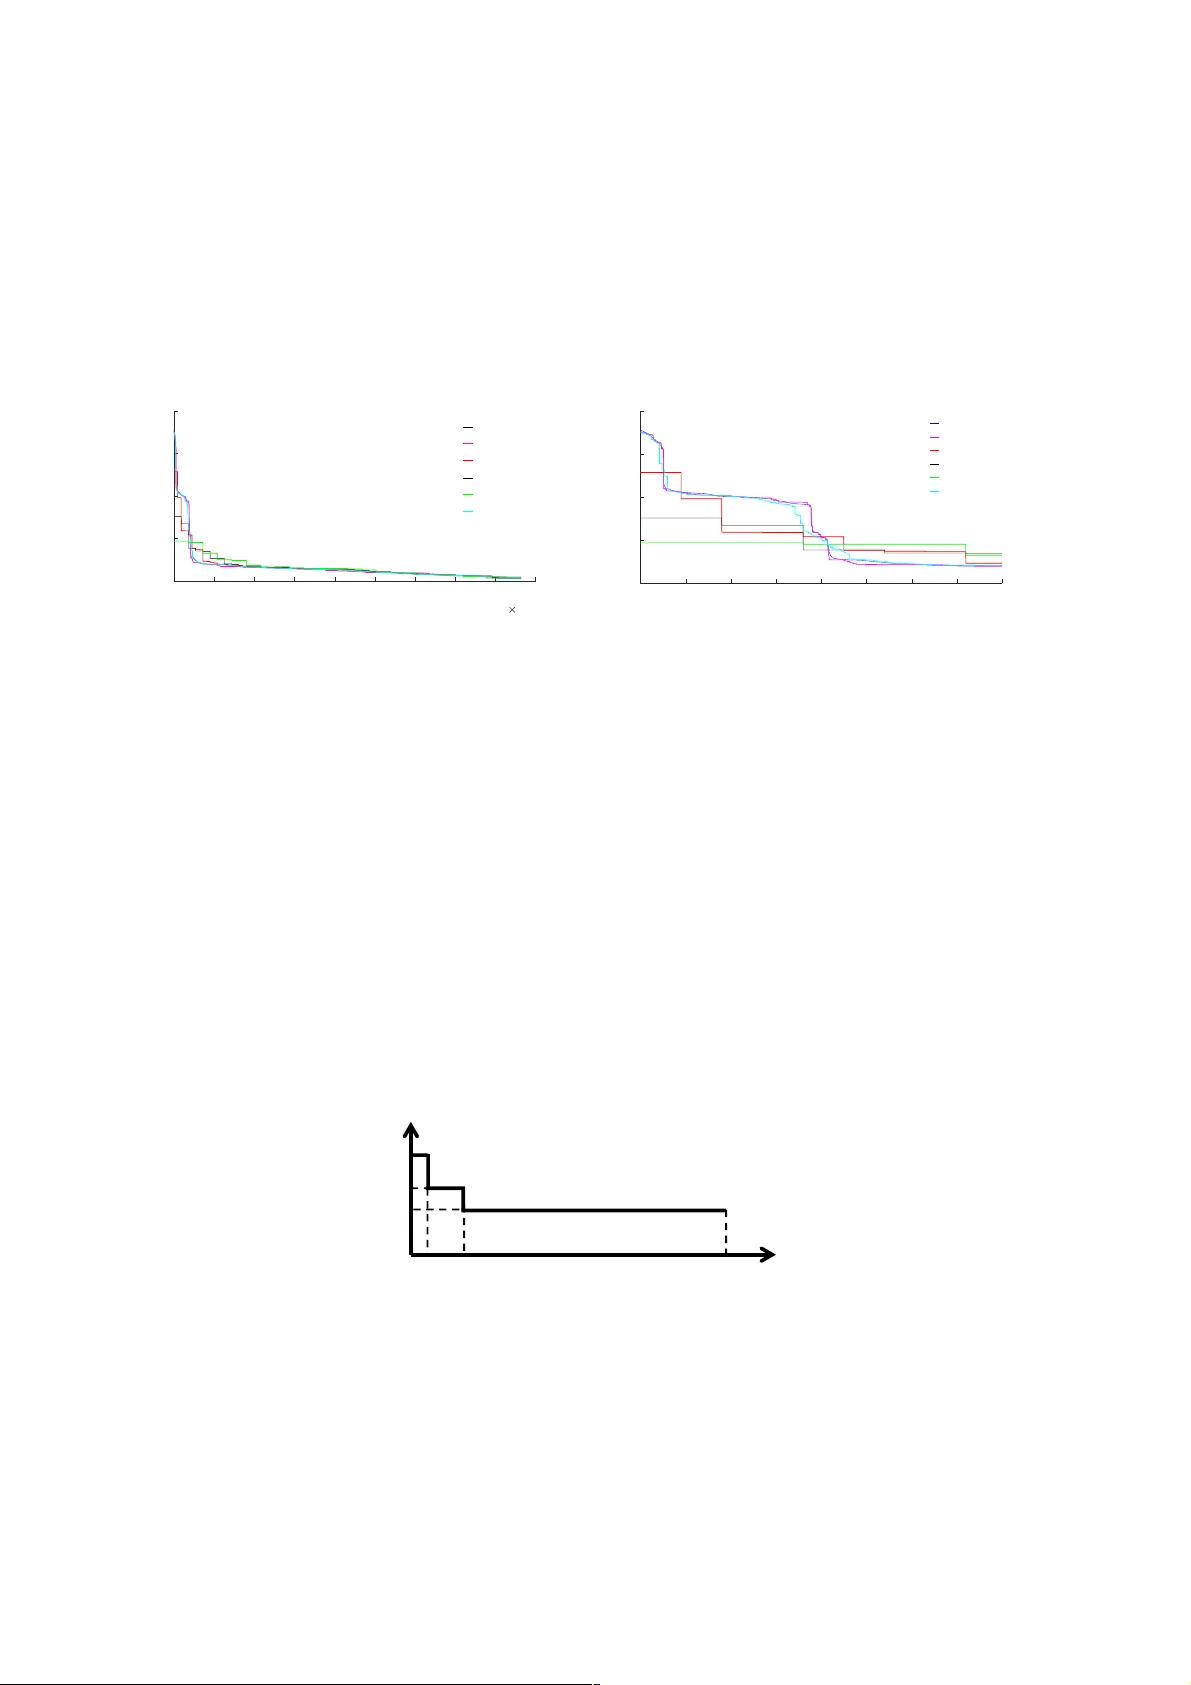
! New$insi gh ts$for$setting$up$ contr act u al$options$ for $ dem and$side$ flex ibili ty$ $ Gianfr anco Chicco, Andrea Maz za Polit ecnic o di Torin o , Dipartimento Energia “Ga lileo F err aris” Corso Duca degli Abruz zi 24, 10129 Torino, Italy gianfra nco.chicc o@polito.it , andre a.mazza @polito.it Abstract This paper exploits the Duration-of- Use of the demand patterns as a key concept for dealing with demand side flexibi lity. Star ting fr om the cons idera tion tha t fine -gra ined ene rgy mete ring is not used a t the point of supply of the electricity consumers , i.e., the granular ity of t he ener gy measure d (at time steps of 15 minutes, 30 minutes or one hour), the event-ba sed energy m eter ing (ED M) is i ndicated as a viable option to provides a very detailed reconstruction of t he demand patterns. The use of EDM enables high-quality tracking of the demand peaks with a reduced number of data with respe ct t o the ones needed t o measure ene rgy at regular time steps for rea ching a similar peak tracking capabil ity. Fr om the EDM outcome s, a new class of opti ons for setting up tariffs or contrac ts for flexibility, based o n the demand dura tion curve, is envisioned. 1. Introduction After the restructuring of the electr icity business, with the beginning of the competi tive electricity markets and the unbun dling of the gener ation, transmission , distributi on and retail services, the regulation has changed. Grid codes have been establ ished for the networks, and perfor mance -base d rate making (PB R) [1] has been applied in differe nt contexts. With PBR (also called performanc e-based regulation [2 ]), cost reduc tions and increased efficiency in the energy management may lead to better profits for the electric companies. P BR is the alte rnative to the traditional c ost-of-se rvice (CoS) based regulation, and the profit s are obtained from meeting t he objectives for delivering a reliable, affordable and clea n power and energy syst em . To avoid potenti al cost reduc tions tha t can affe ct the quality of service, quality control is indeed neede d by the action of t he regulator s [3]. According with [4], a well -designed scheme for PBR could “drive important societal outcomes, as wel l as create new business opportunities for innova tive utilities and third- party players”. In the U.S., m any utilities are l ooking for a change towards PBR. In the Uti lity Dive’s 2018 State of the Electric Utility survey [5], based on an onl ine quest i onnaire sent to Utility Di ve reader s i n Dec ember 2017, only 8% of utility respondents indic ated to want C oS regulation, while 44% indica t ed pref erence for a hybrid model that mix es t raditional CoS with PBR, and 32% are favoura bl e to a model wi th predominant PBR. In Europe, in the last t wo decade s the quality of supply has been subject to new types of limits, defined i n terms of non- exce eding probabilit ies on relevant quantities for given time periods , rather than using a simple threshold for these quantit ies . An example is the quality of supply , with the regulation establ i shed by the Europea n Standard EN 50160. In this S tandard, for harmonic voltage s i t is established that in norma l opera ting conditions, during each period of the week, 95% of the RMS voltage values average d in 10 minutes for eac h individual ha rmonic voltage have to be l ower or equal to the va l ue indicated in the corr esponding table in the Standard. To assess the releva nt quantities, fine -grained monitoring is needed. Each quantity is calc ulated for a base interval of 200 ms, then t he results are first aggrega ted over very short- term int erva l s (3 seconds) by calculating t he Euc l ide an avera ge of the quantity f or 15 successive base intervals. A s ucce ss ive aggregation over short-term inter vals (10 minutes) is determined by calcula t ing the Euclidean average of the quantity for 200 succe ssive very short-term intervals. Finally, aggrega ti on over long-term intervals (2 hours) is obtaine d from the Eucl idean average of t he quantity for 12 successive short- term intervals. The approach based on per cent values indicated above has not been applied yet for ener gy manageme nt purposes, m ainly beca us e of lack of detailed representation of the demand patterns. The traditional ener gy metering provides results for tim e steps of 15 minutes, 30 minutes or one hour. However, as discusse d in Section 4.2, these time s teps are too l ong to provide useful information for flexibility purposes . Using smart meters that gather data regularly at shorter t ime steps fr om several energy meters imposes a high burden on the communication channels. In addition , the us e of c onst ant time s teps i s inefficie nt to ide nt ify t he actual peaks and ramps appearing in the demand patterns . Thi s has also a remarka ble effe ct on the data available to ass ess the operation of the low voltage (LV) grid, and in the determination of quantities relevant to the grid eff iciency (e .g., the network losse s , which depend on t he ac tual power flows in a non-linear way, and ma y be incorre ctly assessed if the power is not determined pr operly) . I n [6] i t is indicated that “ the fact that the LV grid cannot provide sufficient data today, will have also a negative impac t on the f u ture LV gri d investment strategy ”, and also that lack of s ufficie nt dat a to enable acc eptable grid observability does not only hinde r grid monitoring, but also the objective of obtaining an aff ordable ener gy syst em . The rec ent m anufa cturing of an event-driven energy meter [7 ] based on the gen eration of events linked t o the char acte ristics of t he demand patterns is opening new paths to the definitio n of innovative types of tariff options, based on the conce pt of Duration-of- Us e. In this way, flexibility can be associated to changes occurr i ng in the duration curve drawn from the demand patte rn. This paper discusses the possi bilit y of enhancing flexibilit y on the demand side th rough the provision of data t hat bet ter reflect t he characte ristic of the demand patterns. In particular, the use of a new type of m eter, based on measuring energy demand between events generated in asynchr onous mode, is shown to be very promising t o reconstruc t demand pat tern s with much better precision than in t he tradition al in terva l metering . Specific advantages related to the use of EDM are discussed in the identification of the demand peak and in the possible reduction of t he d at a collected by the meter . Further positive aspects of the better knowledge of the demand pa t terns are the possibility to estim at e the technical losses occurring in the supply grid , espec ially when the demand has large variations, as it ha ppens in the last mile of the elec tricity distribution. The next sections of this paper are organised as follows. Section 2 illust ra t es the evolution of the conce pt s ref erring to demand side response and demand si de flexibility . Section 3 recalls the chara cteristics of event- driven energy metering . S ection 4 focuses on how the EDM outco m es provide new insights for flexibility assessment, and contains a worked examp le that uses the demand pattern of an individual consumer, whose results prelude t o the il lustra t ion of t he propo sed Duration-of -Use scheme for electricity pricing in Section 5 . The last section contains the conclus ions. 2. Demand side respo nse an d dem and si de flexibility The evoluti on of rulemaking has considered for many years demand s ide response (DSR). More rece nt ly, the terminology has been shifted to demand side flexi bil ity (D SF), even though s ome of the main concepts indicated in the regulatory documents still refer to DSR. However, flexibilit y means more than DS R. The Council of European Energy Regulators ( CE ER ) in t he Conclusion paper [8 ] indicates that “ Flexibility is th e capacity of the electricity system to respond to changes that may affec t the balance of suppl y and demand at all times ” . The Europea n Smart Grids Task Force Expert Group 3 [6 ] defines flexibili ty as “ the ability of a customer (Prosumer) t o deviate f rom its nor mal electri city consumption (production) prof ile, i n response to price signals or marke t ince ntives ”. The conce pt of fl exibil i ty , applied to the demand side , may be compa red with the s ame conce pt seen at the gener ation si de and, on this ba sis, a common under st anding should be conside red. As reported in [9], flexibility i s first of all “responsiveness” , t hat i s not onl y energy or power (ca pacity), but requir es t he ir provision with a well-defined shape. This is exac t ly what is us ed for t he supply side: the flexibility of the traditional genera tors indi cate s the ca pability of them to “ramp up” or “ra m p down” to reac h the desired opera tion condition. An example of normalized flexibility index refe rring to the supply si de incor porating information on ramp rates for supply side is reported in [10 ]. Howeve r, due to the fact that the demand flexibility i nvolv es c onsumers, a non-negligible aspect is how m any of t hem would like to participate at the progra m, because making unrealistic assumptions about their engageme nt can compromise its eff ectivene ss [11 ]. Further m ore, smart me t ers wi th appropriat e charac t eris tics are ne eded to allow be tt er deployment of DSF options, as also confirmed by [12], st at i ng t hat “ Smart Meters are a fundamental enabling f actor for DSF, however some of the current generation of smart meters may not be adequate to deliver all services required for DSF and standardisa tion across Europe re mains an is sue ”. In [8] this concept is reinforc ed by the results of a survey conducted by CEER about the possibility of incentivising consume rs to us e t he network in the m ost effi cien t way. From t hese results, most of the re spondents considered that network tariffs cannot have sufficient granularity to send price signals corresponding to the exac t local flexibility need. Moreover , i n [8 ] the main constra ints indicated to the prac t ical fea sibilit y of a rea l-ti me market are lack of li qu idity and lack of technical tools ( smart -meter i ng, hourly measurement, real time monitoring ). In this respe ct, advanced m etering may enable the defin ition of more refined tariff s tructure s and opt ions. Sm art Metering, Regulatory Framewor k for Tariff Structures and Cont rac tual Arra ngements are considered as th e most eff ective means for achieving flexibility use at di stributi on level . In [6 ] there is an explicit rec ommendation to the Europea n Union to cre ate a smart meter roadmap, in which smart meters should be able to meet the require ments of future markets (e.g., high-resolut i on time intervals), providing a m o dular and flexible architecture for the metering infrastruc ture. Further more, it is i ndicated that some chara cteristics (such as the minimu m size of the product , or the te m poral granula rity) should be identified to allow the contribution of all resource s to t he provision of the needed servic es. The demand shifting i ntroduced by DSF has an impa ct on multiple aspec t s: • Reduction of the demand pea ks, with the benef it of red ucing the need for running expensive “pe aking” gener ation to cover t he peaks. P eak reduction also helps in reduc ing grid losses and congestion in the grid in time periods w i th high power flows. • Reduction of the curta ilment of inter m ittent gener ation (e . g., from wind and photovol taic plants) , • Postponing investments on new network assets by red ucing the peak net demand (i.e., local demand minus local generation, also taking into account the c harge or di schar ge of local stora ge units) seen from the point of conne ction with the grid. • Incr easing the system efficienc y, also by making i t po ssible the operation of the equipme nt at highe r eff iciency, also leading to environ mental benefits . • Incr easing reliabilit y, avoiding the need for inst alling gene ration capacity that could be used rarely, or avoiding load shedding or load curta ilment. In addition, DSF may provide reserve capacity to the syst em, available at differe nt time s cales aft er reque st, thus reducing the need for procuring part of t he reser ves from traditional genera t ion. The t ime sca les at which DSF may oper ate are in general even fast er than the one refer ring to conventional generation, making DSF highly valuable. The pos ition paper [13] considers t he principles to ensure tha t consumers are able to offe r their flexibility, indicating that consume rs “ should at least have the choice to be metere d and settled at the same time resolu tion as the imbalanc e period in na ti onal markets when it is technically possible ”. Following the literature regarding DSR, the consu mer s could offer their flexibility accor ding to price- based or incentive-base d schemes [11 ]. B y comparing t he definitions reported in technica l documents, the flexibility that can be obtained from price- based scheme is known as implicit flex ibility , whereas t he one obtained through ince ntive-base d schemes is called ex plicit flexibility [14 ]. With im plic it flexibility , t he flexibility is delivere d according to the sensitivity of the custo m er to the price signal for ti me -of-use tariffs (ToU), critical peak pricing (CPP) , peak time rebates (PTR), or real t ime pricing (RTP ) . ToU t ari ffs are s e t in advance (e.g., every year), with t ime periods subjec t t o the same price that can change during the year, e.g ., seasonally . CPP is a version in which higher prices are defined (again, in advance, in gener al at lea s t a few hours before the expected critical event) for specific time periods in wh ich the network l oading may become high and t hus crit ica l. In [15] i t is indicated that implicit flexibility from ToU or CPP does not ref lect the actual conditio ns. In PTR, the consumer s rec eive reductions in their elec t ri ci ty bill during peak periods established a priori, if they reduce their consumption with respect to a given baseline . Howeve r, the definition of the base line m ay be critical, beca use of possible st ra te gic behaviour of the consumers (see below) . R TP refe rs to t he operation i n nor m al conditions , where the price change s during t ime wi th a short notice (e.g., a few hours) throughout the year . However , the di ffusion of RTP as a dynamic pricing option is somehow l imited at t he m oment , as various consumers (e.g., resident ial and small enter prises) have no acc ess t o these t ari ffs [16 ] . Conversely, with explicit flexib i lity, the flexib i lity i s committed by pa rti cipating in i ncentive- based progra mmes that rely upon direct l oad control, inte rruptible or curtailable rates, emergency demand response, capac ity market, and ancillary service mar kets. These pr ogrammes may be manage d by the supplier or by another entit y (e.g., an aggr egator) . The incentive- based fra m ewor k may be m ore eff ective if i t provides benef it s to the incentive manager that part icip a tes in energy markets, capac i ty markets, of balancing market s. In the impact ass ess men t results shown in [16], commerc i al and industrial consu mers are considere d to be likely to participate in incentive -based DSR only through aggre gators, while the participation of retail consumers is no t expected. The s mart metering system has the objective to ensure that appropriate functionalities and interopera bi lity are available to t he consumers. Wit h the availabi l ity of new genera tions of smart meters, t here will be room for defining a wider range of DSF offers, facilitating hi gher competition in t he provision of smart energy service s . For smart meter deployme nt, the net benefit has to be assessed as the estimated savings in gener ation and network capac it y minus the costs of meter s and activation [16]. The consumer (or prosumer) may decide t o deliver flexibility in a vo luntary way , unless a contra ctual arr angeme nt has been established (in this case the provision of flexib i lity becomes mandatory de facto ; this arr angeme nt is typical of incentive-ba sed schemes ). In [6 ] it is pointed out t hat the participation of the demand side in providing diffe rent services coul d be enhance d by allowing v alue stacking , that is, t he possibility of offering di ffe rent services at the same tim e. Of course, this possi bili t y require s clear determination of the allocation of the DSF provide d to the differe nt services. One of the main aspec ts to be considere d for understan di ng the impact of the demand side on t he system is the cre ation of demand baseline . Its appropriate calc ul ation is fundamental for eva luating the impact of the demand flexibility in the system. As shown in [17], the methodologies for defining the baselines for DSR can be based on appropr iate functions. For example, t he initial baseline is calculated as the average demand among the X hig hest ene rgy usage days out of the prior Y non-event days (thi s mode is indica t ed as HighXofY [18]; alternative m odes are LowXofY or MidXofY ), or with exponential m oving avera ge or regr ession [19]. Another possi bility is the use of a control group, which has to be as si milar as possible to the remaining population , t o well represe nt t he behaviour of t he population. Then, the adjusted baseline is the adapta tion of an init ial baseline t o the actual l oad pattern occurring before starting the DSR action. S pecific rules have to be followed to determine the adjusted bas eline. For example, an adjustment factor is calculate d as t he di ffe rence between the observed demand and t he init ial baseline for a calibration period starting two hours before the event notification, with a minimum a djustment of zer o, and is t hen applied to modify the initial baseline t o get the refe rence baseline for DS R. The starting time of the calibration period cannot be too early, in order to avoid strategic behaviour of the consumers to artificially create fa vourable conditions in the determination of t he baseline, leading to economic advanta ges i n the determinat i on of the rewa rd af ter a DSR event [20 ]. A well -established way to define baselines for flexibility is still needed. In [6 ], there is a rec ommendation to categor i se the best prac tices that can be i dentified for baseline design and validation, possibly refe rring to t he specific flexibility resourc es. Metering equipment are als o require d to be able to verify that the load variation is ac hi eved [16]. 3 . Eve nt-driven energy mete rin g Event-drive n energy metering (EDM), also called event-based ener gy m etering, is t he acquisition of ener gy data from measurements gathered at non-regular ti me steps, triggere d by the occurre nce of an event. EDM introduces a differ ent para di gm with respec t to the classical ti mer-ba sed metering or timer-drive n metering (TDM, also called i nterval metering ), in whi ch energy data are taken from measureme nt s gathered at regular time steps. The EDM principles have been presented in a num ber of rece nt publications, among whic h [7][21] -[24 ]. The main chara cteristics are summarised below. EDM considers an elementary time interval t as t he shortest duration of time of int ere s t for the repr esentation of the demand pattern. An example used in many of t he publ ications indica ted above is t = 1 s. The elementary time interval is not l inked to t he int erna l char acte ristics of the meter, in whic h data sampling may occur at much faster samp ling rates. The elementary time int erva l in genera l should not be t oo low, to avoid the e ffe cts of ver y fast variations tha t occur in the e nergy demand proc ess but can be considere d as poorly releva nt for the energy- based repre sentation of the demand pattern. Inside the elementa ry time int erva l, the demand pattern is represe nt ed by using the avera ge power obtained by divi d ing the energy measure d in t he elementary time and the duration of the elementary time itself. Faster demand dynamics are then inte ntionally fil tered out in this representation. EDM is based on a target evolution in time of the dema nd pattern, and genera t es an event eac h time one of the following condi tions occur s: a) change- of-value : the change of the avera ge power with respect t o the previous elementar y time interval is higher than a user-de fined threshold d 1 ; or, b) accum ulated energy variation : the variations of t he avera ge power occurring at successive elementa ry time int erva ls are accumulated during time; the event is generated when the sum of these variations exce eds a user-de fined t hreshold d 2 . While the ra ti onale of the change-of- value is quite intui tive, and ha s been use d in the m echa ni sms denoted as cha nge-a nd-transmit in [25], the acc umul ated ener gy variation has been i ntroduced in [21] to encompa ss case s in which t he deviation with respect to the tar get may occur from progre s sive (even individually small) variations that move t he pattern awa y from the t arge t . Indeed, t he combined use of the thresholds d 1 and d 2 is the major rea son of succ ess of EDM. The target is modified after the occurre nc e of each event, to take into ac count the possible occur renc e of a new process with dif fer ent chara cteristics. The t hresh olds d 1 and d 2 are imposed in the EDM, and may be adapte d during t ime to provide differe nt views on the dema nd process. The detection of an event is followed by t he generation of the corre s ponding time st amp informat ion and the recor di ng of the energy measured between the previous event and the new one. If t he pattern follows the expec t ed trend during ti me, no data recording is needed. In case of a failure, the pattern exhibits a change that is detected as an event. Consistency with fiscal mete ring is obt ained by defining the end of the billing period as an event. 4 . EDM provides new insights for flexi b ility assess ment 4.1. Basic aspects The EDM outcomes provide high-valued k nowledge of the proce sses that chara cter ise the energy usage. A major advantage of EDM is t he possibility of rec onstructing the demand pattern with high detail starting from the infor mation pr ovided from a few e vents. In f act, the dema nd pattern be tween two events is repr esented by a constant ave rage power. Thi s representa tion filters out the small demand variations occur ring between the two events, but keeps the exact information on the actua l ener gy used. In this way, EDM ena bles high-qual it y tracking of t he demand pea ks with a reduced number of data with respect to the ones nee ded t o measure energy at r egular ti me steps for reaching a simil ar peak trac king capa bility. In particular , the i dentification of a peak detected i n a single elementary ti me int erva l would be possible with TDM only by reducing the TDM time step to the eleme ntary ti me interval. The effe ctiveness of the demand pattern reconstruction from TDM or EDM may be quantified by using appropriate metrics [26 ]. From these metr ics, i n typical app l ications to energy systems the better effec ti veness of the demand patter n rec onstruction from EDM is quite evident .! Furthe rmore, EDM provides i nformation close to re al ti me , including the possi b ility of obta ining an estimate of the expected demand if no new event occurs, providing some anticipatory knowledge with known uncerta inty. In fact, in the absence of new events, at each elementa ry time interva l the demand changes within the l imits set by the threshold d 1 . These aspect s are also fully relevant to enha nce the role of metering in applica tions targeted at the ne eds of Industry 4.0 [27 ]. The use of EDM ena bles significa nt improve m ents with respect to t imer-ba sed elec t ricity pricing structures that may induce the bi rth of new peaks due to the synchronisation of the demand. Thi s effe ct is known in electric ity markets: if there is a s tepwise reduc ti on of t he price know n in advanc e, the consumers may respond with programming hi ghe r usage of their devices immediately after the price variation, thus cre ating a loss of diversity in the natural usage of the device s (that is typically not synchronise d). This causes a payback or rebound pea k in the individual demand, that also reflects on the aggregate demand. To reduce this effec t, the use of Mult i-ToU and Multi-CPP electricity pricing has been proposed in [28 ]. In the Multi- ToU s cheme , t he consumers are partitioned int o group s, and different ToU prices are applied to each group, in suc h a way to avoid s ynchronisat ion of the price ch anges. The cost function is determined in such a way that t he expenditure of the consumer is minimise d. In t his way, the consumers receive a kind of compensation for providing f l exibility. I n the re sults shown, the Multi-To U solu tion has the eff ect of fla tt ening the residential demand. The Multi- CP P sche m e achieves a si milar result for t he t ime periods corr esponding to emergency event s. Wi t h E D M , there is no fixed t iming, and the demand peaks can be identified in an accur ate way. As such, it is easy to formulat e t ari ff s tructures that avoid t he rebound peak beca us e are based on the duration curve rather than on the demand pa tt ern (these aspects are discussed in Sec tion 5 ). 4 .2 . Worked exam ple The conc epts illustrate d i n t he previous s ection s are applied to the demand pattern of a r esidential consumer [29], whose data are available for the time step of 1 s and for a period of observation of one day, i.e., 86400 s (Figur e 1). These initial data (that in practi ce are not visi ble from the meter ing outcomes, but are assumed t o be known here in order to make specific considerations on the methods used) are proce ss ed by considering t he elementar y time i nterval t = 1 s for EDM (with diff ere nt choices for the t wo thresholds), and by using TDM at time steps of 1 hour, 30 minutes, 15 minutes, and 1 minute (the l atter value has been chosen for compa rison purposes, even though it i s not a typical time step used i n the current energy metering prac tices at the point of connection to the grid). The demand pattern has multi ple peaks and i s particula rly challenging for testing the EDM effe ctiveness. The tot al energy consumption during the day is 7. 52 kWh. The peak value of the avera ge power determined at each sec ond is 3574 W . Figure 1. Initial data gather ed at 1 s time step. The results of application of the TDM and EDM represe ntations are shown in Table 1. Clearly, t he numerica l values depend on the data, and the resul t s cannot be used for reaching conclusions of genera l validity. In particular, the data us ed contain mor e peaks than progressive variations. For this re ason, the EDM repr esentation obtained by using the thre shol ds d 1 = 500 W and d 2 = 500 Ws leads to 121 events, of which 108 are triggere d by d 1 (cha nge-of -value type), and 117 are t riggere d by d 2 (ac cumulated energy variations type). From these numbers, it is apparent tha t there are many events generate d by t he simultaneous activation of the two thresholds . Likewise, the EDM repr esentation obtained by using the thresholds d 1 = 120 W and d 2 = 500 W s leads to 517 events, of which 517 (i.e., all) are triggere d by d 1 , and 99 are triggere d (also) by d 2 . Table 1. Outcomes of differ ent repre s entations for reconstruc t ing the demand pat tern. Represe ntation Number of points Peak aver age power [W] (and per cent of the peak at 1 s) Euclidean distance after pattern rec onstruction Daily energy losses (per cent of the l osse s calc ulated at 1 s) TDM 60 min 24 932 (26.1%) 366.3 53% TDM 30 min 48 1512 (42.3%) 326.3 63% TDM 15 min 96 2572 (72.0%) 245.5 79% TDM 1 min 1440 3506 (98.1%) 98.1 97% EDM ( d 1 = 500 W, d 2 = 500 W s) 121 3428 (95.9%) 73.6 98% EDM ( d 1 = 120 W, d 2 = 500 W s) 517 3537 (99.0%) 46.9 99% From Table 1 it become s quantitatively clear that the use of TDM wit h time s tep 15 min , 30 min and 60 min provides very poor identification of the actual peaks and of the shape of the demand pattern . Only a TDM with 1 min time step wou l d be effec tive with the se data. C onverse ly, EDM provide s very int ere s ting outcomes by using a lower number of points (events). Fr om the calc ulation of the Euclide an distance s , it is also clea r t hat t he pattern rec onstructed through EDM has lower distanc es from the initial data with respe ct to TDM, thus superior capabili ties concer ni ng the reconstruc tion of the overall demand pattern (not only the peak) . To further vi ew this result, Figure 2 shows the reconstructed demand patterns from the four TDM case s and the two EDM case s. In t he EDM solution with d 1 = 120 W and d 2 = 500 Ws , the number of events (517) become s relatively higher, however it is still l ow er than t he 1440 point s with which TDM cannot reac h compara bl e results. In the last column of Table 1 , the daily energy l osses on the conductor t hat supplies the load (in the hypothesis of a cable with 50 m length) are shown in per cent of t he daily energy losses occur ring in a refere nce case determined from the initial dat a a t 1 s t ime s tep. It appea rs that the daily energy losses may be det ermi ned i n a sa t isf ac t ory way by using the EDM result s wi t h d 1 = 120 W and d 2 = 50 0 W s (99%), in a reasona ble way by using the EDM results with d 1 = 5 0 0 W and d 2 = 50 0 W s (98%) and by using the TDM results with 1 min time step (97%), while in t he other T DM cases the det erm in ation of t he daily ener gy loss es is rather far from the value of the refe r ence case . The use of the results coming from T DM wi th 60 min t ime s tep leads t o determine only 53% of the daily energy losses. Th ese results explain another strong point to promote EDM as a very effective s olution to improve observa bility of the network- rela t ed variable s. The improvement of the calculation of the network l osses has also import an t economic implications, as the es t ima tio n of the costs of the losse s is a key point for the distribution system operators. ! a) TDM 6 0 m i n b) TDM 3 0 m i n ! ! c) TDM 15 min d) TDM 1 min ! e) EDM ( d 1 = 500 W , d 2 = 500 Ws) f) ED M ( d 1 = 120 W, d 2 = 500 Ws) Figure 2. Demand pat t ern rec onst ruction from TDM and EDM outc omes. ! 5. Duration-of-U se scheme for electr i city pricing ! 5.1 . Underlying principles for a Duration-of-Use pricing schem e The basics aspect s to describe the Duration-of- Use (DoU) scheme come from the analysis of Figure 3 . The duration curve is constructed by simply sorting all the en t rie s of the same demand pa tt er n (rec onstructed at 1 s for the sake of comparison) in descending order. The full duration curve of Figure 3a indicates how the main di ffer ences refer t o t he representation of the peaks. The zoom of Figure 3b provides a mor e det ail ed picture of the relations among the di ffer ent represe nt ations of the reconstructed demand pa tt e rn and the ref erence pa tt ern wi th data gathere d at 1 s . The first remark is that hourly-based data gathering (as done today in many real s yst ems) is totally ineffe ctive for the purpose of considering t he demand peaks. If a TDM scheme should be used, it should indicatively operat e w i t h t ime s teps not higher than 1 m inut e. I n fac t , wi t h respec t t o the peak detecte d from T DM a t 1 mi nut e (3 506 W ), any peak pricing scheme constructed on the hourly data for peaks higher t han 932 W would find no action needed on the demand pa tt ern to reduce the peak . This is clearly a misl eading outcome, as the exis ting peaks ar e hidden in the repre sentation based on hourl y metere d data . There by, the t ime s tep of 1 minute seems a reasonable option for interval metering. However, i n stead of using real- time pricing with minute pricing (for which prerequisite would be t he installation of s mart meters with 1-minute time step) , eve nt -driven e nergy metering provides a very detailed re construction of the demand patterns – numerica l evidence has been shown in S ection 4 , by using l ess data and opening the possibility of apply i ng the innovative DoU scheme for electricity pricing to enhance the options t o provi de flexibility from the demand side. ! a) full duration cur ve b) zoom on the lef t -hand side Figure 3 . Duration curves from TDM and EDM outco mes. The proposed DoU scheme is based on se tt ing up limi ts onto t he demand duration curve . On the t im e axis, the li mits are multiple of the EDM elementar y t ime in terval, and are progressively ex tended up t o a given portion of the tot al time observed T x . A qualitativ e example is prese nted in Figure 4, in which t here are two time limits defined on the duration curve, namely, T d 1 and T d 2 , wi t h the corre s ponding power values P d 1 and P d 2 , plus the limit P d 0 valid unt il the t ime T x . Some remarks on the examp le presented in Figure 4: • The t ime hor i zon T x depends on what the operator c onsiders to be relevant for demand flexi bi lity purposes (e.g., one day, or shorter time interva ls) . ! • The representa tion of the limits is stepwise (for t he s ake of easi er repr esentation), however i n genera l it m ay be any funct ion defined by the opera tor in charg e of setting the releva nt option. ! • The limits defined m ay be fixed, or change periodically, even from one time interval to another , to repr oduce the same dynamics already existing from ToU to R TP. In additi on, these limits m ay be set up in absolute value s of power, or in per cent values of a re ference power (e.g., t he cont rac t power). • The are a below the limits also defines the maximum ene rgy t o be consumed in the observa t ion period. Figure 4. Conceptual sketch of the limits imposed by the DoU principle. Once t he li mits have been defined, how is it possible t o construct a scheme for incentivising (or penalising) the consumers? Indeed, there are different possibilit ie s, as indicate d i n m any P BR prac t ice s. In gener al, the demand duration curve originate d by the EDM results is compared wit h t he limits , to assess the amount of time, power and energy t hat exce ed the prescribe d limits. Then, the exceeding quantities may be penalised, with the objective of reac hi ng a fl a tt er demand pa tt ern, leaving the consumer the choice on how t o rea ch this obj ective. The la tt er point is quite import an t, because the absence of a defined t ime slo t wi th be tt er conditions avoids to induce synchronised peaks in the modified demand pa tt ern, a nd contribut es to the possibility of fla tt ening the aggrega t e demand curve formed by the aggrega t ion of more demand pa tt erns 0123456789 time [s] 10 4 0 1000 2000 3000 4000 power [W] Initial data at 1 s EDM (120,500) TDM 15 min TDM 30 min TDM 60 min TDM 1 min 0 1000 2000 3000 4000 5000 6000 7000 8000 time [s] 0 1000 2000 3000 4000 power [W] Initial data at 1 s EDM (120,500) TDM 15 min TDM 30 min TDM 60 min TDM 1 min ! time! power ! T x # T d 1 # T d 2 # P d 1 # P d 2 # P d 0 # [28 ]. In a way consist en t wi th P BR concepts, a given amount of the exceeding quantit y ( e. g. , 5%) cou ld be tolerated wit hout being penalised , especially if the tot al time observed is relatively long (e.g., one day or more). 5.2 . Example of Durat i on-of- Use li mi ts Le t us consider again the consumer analyse d in S ecti on 4.1. The total energy below the DoU limit s i s 36.42 k W h, much higher tha n the 7.52 k W h consumed during the da y, so ther e is room for appl ying flexibilit y to shi ft the consumpt io n w i thout any curt ailm en t. In the best cas e, al l the demand duration curve will remain below the DoU limit s, o therwise so me pen alti es could be poss ible. The EDM outcomes obtained with the thresholds set t o d 1 = 120 W and d 2 = 500 Ws are used to show an example of application of the DoU l imits (Figure 5) . The data referr ing to the DoU limit s are T d 1 = 600 s (10 min), T d 2 = 1800 s (30 min), and the power value s P d 1 = 3000 W, P d 2 = 2 000 W, and P d 0 = 1500 W. The excess energy with respect to the DoU li mit in the first 10 min is 54 Wh, in the successive 20 m in is 218 W h , and in the remaining part of t he day is 502 Wh. The application of the actions to improve flexibili t y needs a detailed analys is of the appliances, l ifestyle of the occupa nts, possible hom e au tomation to control the demand, and is out s ide the scope of this pape r. ! Figure 5 . Example of application of DoU limi t s w i th a de mand duration curve ob tained from EDM outcomes. 6. Conclusions In the official document s a t the regulatory level, s mar t me tering is seen as a fundamental enable r for demand side flexibility. However , all reasoning con cer ni ng the benefits, barriers and pot en tial of smart me ter ing is car ried out with the hypot hesi s to exploit interva l meters. The curre nt roll-out of sm art me t ers is expec t ed t o increa se the number of devices installed with metering capabilities corresponding to t ime s teps ranging from 15 minu t es to one hour. Mi nu te-by-minu t e m e tering is envisioned as a very effe ctive sol ution, but is practica lly not considered at the grid connec t ion sca le. This paper has shown how an i n novative type of meter, based on m easuring the energy demand between triggere d e vents, may open new possibilities to f lex i bility assessment. I n particular , spec i fic innovative options come from the more prec ise demand pattern re construction obtained fr om event-dr iven ene rgy metering. The most remar kable one is the extension of the present peak pricing t o include real-time and Duration-of -Use tariff opti ons, which take i nto account flexibility in a mor e effective way , in line wit h perf ormance-ba sed s tandards used in other sectors (service interruptions and power quality), and never used in t he energy sector beca us e of lack of detailed information about the consumption pa tt erns. The detailed repr esentation of the demand patterns enables the i dentification of the actua l demand peaks in a way that could have been obtained onl y from smart meters with mi nute -based gathering of the metered data. Howeve r, the event-drive n energy metering may provide effe ctive demand pa tt ern reconstruction by using a number of data lower than for minute- based inte rval metering . This reconstruction adds value to t he knowledge o f the proce sses that lead to the electric al demand. Establishi ng a monetar y amount to quanti fy this value is cha llenging, also bec ause there is no true re ference case for direct comparison. This paper has also prov i ded a conceptualisati on of the principles that may lead to the formation of a Duration-of -Use pricing scheme . An application ca se has been used to provide numeric al evidence of a number of adva ntages of eve nt-based energy meterin g, including the provision of more acc urate data for be tt er quant ifica t ion of the network losses. From the results obtained , t he event-drive n energy meter is an enable r to pass from traditiona l calculations of quantities linked to the demand side to performa nce-based quantities that ma y consider detailed and also per cent thre s holds. The sign ifica n t increa se of the precision with which the tec hnical losses in the suppl y grid can be assesse d is a major poi nt for the electricity distributors. In fac t, with the t raditio n al ti m er -driven metering with 15- min ut es to 1-hour t ime step the losses t hat can be estimated when the demand has large variations , as it happens in the last mile of t he electric ity distribu ti on , are largely under- est im ated . This implies a t wofold effe ct: (i) t he lack of knowledge of the corre ct value of technical losses may misleadingly lead to attribute the remaining portio n of the losse s to other non-techn ical contributions ; ( ii) the allocatio n o f the technical losses to the diffe rent custom ers of se rvices could be largely inacc u rat e . A similar reasoning based on Du ra tion-of-U se principle s may be used to cons t ruct a D u ra ti on-of-U se baseline and checking the demand duration against this baseline . P ossible incentives and penalt ies are then applicable by compar ing the actual demand duration with the Du ra tion-of-U se baseline. The detailed analysis of these aspects is outside the scope of th is paper . Likewise, the de finition of the type of incentive or penalty scheme, and the num erica l values of the incentives or penalt ies to be applied, have to come from a dedica ted ana lysis carrie d out on the various types of consumers. Ex te nsive t es ti ng is needed f or t his purpose. This ma tt er i s the s ub ject of the pre sent au thors’ work. References [1] W Marcus , D Grueneic h, P erfor m ance -Based Ratemaking: P rincip les and Design Issues, The Energy Foundation, San Fra ncisco, 1994. [2] GA Com nes, S Stoft, N Greene , LJ Hill, Perf ormance -Based Ratemaking for Electric Utiliti es: Review of Plans and Analysi s of Economic and R esource -Pl anning Issues, Report LB L-375 77UC-1320, November 1995, https://emp.lbl.gov /s ites/default/fi l es/repor t -lbnl-37577.pdf [ac cessed 30 August 2019]. [3] T Gomez , J R ivier , Di stribution and power quality regulation under electric ity compet iti on. A compara t ive st udy, Proc. Nint h Interna tional Confe renc e on Harmonics and Quality of Power , Orlando, FL, 1-4 Octobe r 2000. [4 ] S Aggarwa l , E Burgess, New Regulatory models, March 2014, https://amer i caspowe rplan.com/wp- content/uploads/2014 /03/NewRegulatoryMode ls.pdf [ac cessed 30 August 2019]. [5] Util ity Dive and PA C onsulting Group, 2018 State of the Electric Utility, 2018, https://s3.amazonaws.com /di ve_asse ts/rlpsys/SEU_201 8_Survey_final_we b.pdf [ac cesse d 30 A ugust 2019]. [6 ]Europea n Sm art Grids Task Forc e - Expert Group 3, Demand S ide Flexibility - Perceive d barriers and proposed rec ommendations, Final Report, April 2019 , https://ec.europa . eu/ener gy/sites/ener/files/documents/e g3_final_report_de m and_side_flexiblity_ 2019. 04.15.pdf [acc essed 30 August 2019]. [7 ]M Simonov, G Chicco, G Zanetto, Event-Driven Energy M etering: Principles and Applications , IEEE Transactions on Indust r y Applications 2017, 53 (4) , 3217–3227. [8 ] Council of European Energy Regulators, CEER Distribution Systems W orking Group, Flexibility Use at Distribution Level - A CEER Conc l usions Paper, C18- DS -42-04, 17 July 2018 , https://www.cee r. eu/documents/104400 / 5937686/ACE R-CEER+White+Paper +3- Europea n+Energy+Regulators+White+Paper +3+Fac i litating+Flexibility+2017+05+22/4e 03e0b4- 0886-606d-b69b-f f48225e83f3 [acc essed 30 August 2019]. [9 ] P Grunewa l d, M Diakonova , Flexibility, dyna mism a nd diversity in energy supply and demand: A critical review , Energy Research & Social Science 2018, vol. 38, 58–66. [10] J Ma, V Silva, R Belhom me, DS Kirsche n, LF Ochoa , Evaluating and Planning Fle xibility in Sustainable Power Systems, IEEE Transactions on Sustainable Energy 2013, vol. 4(1), 200– 20 9. [11] B P arrish , R Gross , P He pt onstall, On demand: Can demand response live up to expectations i n managing electr icity systems?, Energy Research & Social Scienc e 2019, vol. 51, pp. 107–118. [12] C ouncil of Europea n Energy Regu l ators, CEER Advice on Ensuring Marke t and Regulatory Arra ngements help de l iver Demand-Side F l exibil ity, Ref: C14- SD E -40-03, 26 June 201 4 , https://www.cee r. eu/documents/104400 / -/-/76519463-a f95-b85a-6f 13-3cdc82fcbff8 [accesse d 30 August 2019]. [13] Council of Eur opean Energy Regulators, CEER Position Paper on Principles for the Va l uation of Flexibility, C EER, July 2016, Ref: C16- FTF -09-03, 2016, ht tps://www . cee r. eu/documents/104400 / -/- /4a605bcf- 9483-d5a0-67fb-368e 75af30cd [accessed 30 August 2019] [14 ] Smart Energy Demand Coalition, Explicit an d Impl icit Demand-Side Flexib ility, Position paper September 2016. [15] Cambridge Economic Policy Associates Ltd, TPA Solutions & Imperial College London , D emand side flexibility – The potential benefits and state of pla y in the European Union , F inal report for A CER, 29 September 2014, ACER/OP/DIR /0 8/2013/LOT 2/RFS 02 , http://www.ace r. europa . eu/official_doc uments/acts_of_the_a gency/r eferences/dsf_fina l _report.pdf [ac cessed 30 August 2019]. [16]Eur opean Com mission DG Energy, Impact assessment study on downstr eam flexibility, price flexibility, demand re spons e & smart m etering - Final Report , ENER/ B 3/2015-641 , July 2016 , https://ec.europa . eu/ener gy/sites/ener/files/documents/d emand_response_ia_study_fina l _report_12- 08-2016.pdf [acce ssed 30 August 2019]. [17] E Lee, K Lee, H Lee, E Kim, W Rhee , D efining virtua l control group to improve customer baseline l oad calc ulation of residential demand re sponse, Applied Ene r gy 2019, vol. 250, 946–958 . [18 ] ENERNOC White Paper, The Demand Respon se Baseline, 200 9 , https://www.naesb.org/p df4/dsm ee_gr oup3_100809w3 .pdf [acce ss ed 30 August 20 19] [19]TK W ijaya, M Vasira ni, K Abere r, When Bias Matters: An Economic Assessment of Demand R esponse Baselines for Reside ntial Customer s , IEEE Transaction s on Smart Grids 2014, vol. 5(4), 1755–1763 . [20 ] KEMA , Inc. , PJM Empirical Analysis of Dema nd Response Baseline Methods , White P aper , 2011 , https://docplayer .net/45222980- Pj m - empirical -analysis-of- demand-response-baseline- m ethods- prepa red-for- the-pjm- ma rkets -implementa tion-committ ee.htm l [acce ss ed 30 August 2019] . [21] M. S imonov, Event-Drive n Communic ation in Smart Grid , IEEE Commun ications Letters 2013, 17 (6) , 1061–1064. [22]M. S imonov , Hybrid scheme of electric ity metering in Smart Grid, IEEE Syste ms Journal 2014, 8 (2) , 422–429. [23]M Simonov, G Chicco, G Zanetto, Real-time Eve nt-based E nergy Metering, IEEE T ransactions on Industrial Informatic s 2017, 13 (6), 2813–2823. [24]M Simonov, H Li, G Chicco, Gather i ng Process Data in Low Voltage S yste ms by Enhance d Event- Driven Meter ing, IEEE Systems Journa l 2017, 11 (3), 1755–1766. [25]H Li, S Gong, L Lai, Z Han, RC Qi u , D Yang, Efficient and S ecur e Wireless Communications for Advanc ed Metering Infra st ructure in S mart Grids , IEE E Trans. Smart Grid 2012, 3 (3), 1540–1551 . [26]M S imonov, G Chi cco, G Zane tto, Handling Load Aggregations with Event-Driven Energy, Second International Conf erenc e on Event-Based C ontrol, Communication, and Signal Processing (EBCCSP 2016) , Krakow, Po land, 13-15 June 2016. [27 ] G Chicco, A Mazz a, M Simonov, Benefits o f ana lytic energy acc ount ing for Industry 4.0, 4th Interna t ional C onfer ence on Event-Based Control, C o mmunication and Si gnal P roce ssing (E B CCSP 2018), Perpignan, Fra nce, June 27- 29, 2018. [28]M Muratori, G Rizzoni, Residential Demand Response: Dynamic Energy M anage m ent and Time- Varying Electr icity Pricing, IEEE T ransactions on Po wer Systems , 2016, 31 (2), 1108–1117 . [29]M Simonov, G Chi cco, S Fe rro, G Zanetto, Knowledge extraction from event-drive n metering of elec trical consumption patterns, Power Systems Comp utation Conference (PSCC 2016) , Genoa , Italy, 20-24 June 2016, Vol. 1, pp. 497–503 .
Original Paper
Loading high-quality paper...
Comments & Academic Discussion
Loading comments...
Leave a Comment