The Second Worldwide Wave of Interest in Coronavirus since the COVID-19 Outbreaks in South Korea, Italy and Iran: A Google Trends Study
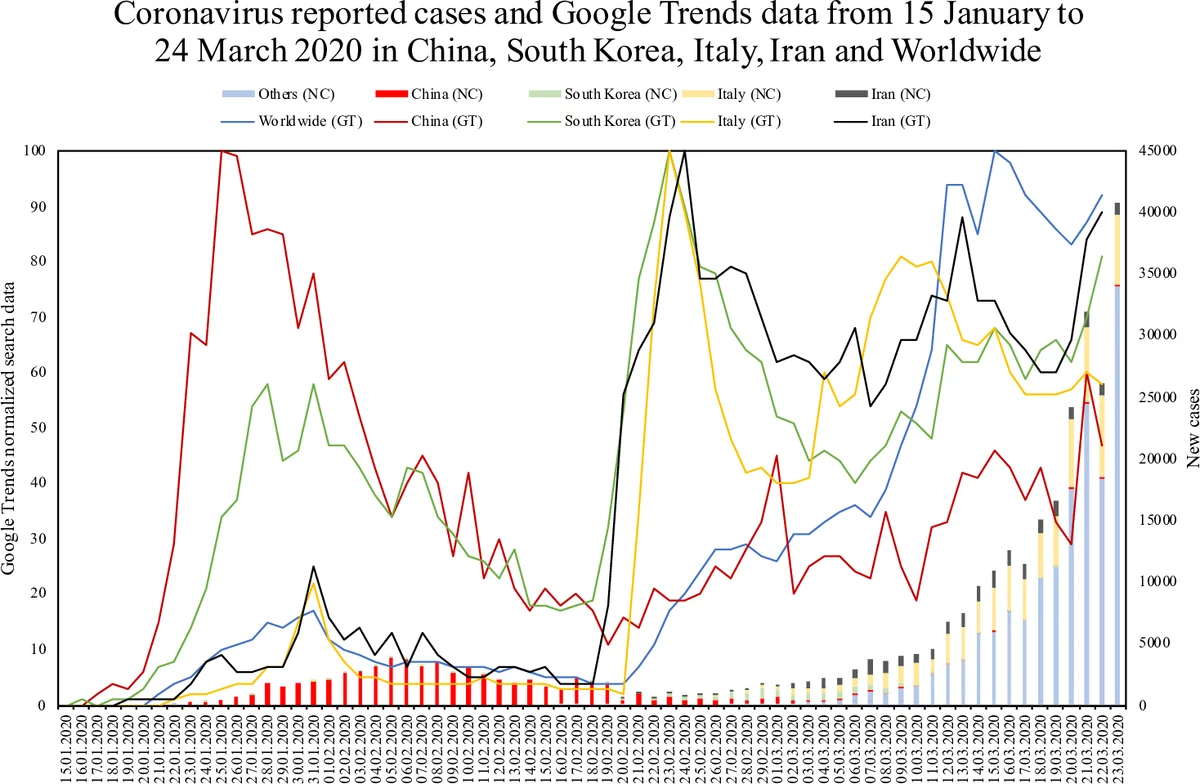
The recent emergence of a new coronavirus, COVID-19, has gained extensive coverage in public media and global news. As of 24 March 2020, the virus has caused viral pneumonia in tens of thousands of people in Wuhan, China, and thousands of cases in 184 other countries and territories. This study explores the potential use of Google Trends (GT) to monitor worldwide interest in this COVID-19 epidemic. GT was chosen as a source of reverse engineering data, given the interest in the topic. Current data on COVID-19 is retrieved from (GT) using one main search topic: Coronavirus. Geographical settings for GT are worldwide, China, South Korea, Italy and Iran. The reported period is 15 January 2020 to 24 March 2020. The results show that the highest worldwide peak in the first wave of demand for information was on 31 January 2020. After the first peak, the number of new cases reported daily rose for 6 days. A second wave started on 21 February 2020 after the outbreaks were reported in Italy, with the highest peak on 16 March 2020. The second wave is six times as big as the first wave. The number of new cases reported daily is rising day by day. This short communication gives a brief introduction to how the demand for information on coronavirus epidemic is reported through GT.
💡 Research Summary
This short communication investigates whether Google Trends (GT) can serve as a real‑time indicator of public interest and, by extension, the spread of the COVID‑19 pandemic. The authors extracted the “Coronavirus” search topic from GT for the period 15 January 2020 to 24 March 2020, focusing on five geographical settings: worldwide, China, South Korea, Italy, and Iran. GT provides a normalized index ranging from 0 (no interest) to 100 (peak interest), allowing comparison across regions and over time without revealing absolute search volumes.
The analysis identified two distinct waves of interest. The first wave peaked globally on 31 January 2020, coinciding with the early reports from Wuhan, China. After this peak, the number of new confirmed cases reported by the World Health Organization (WHO) rose for six consecutive days, suggesting that heightened online search activity preceded the observable increase in infections.
The second wave began on 21 February 2020, following the emergence of sizable outbreaks in Italy, Iran, and South Korea. This wave reached its maximum on 16 March 2020, with a peak six times larger than the first. The authors argue that the magnitude of the second wave reflects the rapid international spread of the virus beyond its original epicenter.
To quantify the relationship between GT interest and case counts, the authors computed Pearson correlation matrices for the two periods. During the first wave (15 January–18 February), worldwide GT scores were strongly correlated with China (r = 0.779, p < 0.01), South Korea (r = 0.890, p < 0.01), and Italy (r = 0.781, p < 0.01). Correlation with Iran was weaker (r = 0.670). In the second wave (19 February–24 March), worldwide GT remained strongly linked to China (r = 0.777, p < 0.01) and Italy (r = 0.297, p < 0.05), while the association with South Korea diminished (r = 0.047, p < 0.05) and the link with Iran strengthened (r = 0.777, p < 0.01). These findings indicate that spikes in public search behavior in each country contributed to the global trend, especially when local outbreaks intensified.
The study acknowledges several limitations. First, Google services are blocked in mainland China, so GT data for that region may be incomplete or biased toward users accessing the platform via VPNs. Second, the rapidly evolving nature of the pandemic means that daily case numbers and search behavior can change dramatically, limiting the temporal relevance of any single analysis. Third, GT captures interest but does not directly measure preventive actions, testing rates, or compliance with public‑health measures, so causality cannot be firmly established.
Despite these constraints, the authors conclude that GT can act as a low‑cost, near‑real‑time “digital surveillance” tool that anticipates rises in confirmed cases. The observed six‑day lag between the first GT peak and the subsequent increase in new cases suggests that public concern may serve as an early warning signal. Incorporating GT data into epidemiological models could improve the timeliness of public‑health responses, especially in settings where traditional surveillance is delayed or under‑resourced.
Future research should explore integrating multiple digital data streams—such as social‑media mentions, mobility patterns, and search queries—into composite indices for outbreak detection. Validation against gold‑standard epidemiological data across diverse geographic contexts would strengthen confidence in the predictive utility of digital infodemiology. Ultimately, the study highlights the promise of leveraging ubiquitous online behavior to complement conventional disease‑monitoring systems during fast‑moving global health emergencies.
Comments & Academic Discussion
Loading comments...
Leave a Comment