Market states: A new understanding
We present the clustering analysis of the financial markets of S&P 500 (USA) and Nikkei 225 (JPN) markets over a period of 2006-2019 as an example of a complex system. We investigate the statistical properties of correlation matrices constructed from the sliding epochs. The correlation matrices can be classified into different clusters, named as market states based on the similarity of correlation structures. We cluster the S&P 500 market into four and Nikkei 225 into six market states by optimizing the value of intracluster distances. The market shows transitions between these market states and the statistical properties of the transitions to critical market states can indicate likely precursors to the catastrophic events. We also analyze the same clustering technique on surrogate data constructed from average correlations of market states and the fluctuations arise due to the white noise of short time series. We use the correlated Wishart orthogonal ensemble for the construction of surrogate data whose average correlation equals the average of the real data.
💡 Research Summary
**
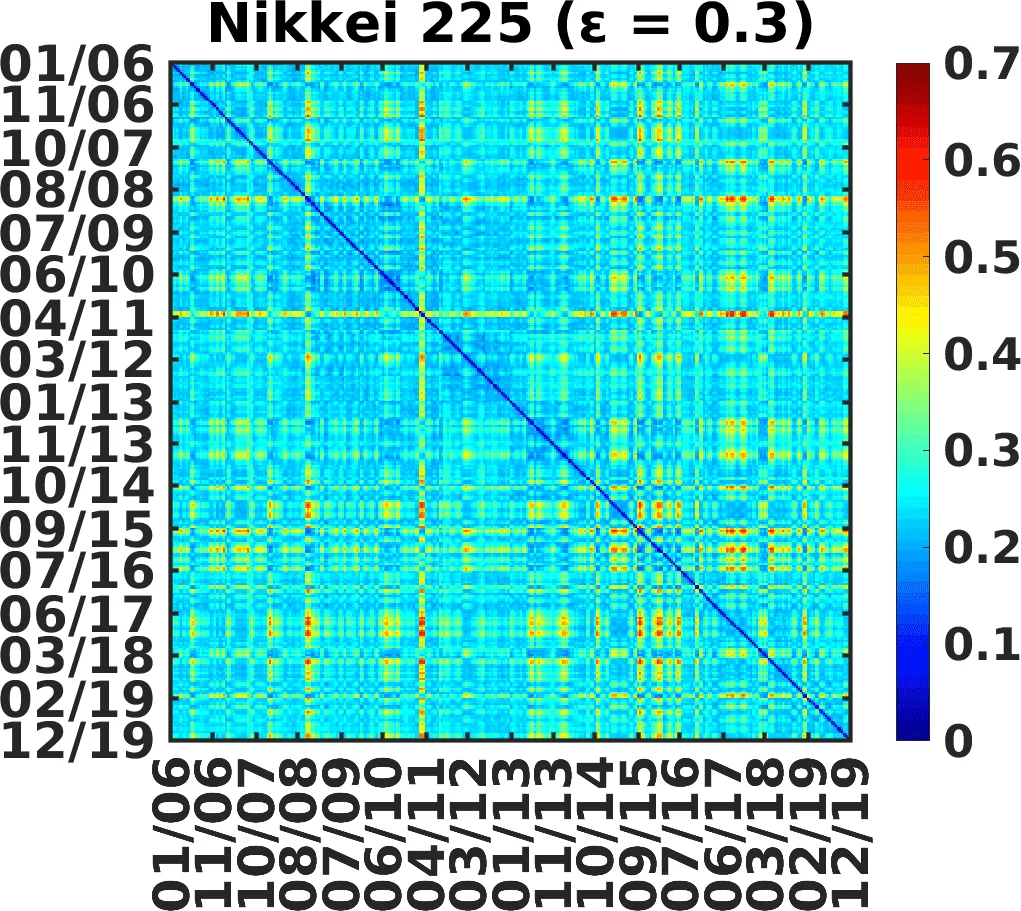
The paper investigates the dynamic structure of two major equity markets—the U.S. S&P 500 and Japan’s Nikkei 225—by treating them as complex systems whose instantaneous correlation patterns can be clustered into distinct “market states.” Using adjusted daily closing prices from January 2006 to December 2019, the authors select 350 S&P 500 stocks and 156 Nikkei stocks that were continuously listed throughout the entire period. Returns are computed as log‑price differences, and a sliding window of 20 trading days (with a 10‑day overlap) is employed to construct Pearson correlation matrices for each epoch. Because such short windows produce highly singular matrices, a non‑linear “power‑map” transformation C_ij → sign(C_ij)·|C_ij|^{1+ε} is applied to suppress noise; the optimal ε values are found to be 0.5 for the U.S. market and 0.3 for the Japanese market, where the intracluster distance variance is minimized.
To identify clusters, the authors define a distance between two correlation matrices as the average absolute element‑wise difference. Multidimensional scaling (MDS) projects these high‑dimensional distances into a three‑dimensional space, after which k‑means clustering is performed. By repeatedly initializing the algorithm 1,000 times and selecting the number of clusters k that yields the smallest standard deviation of intracluster distances, they determine that the optimal partition consists of four clusters for the S&P 500 and six clusters for the Nikkei 225. The intracluster distance curves (d_int) display clear minima at these k values, and the corresponding ε values also coincide with minima of d_int, reinforcing the joint optimization of noise suppression and clustering.
Each cluster is characterized by its mean correlation matrix and, in particular, by its average correlation coefficient μ. For the U.S. market the four states have μ ≈ (0.19, 0.31, 0.46, 0.63), showing a monotonic increase from low‑correlation to high‑correlation regimes. The Japanese market exhibits μ ≈ (0.21, 0.33, 0.43, 0.44, 0.57, 0.68); notably, states S3 and S4 have almost identical average correlations, indicating that average correlation alone cannot fully distinguish all market states in Japan. Transition analysis, performed by tracking the sequence of cluster labels over time, reveals that moves are most likely between neighboring states. Specifically, the probability of transitioning from S3 to S4 in the U.S. market is about 11 %, while the probability of moving from S5 to S6 in the Japanese market is roughly 17 %. Transition count matrices and network visualizations demonstrate that high‑correlation states are typically entered after a series of incremental steps, a behavior that can be described by a master‑equation‑type stochastic process.
To test whether the observed clustering could be a mere artifact of average correlation plus random fluctuations, the authors generate surrogate data using a Correlated Wishart Orthogonal Ensemble (CWOE). For each empirical market state they compute its mean correlation matrix, then construct a Wishart ensemble with that mean and add white noise consistent with the short‑window sampling. Applying the same MDS‑k‑means pipeline to the CWOE data yields cluster structures that closely match those obtained from the real data, both in terms of spatial arrangement in the MDS plot and in the composition of k‑means centroids. This result supports the hypothesis that market states arise from a baseline correlation structure perturbed by stochastic noise, rather than from entirely distinct deterministic patterns.
The authors interpret their findings in the context of market turbulence. They observe that the high‑correlation regime that began around the 2008 financial crisis persisted for several years, especially in the U.S. market, and that a calmer, low‑correlation regime re‑emerged after 2016. In the Japanese market, the presence of more states and the similarity between some of them suggest a richer dynamical landscape, albeit one more heavily affected by statistical noise due to the smaller number of assets. The study therefore refines earlier work that relied heavily on average correlation as the sole determinant of market states, demonstrating that a multi‑state description captures subtler transitions and potential precursors to market stress.
Critical appraisal highlights several methodological considerations. The choice of epoch length (20 days) and the power‑map exponent ε are pivotal; sensitivity analyses varying these parameters are not fully explored, leaving open the question of robustness. k‑means assumes roughly spherical clusters, which may not be appropriate for the intrinsically non‑linear geometry of correlation matrices; alternative clustering techniques (e.g., spectral clustering, DBSCAN) could provide complementary insights. The validation of the number of clusters relies primarily on minimizing intracluster distance variance; incorporating additional metrics such as silhouette scores or Bayesian information criteria would strengthen the argument. Moreover, surrogate data based on CWOE preserve only the mean correlation, so they cannot capture extreme events or structural breaks that may be crucial for early‑warning systems.
Finally, the authors acknowledge limitations and propose future directions. Extending the analysis to include other asset classes (bonds, derivatives), higher‑frequency data, and longer or adaptive window sizes could improve the realism of market‑state models. Integrating the transition matrices into predictive frameworks—such as hidden Markov models or deep learning‑based sequence models—might enable practical early‑warning tools for investors and regulators. Overall, the paper contributes a systematic, statistically grounded methodology for identifying and interpreting market states, offering both theoretical insights into financial complex systems and potential pathways toward actionable market monitoring.
Comments & Academic Discussion
Loading comments...
Leave a Comment