MFCC-based Recurrent Neural Network for Automatic Clinical Depression Recognition and Assessment from Speech
Clinical depression or Major Depressive Disorder (MDD) is a common and serious medical illness. In this paper, a deep recurrent neural network-based framework is presented to detect depression and to predict its severity level from speech. Low-level …
Authors: Emna Rejaibi, Ali Komaty, Fabrice Meriaudeau
MFCC-based Recurrent Neural Network for Automatic Clinical Depression Recognition and Assessment from Speech Emna Rejaibi a,b,c , Ali K omaty d , Fabrice Meriaudeau e , Said Agrebi c , Alice Othmani a a Universit ´ e P aris-Est, LISSI, UPEC, 94400 V itry sur Seine, F rance b INSA T Institut National des Sciences Appliqu ´ ees et de T echnologie, Centr e Urbain Nord BP 676-1080, T unis, T unisie c Y obitrust, T ec hnopark El Gazala B11 Route de Raoued Km 3.5, 2088 Ariana, T unisie d University of Sciences and Arts in Lebanon, Ghobeiry , Liban e Universit ´ e de Bour gogne F ranche Comt ´ e, ImvIA EA7535 / IFTIM Abstract Clinical depression or Major Depressiv e Disorder (MDD) is a common and serious medical illness. In this paper , a deep recurrent neural netw ork-based frame work is presented to detect depression and to predict its se verity lev el from speech. Low-le vel and high-level audio features are extracted from audio recordings to predict the 24 scores of the Patient Health Questionnaire and the binary class of depression diagnosis. T o o vercome the problem of the small size of Speech Depression Recognition (SDR) datasets, expanding training labels and transferred features are considered. The proposed approach outperforms the state-of-art approaches on the D AIC-WOZ database with an ov erall accuracy of 76.27% and a root mean square error of 0.4 in assessing depression, while a root mean square error of 0.168 is achie ved in predicting the depression sev erity le vels. The proposed frame work has several advantages (fastness, non-in vasi veness, and non-intrusion), which makes it con venient for real-time applications. The performances of the proposed approach are e valuated under a multi-modal and a multi-features e xperiments. MFCC based high-lev el features hold relev ant information related to depression. Y et, adding visual action units and di ff erent other acoustic features further boosts the classification results by 20% and 10% to reach an accuracy of 95.6% and 86%, respectiv ely . Considering visual-facial modality needs to be carefully studied as it sparks patient priv acy concerns while adding more acoustic features increases the computation time. K e ywor ds: A ff ectiv e computing, Human-Computer Interaction, HCI-based Healthcare, Speech depression recognition, automatic diagnosis, recurrent neural network-based approach 1. Intr oduction Depression is a mental disorder caused by sev eral factors: psychological, social or ev en physical factors. Psychological factors are related to permanent stress and the inability to successfully cope with di ffi cult situations. Social factors concern relationship struggles with family or friends and physical factors cover head injuries. Depression describes a loss of interest in ev ery exciting and joyful aspect of e veryday life. Mood disorders and mood swings are temporary mental states taking an essential part of daily ev ents, whereas, depression is more permanent and can lead to suicide at its extreme severity le vels. Depression is a mood Email addr ess: Corresponding author: alice.othmani@u-pec.fr (Alice Othmani) disorder that is persistent for up to eight months and beyond. According to the W orld Health Or ganization (WHO), 350 million people, globally , are diagnosed with depression. A recent study estimated the total economic burden of depression to be 210 billion US Dollars per year [1], caused mainly by increased absenteeism and reduced productivity in the w orkplace. In many cases, the a ff ected person denies f acing mental disorders like depression, thus, he / she does not get the proper treatment. Fortunately , depression is a curable disease. Physi- cians make clinical ev aluations based on patients’ sel- freports of their symptoms and standard mental health questionnaires such as the depression severity question- naires. The depression sev erity assessment tests are multiple-choice self-report questionnaires that the pa- Pr eprint submitted to Signal Pr ocessing: Image Communication Mar ch 13, 2020 tient takes. According to the answer , a score is auto- matically assigned. The Patient Health Questionnaire (PHQ) is a commonly used test and it is composed of nine clinical questions. The PHQ score assigned de- scribes the depression severity le vel which ranges from 0 to 23. Even when patients self-report their symp- toms, doctors correctly identify depression only half the time [2]. This is mainly due to many similar symp- toms between depression and other illnesses like hy- pothyroidism, hypoglycemia or ev en normal stress due to busy daily w ork. Recently , automatic mental states and mental disor - ders recognition hav e attracted considerable attention from computer vision and artificial intelligence com- munity . Aiming to improve the human-machine inter- actions, sev eral systems have been de veloped to auto- matically assess the emotions and the current mental state of a person [3]. As human-machine communica- tion takes place through audio-visual sensors, these de- veloped systems study the best features to select from these two modalities to reach the best possible commu- nication quality and boost performances [4]. Se veral ap- proaches ha ve been dev eloped so far to assess mental disorders such as depression more objecti vely based on external symptoms like facial expression, head move- ments, and speech. It has been sho wn that depression a ff ects speech production [5], more particularly it drops the range of pitch and v olume, so the voice becomes softer and lower . Numerous studies in the literature use multi-modal fusion systems combining facial actions (visual cues), vocal prosody and text features [6]. Speech has been prov en to be rob ust in the diagnosis of depression. In sev eral works, depression prediction results using speech only outperform those using visual features or text [6][7]. The fusion of the two modalities: audio and video leads to better depression prediction results [6][8]. But fusing three modalities: audio, video and text, de- creases performances [7]. Speech can be measured cheaply , remotely , non-in vasiv ely and non-intrusi vely [8] leading to a potent impact in recognizing depression. For this reason, the proposed study in this paper focuses on detecting depression using only speech recordings. The use of various depression datasets and depres- sion estimation approaches make it hard to decide which acoustic features sho w a better performance for the assessment of depression [9]. The Mel Frequenc y Cepstral Coe ffi cients (the MFCCs) hav e pro ven their high e ffi ciency in detecting depression compared to other audio features in shallow-based approaches [9][10]. They are also considered as top audio features in speech-based applications like speech and speaker recognition [11][12]. In this paper , lo w-le vel and high-lev el audio features are used in a deep neural network to assess depression. The Recurrent Neural Network is highly performing in speech recognition. This is why , the Short Long-T erm Memory (LSTM) is chosen for extracting high-level audio features. The audio features to be trained within the network are the Mel Frequency Cepstral Coe ffi - cients and their first and second-degree deriv ati ves. Throughout this study , depression is assessed by the self-report depression test of the Patient Health Questionnaire of eight questions (the PHQ-8). The aim of the study is to predict depression / non-depression by predicting the PHQ-8 binary score. A binary score of 0 is given to assess non-depression while a score of 1 is given when depression is diagnosed. It also aims to assess the depression severity le vels by predicting the 24 PHQ-8 scores (0 for non-depression; 10 for moderate depression; 23 for sev ere depression). The outline of this paper is as follo ws. The related works are introduced in Section 2. Next, the proposed approach based on deep recurrent neural network is pre- sented in Section 3. Section 4 illustrates and analyzes the experimental results and the depression corpus used. Finally , the conclusion and future works are provided in Section 5. 2. Related work Sev eral works in automatic depression recognition and assessment are reported in the literature [13]. Au- tomatic depression recognition has become more and more popular since 2011 with the emergence of the eight successiv e editions of the Audio / V isual Emotion Challenge A VEC [14]. T ypically , depressed individuals tend to change their expressions at a very slow rate and pronounce flat sentences with stretched pauses [15]. Therefore, to detect depression, two types of features are frequently used: facial geometry features and audio features for their ability and consistency to re veal signs of depression. The majority of approaches proposed, hav e the same structure with four main processing steps: preprocessing, feature extraction, dimension reduction, and classification [16]. T w o di ff erent approaches are mainly adopted to as- sess depression: hand-crafted features based approaches and deep-learning based approaches. Deep-learning based approaches outperform hand-crafted ones. The 2 best reported performance for automatic depression recognition from speech to the best of our knowledge is presented in [7] where an approach based on 238 lo w- lev el audio features are fed to a Deep Con volutional Neural Network follo wed by a Deep Neural Network. The best root mean square error obtained reaches 1.46 ov er a group of depressed men in the prediction of the PHQ-8 scores. 2.1. Hand-cr afted featur es-based approac hes This family of approaches tackles two di ff erent tasks: hand-crafted audio features extraction and classifica- tion. The extracted hand-crafted audio features to de- tect depression might be classified into fi ve main groups [17] [18]: • The Spectral features: related to the spectrum analysis like the Spectral Centroid that locates the center of gravity of the spectrum, the Spectral Flat- ness that determines the tone le vel of a band of the spectrum and the Ener gy [17] [18] [19]. • The Cepstral features: related to the Cepstrum analysis (an anagram to the Spectrum signal) like the Mel F requency Cepstral Coe ffi cients (MFCCs) that are considered to be the most commonly used audio features in speakers recognition for their high performance in describing the variation of lo w frequencies of the signal [17] [18] [20] . • The Glottis features: deriv ed from the vocal tract, the organ of the Human body responsible o ver pro- ducing speech [17] [18]. • The Prosodic features: describe the speech into- nation, rate, and rhythm, like the Fundamental F re- quency F0 (the first signal harmonic) and the Loud- ness [8] [18] [21] . • The V oice Quality : like the F ormants (the spec- trum maxima), the Jitter (the signal fluctuation) and the Shimmer (the peaks variation) [8][21]. The audio features extraction is processed for dif- ferent segmentation window lengths. [22] proposes better depression prediction results using the windo w of 20s, shifted forward by 1s, compared to a 3s-window . Meanwhile, [7] proposes a window of 60ms, shifted forward by 10ms, to predict depression using a neural network model. A comparativ e study of the performances of various classifiers in detecting depression from spontaneous speech was established in [20]. Three audio features fusion methods are tested for each classifier: features fusion, score fusion (one score is assigned for each fea- ture while classifying it), and decision fusion (weighted majority voting). Fiv e classifiers are tested: the Gaussian Mixture Models (GMM), the Support V ector Machines (SVM) with raw data, the Support V ector Machines with GMM, the Multilayer Perceptron neural networks (MLP), and the Hierarchical Fuzzy Signature (HFS). The model of the SVM with GMM outperforms the other classifiers with the decision fusion method. The accuracy achieved is 81.61%. The least performing classifier is the GMM with the features fusion method. The worst accuracy achiev ed with GMM is 48.26%. 2.2. Deep learning-based appr oaches The deep learning-based approaches for SDR could be categorized into two groups: those which use the raw audio signal as input and others which e xtract hand-crafted features and use them as input of the deep neural network. For instance, [12] and [23] propose a deep learning-based approaches that use the raw audio signal as input. While, the Mel-Scale Filter Bank is applied in [12] and the extracted fea- tures are fed to a Con volutional Neural Network (CNN). Di ff erent studies compare di ff erent deep learning- based architectures such as the Deep Conv olutional Neural Network (DCNN), the Deep Conv olutional Neural Network follo wed by a Deep Network (DCNN- DNN) and the Long Short T erm Memory network (LSTM). The DCNN-DNN outperforms the DCNN in predicting the PHQ-8 scores of depression severity lev els [24]. The best results achiev ed with DCNN- DNN is a root mean square error of 1.46 on a group of depressed men [7]. The performance of the LSTM in predicting depression is e valuated with the F1 score. The recurrent neural network proposed achiev es only 52% in detecting depression but reaches 70% when it comes to detecting non-depression [12]. The deep learning based approaches highlight the fact that the gender (male / female) has an impact on the model’ s performances. The depression assessment results in [7] sho w that the root mean square error achiev ed with the DCNN-DNN model on a group of de- pressed women is three times higher that the root mean square error achie ved on a group of depressed men us- ing the same model. 3 3. Pr oposed Method 3.1. Method o verview The deep learning based approach proposed in this paper aims to assess depression and predict its se verity levels using the Mel Frequency Cepstral Coe ffi cients and the Long Short T erm Memory network. The steps follo wed throughout this study are summa- rized in Fig. 1. First, the audio signals are preprocessed (Section 3.1.1). Next, the lo w-lev el audio descriptors are extracted and normalized (Section 3.1.2 and Sec- tion 3.1.3). The low-le vel features are the MFCC fea- tures. In the following step, these MFCC features are fed to the deep neural network for depression predic- tion (see Section 3.1.4). Depression datasets av ailable to assess depression from speech are relativ ely small. T o overcome this challenge, data augmentation is per - formed and described in Section 3.1.5 and knowledge transfer from related task is e ventually carried out in Section 3.1.6. The proposed deep-based framew ork is presented with more details in the following contents. 3.1.1. Pr epr ocessing The audio recordings are clinical interviews. They are conv ersations between an intervie wer and the par - ticipants (the intervie wees). The recordings are prepro- cessed in order to retrie ve the speech of the participants only . As the main goal is to automatically detect depres- sion from the participants’ spoken answers, the record- ings are separated into two groups by the speaker: one group has the audio se gments of the participants and the other has the audio segments of the interviewer . The audio segments of the interviewer are no longer used in this study . 3.1.2. Low-Le vel F eatures Extr action The Mel Frequency Cepstral Coe ffi cients (MFCC) are the most commonly used audio features in speaker recognition due to their robustness in describing the variation of low frequencies signal. The MFCC coef- ficients describe the energies of the cepstrum in a non- linear scale, the mel-scale. The y are considered as the most discriminati ve acoustic features that approximate how the ”human peripheral auditory system” perceives the speech signal [11]. The first and the second deriv a- tiv es of these coe ffi cients allo w to track their variation ov er time and thus track the variation of the speech tone [25]. For these reasons, in this proposed work, only the MFCC coe ffi cients are extracted in order to study their robustness in a speech-based application of automatic diagnosis of depression. In this work, the low-le vel features are defined as the MFCC coe ffi cients and they are extracted from the preprocessed audio recordings. The speech signal is first divided into frames by applying a windowing function of 2.5s at fixed intervals of 500 ms. The Hamming window is used as window function to remov e edge e ff ects. A cepstral feature v ector is then generated for each frame. The Discrete Fourier T ransform (DFT) is com- puted for each frame. Only the logarithm of the am- plitude spectrum is retained. The spectrum is after smoothed to emphasize perceptually meaningful fre- quencies. 24 spectral components into 44100 frequenc y bins are collected in the Mel frequency scale. The com- ponents of the Mel-spectral vectors calculated for each frame are highly correlated. Therefore, the Karhunen- Loev e (KL) transform is applied to the Mel-spectral vectors to decorrelate their components. The KL trans- form is approximated by the Discrete Cosine T ransform (DCT). Finally , 60 cepstral features are obtained for each frame. 3.1.3. Data Normalization Since the range v alues of the MFCC coe ffi cients v ary widely , their impact within the deep network might be non-uniform and the gradient descent might conv erges to null very fast. Therefore, the range values of all the MFCC coe ffi cients should be normalized beforehand. The Sandardization method (the Z-score Normaliza- tion) is the most commonly used scaling method with audio features. As the same channel conditions are used for all the audio recordings, the MFCC coe ffi cients are not normalized per 60ms-audio frames. They are, rather , normalized all at once using the mean v alue and the standard deviation. The distribution of the mean and the standard deviation are calculated across the coe ffi - cients. Next, the mean is substracted from each Mel scale frequency coe ffi cient, that is, later, divided by the standard deviation. 3.1.4. High-Le vel F eatur es Extraction and Classifica- tion An MFCC-based RNN is proposed as a high-lev el features extractor and classifier as shown in Fig. 4. As LSTM is one of the most performing recurrent neural networks, it is used in the baseline of the proposed model. The input of the deep model is the MFCC extracted matrix of size n (n is the total number of 60ms audio frames extracted from the audio segments) by the 60 Mel Frequency Cepstral Coe ffi cients. The 4 Figure 1: The proposed approach to assess depression. Fist, the audio recordings of the clinical interviews are preprocessed and the audio segments of the participants’ speech only are retrie ved. The low-lev el features are then extracted from the audio segments and normalized. The labeled training set is expanded through transfer learning and data augmentation where new audio segments of the participants’ speech only are generated. Finally , the MFCC-based Recurrent Neural Network is trained to detect depression / non-depression or to predict the depression se verity lev el. architecture proposed is composed of three successive LSTM layers followed by two Dense layers as shown in Fig. 4. The model predicts depression and assesses its se ver- ity lev el. The output layer of the MFCC-based RNN is a two-cell dense layer acti vated with a sigmoid func- tion to predict the PHQ-8 binary . Ho wev er , the output layer to predict the PHQ-8 scores is a dense layer of 24 neurons activ ated with a softmax function. 3.1.5. Data augmentation Aiming to impro ve the MFCC-based RNN’ s per- formances and to avoid ov erfitting, data augmentation is carried out to increase and to div ersify the input data. Data augmentation techniques are applied on the preprocessed audio segments of each participants speech. New audio segments are generated by applying the following four di ff erent data augmentation techniques ov er the preprocessed audio segments: • Noise Injection : adds random v alues into the data with a noise factor of 0.05. • Pitch A ugmenter : randomly changes the pitch of the signal. The pitch factor is 1.5. • Shift A ugmenter : randomly shifts the audio sig- nal to left or right. The shift max v alue used is 0.2 seconds. If the audio signal is shifted to the left with x seconds, the first x seconds are marked as silence (Fast Forwarding the audio signal). If the audio signal is shifted to the right with x seconds, the last x seconds are marked as silence (Back For - warding the audio signal). • Speed A ugmenter : stretches times series by a fixed rate with a speed factor of 1.5. Fig. 2 displays an example of a random participant’ preprocessed audio segment before and after data aug- mentation. The data augmentation technique performed in this example is the random pitch augmenter with a pitch factor of 1.5. 3.1.6. T ransfer Learning The core challenge to ov ercome throughout this study is the limited depression data a vailable as an input to the MFCC-based RNN. The second proposed solution is to transfer knowledge from an independent, yet related, previously learned task. For that, a pretraining is first applied to pretrain the MFCC-based RNN on a related task. In this study , emo- tions recognition from speech is chosen as the related task. Second, fine-tuning on the target task, depression recognition from speech, is performed. The number of neurones of the third dense layers in the MFCC-based RNN model is modified and it is chosen to be as the number of emotions in the related task dataset. Once the MFCC-based RNN is pretrained on the emotions recognition dataset, the optimum weights of the model are used as a starting point during the fine-tuning of the model on depression recognition dataset. 5 (a) The preprocessed audio segment before data augmentation. (b) The generated audio segment after pitch augmentation. Figure 2: An example of a preprocessed audio segment of one partic- ipants speech before and after data augmentation. The data augmenta- tion technique used is the random pitch augmenter with a pitch factor of 1.5. 4. Experiments and results 4.1. Datasets Three datasets hav e been used in the experiments: 4.1.1. D AIC-WOZ corpus The main dataset used in this paper to assess depres- sion is the D AIC-WOZ depression dataset [26] which is used in the A VEC2017 challenge [21]. The DAIC-W OZ corpus is designed to support the diag- nosis of psychological distress conditions: depression, post traumatic stress disorder (PTSD), etc. It provides audio recordings of 189 clinical interviews of 189 par- ticipants answering the questions of an animated virtual interviewer named Ellie. Each recording is labeled by the PHQ-8 score and the PHQ-8 binary . The PHQ-8 score defines the severity lev el of depression of the participant and the PHQ-8 binary defines whether the participant is depressed or not. For technical reasons, only 182 audio recordings are used. The av erage length of the recordings is 15 minutes with a fixed sampling rate of 16 kHz. The repartitions of the participants by their gender , depression, and depression severity level are shown in Fig. 3. Almost half of the participants are females (46%) (Fig. 3b) and the third of the participants are labeled de- pressed (Fig. 3a). Among the depressed participants, almost half of them are females (29 out of 54 partici- pants) (Fig. 3c). According to the repartitions in Fig. 3, the dataset is gender-balanced. Ho we ver , it is class- imbalanced as the number of non-depressed participants is three times higher than the number of depressed par- ticipants. After data preprocessing, 80% of the audio segments are used for training, 10% of them are used for validation and 10% for testing. 4.1.2. RA VDESS dataset The e xperiment of transfer learning described in Sec- tion 3.1.6, uses a related task dataset. In this study , RA VDESS dataset [27] is used for this purpose. It is a dataset for emotions recognition [28, 29, 30]. It con- tains audio recordings of 24 actors expressing eight dif- ferent emotions: neutral, calm, happy , sad, angry , fear- ful, disgust, and surprised. For each actor , eight trials per emotion are recorded for two di ff erent tasks: speak- ing and singing. The average length of the audio record- ings within the dataset is fiv e seconds. 4.1.3. A V i-D dataset The generalization of the proposed model to other dataset is eventually e valuated in Section 4.3.6. For that, the performance of trained MFCC-based RNN is e valu- ated on the A V i-D corpus which was introduced during the A VEC2014 challenge [22, 31]. The A V i-D dataset is depression and a ff ects database. 300 audio record- ings are collected from 292 participants who go through two di ff erent tasks: the Northwind task (reading task) and the Freeform task (answering questions). Approxi- mately , 150 audio recordings are av ailable per task. The A V i-D corpus is based on the commonly used depression assessment test: The Beck Depression In ventory-II for assessing the sev erity lev els of depres- sion. The audio recordings are labeled by the BDI-II scores ranging from 0 to 63. A BDI-II score of 14 is the threshold to use for depression assessment. For a score belo w this threshold, the patient is labeled non- depressed. 4.2. Implementation details MFCC-based RNN implementation. The MFCC matrix is of size n (n is the total number of 60ms audio frames extracted from the preprocessed audio segments) by the 60 Mel Frequenc y Cepstral Coe ffi cients. Successi ve 60- unit input vectors are fed to the first LSTM layer . The three LSTM layers hav e 40, 30 and 20-output cell units. Each LSTM layer is parametrized as follows: 6 29.83 % Depressed 70.17 % Non-Depressed (a) Partition of depressed and non-depressed participants. 46 % Female 54 % Male (b) Gender repartitions of the participants. Female Male 20 40 60 80 29 25 54 73 #participants depressed not depressed (c) Male / female repartitions across de- pressed and non-depressed participants. 0 1 2 3 4 5 6 7 8 9 10 11 12 13 14 15 16 17 18 19 20 21 22 23 0 5 10 15 20 12 8 6 6 5 2 3 4 2 6 5 5 4 1 0 2 2 1 2 1 3 1 1 1 13 9 11 9 5 8 3 9 3 2 5 2 3 2 1 3 3 3 2 1 1 0 0 0 Female Male (d) Male / Female repartitions across the severity le vels of the PHQ test. Figure 3: Gender , depression and severity lev el repartitions of the participants within the D AIC-WOZ Corpus. (a) Depressed versus Non-Depressed participants. The PHQ-8 binary of Depressed participants is 1 and the PHQ-8 binary of Non-Depressed participants is 0. (b) Gender repartition of the participants. (c) The repartition of males and females across the depressed and the non-depressed participants. Blue color for depressed while pink color for non-depressed. (d) Male and female participants repartitions across the 24 depression se verity lev els giv en by the PHQ-8 test. • the LSTM is activ ated with the hyperbolic tangent activ ation function (tanh), • the LSTM recurrent step is acti v ated with the hard sigmoid activ ation function, • a recurrent dropout of 0.2% is applied to prevent the recurrent state from ov erfitting, • the kernel weights are initialized using the glorot uniform initializer , • during the optimization, penalties are applied over the bias v ector using the regularizer function to im- prov e performances. The l1 imposed constraint is 0.001. A batch normalization layer is assigned to each LSTM layer along with 0.2% dropout. The following two dense layers are of size 15 and 10, respectively . They are acti vated with the hyperbolic tangent function. The output dense layer is of size 2 and is acti vated with a sigmoid function to predict the PHQ-8 binary (0 for non-depression and 1 for depression). The sixth layer of the MFCC-based RNN model is replaced by an output dense layer of size 24 neurones with a softmax activ ation function to predict the 24 depression sev erity lev els (the PHQ-8 scores). The optimizer used within the proposed deep frame- work is the Adam optimizer with a learning rate of 10 − 3 and a decay of 10 − 6 . T o pre vent the model from training instability or training failure caused by a large learning rate or a tiny one, the learning rate used is an adaptiv e one. It is updated each epoch and decreases from 10 − 3 up to 10 − 10 according to the estimated error . T o com- pare the proposed approach performances with previous works, the loss function calculated across the epochs is the root mean square error instead of the cross-entropy loss function. The batch size for the training model across all the ex- periments is set to 130. After e valuating the results ob- tained with several batch sizes ranging from 32 to 500, the best size range to be used is between 100 and 170; under 100 the model overfits and beyond 170 the model underfits. MFCC-based RNN implementation in tr ansfer learning. The proposed framew ork is pretrained with the emo- tions recognition task. The last layer of the dense is of size eight neurones to predict the eight emotions classes. After pretraining, the model is fine-tuned with the tar- get task of depression assessment: the first three LSTM layers are frozen and the last three Dense layers are re- trained. 7 Computational Comple xity . T o run the experiments de- scribed abov e, the machine used is connected to an NVIDIA GeForce GTX 1080 GPU with 16GB RAM and 350GB storage. The operating system is windows 10 with its latest updates installed. T raining the MFCC- based RNN takes fiv e days. The prediction time is 2 ∗ 10 − 3 seconds. The computational time of the pro- posed model is reasonable and satisfies real-time appli- cations. 4.3. Experimental r esults 4.3.1. MFCC-based RNN Evaluation The proposed deep framew ork is trained to deliv er two di ff erent tasks. The first task is to assess depression under the PHQ-8 binary test. The second one is to pre- dict its sev erity levels under the PHQ-8 scores test. The obtained results are reported per sample (one sample corresponds to the MFCC coe ffi cients extracted from 60ms-audio frame). The performance of the network is ev aluated for both tasks as follows: Evaluation of the depr ession assessment task. T able. 1 summarizes the resulting performances after training the main network ov er the training and validation sets. The best validation accuracy achie ved by the proposed architecture is 67.61% with a root mean square error of 0.5 calculated on the v alidation set. The model’ s perfor- mances o ver the training epochs are sho wn in Fig. 5. At the end of the training, the validation accuracy slightly exceeds the training accuracy (Fig. 5a) which demon- strates that the MFCC-based RNN does not ov erfit at the end of the training and has the ability to make cor- rect predictions on a ne w set of data unused for training. Evaluation of the depr ession severity le vels prediction task. The model is trained to predict 24 classes in- stead of two and the root mean square error (RMSE) achiev ed is three times better than the RMSE achie ved in the depression assessment task. The RMSE reaches 0.168. The proposed approach performs ten times better than the benchmark used in this study in the depression sev erity levels prediction task. 4.3.2. Data augmentation e valuation The data augmentation experiment is only ev al- uated over the depression assessment task. After training the MFCC-based RNN on the augmented dataset, the v alidation accurac y increased by 6.39% to reach 74%. While, the validation loss dropped by 0.08 and reached an RMSE of 0.42 (T able. 3). The performances improv ement is explained by the more Results Accuracy RMSE T raining Set 67.33% 0.5068 V alidation Set 67.61% 0.5057 T able 1: MFCC-based RNN performance in the PHQ-8 binary clas- sification for the depression assessment task. V alidation Results Accuracy RMSE Female 85% 0.32 Male 83% 0.34 T able 2: Gender E ff ect ov er the MFCC-based RNN performance in the PHQ-8 binary classification. important number of input data and their div ersification. The confusion matrix in Fig. 7a shows that 66% of the samples are correctly identified as non-depression. But, only , 7.9% were correctly identified as depression. T ak- ing into consideration that the input data is imbalanced and that only the third of the participants are labeled as depressed (Fig. 3a), the F1 score should be ev alu- ated. The F1 score is based on the harmonic mean that punishes the extreme values caused by imbalanced data. T able. 4 sho ws that 70% of the samples predicted as de- pression are well-classified. Howe ver , due to limited data, the ability to detect depression is 26%. The F1 score for depression increases up to 38% which proves that the netw ork would improv e more if more input data of depressed participants is introduced. As two thirds of the input data is for non-depressed participants the F1 score for non-depression reaches 84%. 4.3.3. T ransfer Learning evaluation For depression assessment, T able. 5 shows that the validation accuracy increased by 8.66 % compared to the one obtained with the first experiment to reach 76.27%. The validation drops by 0.1 and reaches 0.4. As shown in Fig. 7b and T able. 6, the F1 score of depression has increased by 8% to reach 46% compared to 38% with data augmentation. This is explained by Results Accuracy RMSE T raining Set 74.66% 0.4163 V alidation Set 74% 0.4206 T able 3: MFCC-based RNN performance in the PHQ-8 binary clas- sification after data augmentation. 8 Figure 4: Overall structure of the MFCC-based RNN approach for automatic depression recognition. After preprocessing an audio sequence, an MFCC matrix of size n audio frames of 60ms by the 60 Mel Frequency Cepstral Coe ffi cients is generated and then fed to the MFCC-based RNN. The MFCC-based RNN presents three LSTM layers followed by two fully connected layers. T o predict the PHQ-8 binary (0 for non-depression and 1 for depression), the output layer is a dense layer of size 2 neurones with a sigmoid acti vation function. While, to predict the PHQ-8 scores (the depression sev erity lev el), the output layer is a dense layer of size 24 neurones with a softmax activ ation function. (a) Training and V alidation Accuracy . (b) Training and V alidation Loss. Figure 5: MFCC-based RNN accuracy and loss in the training and in the validation. A batch size of 130 over 120 epochs (displayed on the X-axis) is considered. DAIC-WOZ dataset is randomly divided into 80% for training and 20% for validation. During the training phase, 90% of the training set is used for learning the weights and 10% is used for testing. Class Precision Recall F1 Score Non-Depressed 75% 95% 84% Depressed 70% 26% 38% Accuracy 74% T able 4: MFCC-based RNN performances under depressed and non- depressed groups based on three metrics (precision, recall and FI score) after data Augmentation. Results Accuracy RMSE T raining Set 77.21% 0.3991 V alidation Set 76.27% 0.4055 T able 5: MFCC-based RNN performances in the PHQ-8 binary clas- sification after transfer learning setup. The proposed network is pre- trained on the RA VDESS dataset and fine-tuned on the DAIC-W OZ dataset. Class Precision Recall F1 Score Non-Depressed 78% 94% 85% Depressed 69% 35% 46% Accuracy 76% T able 6: MFCC-based RNN performances under depressed and non- depressed groups based on three metrics (precision, recall and FI score) after transferring knowledge from an other task. 9 (a) The Multi-Modal Experiment (b) The Multi-Channel Experiment Figure 6: Overall structure of the MFCC-based RNN approach for the depression assessment task over two di ff erent experiments: a)The Multi- Modal Experiment: 20 facial action units pro vided by the D AIC-WOZ corpus are concatenated with the flattened v ector of the third LSTM layer’ s output. The new features’ v ector is then fed to the fully connected layers for classification. b)The Multi-Channel Experiment: 53 acoustic features are extracted from audio frames windowed by 10ms, they are concatenated with the MFCC-based high-level features and then fed to the fully connected layers. 131766 66.14% Non-Depressed Non-Depressed 44830 22.5% Depressed Sum lin 176596 74.61% 25.39% 6879 3.45% Depressed Sum col 138645 95.05% 4.96% 15762 7.91% 22641 69.62% 30.38% 60592 26.01% 73.99% 199237 74.05% 25.95% Predicted Actual (a) Data Augmentation Experiment (Section 4.3.2) 93176 66.37% Non-Depressed Non-Depressed 26733 19.04% Depressed Sum lin 119909 77.71% 22.29% 63658 4.53% Depressed Sum col 99534 93.16% 6.39% 14127 10.06% 22641 69.62% 30.38% 40860 34.57% 65.43% 140394 76.43% 23.57% Predicted Actual (b) Transfer Learning Experiment (Section 4.3.3) 167714 41.08% Non-Depressed Non-Depressed 133980 32.82% Depressed Sum lin 301694 55.59% 44.41% 54738 13.41% Depressed Sum col 222452 75.39% 24.61% 51783 12.69% 106521 48.61% 51.39% 185763 27.88% 72.12% 408215 53.77% 46.23% Predicted Actual (c) Generalization experiment (Section 4.3.6) Figure 7: Confusion Matrices of MFCC-based RNN generated on the test set of three di ff erent experiments: (a) Data Augmentation experiment, (b) T ransfer learning experiment, (c) Generalization of the MFCC-based RNN model to other dataset experiment. 10 the 9% increase of the recall of depression. 69% of the samples predicted as depression are well-classified. Pretraining the model over an independent, yet, re- lated task has improved its ability to predict depression ev en without increasing the input data of depressed par- ticipants. By pretraining the MFCC-based RNN model on another dataset, it has learned more comple x and ab- stract features in the first layers, which then improves its performance in the target task. 4.3.4. Gender e ff ect assessment Throughout this experience, the input data is loaded into two separate groups: one for Male participants and one for Female participants. The purpose of this experience is to assess depression among each group. Thus, the MFCC-based RNN is trained for each one separately . The gender e ff ect assessment is e valuated by comparing the Depressed / Non-Depressed accuracies for both genders. Initially , the validation accuracy for the Female group reaches 85% with a validation loss of 0.32 compared to 83% for Male with a v alidation loss of 0.34 (T able. 2). The network is highly-performing in detecting depression for both genders. The validation accuracy increases by an av erage of 33.8% compared to the initial results in the validation set with 67.61% for depression assessment. Gender a ff ects considerably the performances of the MFCC-based RNN in depression recognition and assessment. Adding another step in the proposed approach to recognize gender can impro ve the performances and it is to consider in future works. 4.3.5. Rob ustness to Noise The robustness to noise of the MFCC-based RNN framew ork is ev aluated by adding noise to the baseline dataset used. Gaussian noise is added to the v alidation set which is 20% of the input data. First, noise is added to a portion of 10% of the validation data and then to the whole set. The gaussian noise is generated with a mean of 0 and a sigma of 0.1. As summarized in T able. 7, with 10% of noise added to the v alidation set, the binary depression classification (depression / non- depression) accuracy drops by 8.27% compared to the one obtained with transfer learning. The accurac y achiev es 68% which is 0.39% higher than the baseline accuracy achiev ed with the MFCC-based RNN model before data augmentation and transfer learning. The drop of the ov erall accuracy is mainly caused by the 19% drop of the depression F1 score that achieves 20%. The F1 score of non-depression drops by 5% only to achiev e 80%. The performance of the deep framework proposed in this study is almost the same after adding Class Precision Recall F1 10% of Gaussian noise Non-Depressed 73% 88% 80% Depressed 41% 20% 27% Accuracy 68% 20% of Gaussian noise Non-Depressed 73% 88% 80% Depressed 41% 21% 27% Accuracy 68% T able 7: MFCC-based RNN performances under depressed and non- depressed groups based on three metrics (precision, recall and FI score) after adding gaussian noise on a 20% validation set. 20% of gaussian noise to the whole v alidation dataset. When adding noise to the dataset, the MFCC-based RNN performances slightly decrease by 8%. Its abil- ity to well-classify depression decreases more than its ability to well-classify non-depression. When increas- ing the noise within the validation data, the performance of the model stays stable and does not deteriorate more. The proposed network is robust to noise and performs ev en better than the baseline model trained without aug- menting the data and without performing transfer of knowledge. 4.3.6. Gener alization of the MFCC-based RNN model to other dataset The proposed recurrent framework is tested on the A V i-D dataset. A good performance means that the MFCC-based RNN generalizes well to other datasets. The model is trained to classify the PHQ-8 binary while it is tested to classify the BDI-II binary , an other similar clinical test for depression assessment. The scores of the BDI-II test range di ff erently from the scores of the PHQ-8 test. Therefore, the ev aluation is performed only for binary classification of depression / non-depression. The model is tested o ver the A V i-D data of the two tasks Freeform and Northwind seperately . Ne xt, the model is tested over the whole set of data of both tasks combined. T able. 8 describes the final results of the general- ization experiment. The best classification accuracy is achiev ed with the Freeform task which reaches 56%. For both tasks combined, the confusion matrix in Fig. 7c shows that 12.69% of the samples are correctly identified with depression. The depression F1 score drops by 11% with the ne w dataset to reach 35% for both tasks combined whereas it drops by 21% with non-depression compared to the F1 scores obtained with transfer learning. 11 T ask Class Precision Recall F1 Freeform Non-Depression 60% 74% 66% Depression 44% 30% 36% Accuracy 56% Northwind Non-Depression 49% 78% 60% Depression 55% 24% 34% Accuracy 50% Both T asks Non-Depression 56% 75% 64% Depression 49% 28% 35% Accuracy 54% T able 8: Generalization of the MFCC-based RNN model to other dataset. The MFCC-based RNN model is trained on DAIC-WOZ dataset and tested on A V i-D dataset. The task on the training concerns the PHQ-8 binary classification, while the task on the test concerns the BDI-II binary classification. The classification accuracy of the generalization drops by 20.43% while comparing it with the one achiev ed with transfer learning. Howe ver , the MFCC- based RNN model performs better in the generaliza- tion experiment in correctly identifying samples of de- pression: 12.69% of the samples are correctly identi- fied with depression while classifying the BDI-II binary . Whereas, only 10% of the samples are correctly identi- fied with depression with transfer learning. These re- sults are e xplained by the di ff erent recording conditions of the participants speech. The Freeform and North- wind tasks are performed by actors who talk and sing. Depression is assessed di ff erently with an other self- reported depression test with a di ff erent threshold le vel. 4.3.7. Comparison with e xisting methods The MFCC-based Recurrent Neural Netw ork is com- pared to a benchmark of works summarized in T able.9. For predicting the depression se verity lev els, the pro- posed deep recurrent framework performs better than the architecture based on a Deep Con volutional Neu- ral Network combined with a Deep Neural Network. The root mean square error (RMSE) achiev ed with the MFCC-based RNN for the PHQ-8 scores prediction is 0.168 while the best RMSE achieved with the DCNN- DNN is 1.46. The proposed framew ork is 9.75 times more performing than the DCNN-DNN. When it comes to predicting the PHQ-8 binary , the MFCC-based RNN performs 15% better in detecting non-depression than the Con volutional Neural Network followed by a Long Short-T erm Memory network. Y et, the latter is 4% bet- ter in detecting depression. 4.3.8. Discussion The MFCC-based RNN reaches an o verall v alidation accuracy of 76.27% in the depression assessment task with a root mean square error of 0.4. T wo choices are made in building the proposed frame work: the use of only the speech modality and the use of only the MFCC coe ffi cients as features. This choice being guided by sev eral criteria: • the high performance of MFCC coe ffi cients in speech-related applications and framew orks, • the robustness of the speech modality in automatic depression recognition, • the non-in vasi veness and the non-intrusion of the speech modality . The proposed approach presents good performance and small computational time. Considering other modalities like facial images can make the proposed framework in- trusiv e but better performing. Adding other audio fea- tures could increase the computational time but it could improv e the performances. In this section, a study of the performances of a multi-modal and a multi-features framew orks is performed. The comparativ e study , as shown in Fig. 6, is elaborated to e v aluate the impact of adding more features or other modalities on the model’ s performance. The multi-modal experiment: In this experiment, as shown in Fig. 6a, visual features are aggregated with the deep audio features for automatic depression recog- nition. The added visual features used in the following experiments are provided by the DAIC-WOZ corpus. T wenty facial action units are indeed concatenated with the flattened output of the pre viously trained three LSTM layers. The concatenation vector of the newly introduced visual features and the extracted high-lev el MFCC features is then fed to the fully connected layers for classification. The ov erall v alidation accuracy achiev ed marked an increase of 19.33% to reach 95.6%, while the valida- tion loss decreased by 0.22 to reach 0.18. The depres- sion F1 score doubled and reached 94%, while the non- depression F1 score increased by 11% to reach 96%. The F1 scores show that adding visual features highly improv es the model’ s ability to recognize signs of de- pression. This concatenation has conquered the data imbalance issue leading to an increased ability to iden- tify depression as much as it is able to identify non- depression. 12 Method Metrics Audio Features Model used Performance [7] PHQ-8 scores 238 LLD DCNN + DNN RMSE = 1.46 Depressed Male [24] PHQ-8 scores 238 LLD DCNN + DNN RMSE = 5.59 Male [12] PHQ-8 binary Raw Audio Signal CNN + LSTM F1 = 70% (Non Depression) + Mel Filter Bank F1 = 50% (Depression) MFCC-based RNN PHQ-8 scores 60 MFCC coe ffi cients LSTM RMSE = 0.168 MFCC-based RNN PHQ-8 binary 60 MFCC coe ffi cients LSTM RMSE = 0.4 Accuracy = 76.27% F1 = 85% (Non Depression) F1 = 46% (Depression) T able 9: Performance comparison of depression recognition and assessment methods on D AIC-WOZ dataset. The multi-featur es or multi-channel experiment: As shown in Fig. 6b, 53 extra acoustic features are used: the fundamental frequency (F0), the V oicing (VUV), the Normalized Amplitude Quotient (NA Q), the Quasi Open Quotient (QOQ), the Harmonic di ff er- ence (H1H2), the Parabolic Spectral Parameter (PSP), the Maxima Dispersion Quotient (MDQ), peakSlope, Rd, Rd conf, the Harmonic Model and Phase Distortion Mean (HMPDM0-24), the Harmonic Model and Phase Distortion Deviations (HMPDD0-12), and the first fiv e Formants. The flattened vector of acoustic features is concatenated with the flattened output of high-le vel MFCC features. The concatenated vector is then fed to the dense layers. The overall accuracy reached 86% on the validation set marking an increase of almost 10%. Meanwhile, the validation RMSE reached 0.32 marking a decrease of 0.08. The non-depression F1 score increased by 5% only , while the depression F1 score increased by 29% to reach 75%. These results go in line with state of the art. A shallow-based approach in [6] marked an increase of 12% of the mean F1 score in a multi-channel exper - iment. Meanwhile, it marked an increase of 23% in a multi-modal experiment. According to these results, it is interesting to add other features to better predict de- pression. Deep and handcrafted features are comple- mentary . As more features are added to the high-level MFCC, the model gathers more information about signs of depression. It gains more identification kno wledge. Adding more acoustic features increases performances by 10% but the computational complexity increases. Extracting more features increases the prediction time cost. Adding visual features increases performances by 20%, yet, it would be intrusive and in vasi ve to the pa- tients. Therefore, the application in real-time becomes more di ffi cult and incon venient. 5. Conclusion and future works In this study , an MFCC-based Recurrent Neural Net- work is proposed to detect depression and to assess its sev erity lev els. The audio recordings are preprocessed and the MFCC features are then extracted and normal- ized. The MFCC coe ffi cients are fed to deep recurrent neural network of successi ve LSTM layers. T o over - come the lack of training data and o verfitting problems, two approaches are considered: augmenting the train- ing data and transferring knowledge from another re- lated task. The proposed architecture is ev aluated on the D AIC-WOZ corpus and promising results are achie ved. For the future work, we plan to add a gender recogni- tion step and to balance data classes in the proposed framew ork. A web-application could be also designed to automatically diagnose clinical depression without any medical assistance. References References [1] P . E. Greenberg, A.-A. F ournier, T . Sisitsky , C. T . Pike, R. C. Kessler , The economic b urden of adults with major depressive disorder in the united states (2005 and 2010), The Journal of clinical psychiatry 76 (2) (2015) 155–162. 13 [2] A. J. Mitchell, A. V aze, S. Rao, Clinical diagnosis of depression in primary care: a meta-analysis, The Lancet 374 (9690) (2009) 609–619. [3] F . Dornaika, B. Raducanu, Inferring facial expressions from videos: T ool and application, Signal Processing: Image Com- munication 22 (9) (2007) 769–784. [4] P . W ilkins, T . Adamek, N. E. Oconnor , A. F . Smeaton, Inex- pensiv e fusion methods for enhancing feature detection, Signal Processing: Image Communication 22 (7-8) (2007) 635–650. [5] S. Scherer , G. M. Lucas, J. Gratch, A. S. Rizzo, L.-P . Morency , Self-reported symptoms of depression and ptsd are associated with reduced vowel space in screening intervie ws, IEEE Trans- actions on A ff ectiv e Computing (1) (2015) 59–73. [6] J. R. Williamson, E. Godoy , M. Cha, A. Schwarzentruber , P . Khorrami, Y . Gwon, H.-T . Kung, C. Dagli, T . F . Quatieri, Detecting depression using vocal, facial and semantic commu- nication cues, in: Proceedings of the 6th International W orkshop on Audio / V isual Emotion Challenge, ACM, 2016, pp. 11–18. [7] L. Y ang, H. Sahli, X. Xia, E. Pei, M. C. Oveneke, D. Jiang, Hy- brid depression classification and estimation from audio video and text information, in: Proceedings of the 7th Annual W ork- shop on Audio / V isual Emotion Challenge, ACM, 2017, pp. 45– 51. [8] M. V alstar, J. Gratch, B. Schuller , F . Ringev al, D. Lalanne, M. T orres T orres, S. Scherer, G. Stratou, R. Cowie, M. Pan- tic, A vec 2016: Depression, mood, and emotion recognition workshop and challenge, in: Proceedings of the 6th international workshop on audio / visual emotion challenge, A CM, 2016, pp. 3–10. [9] P . Lopez-Otero, L. Dacia-Fernandez, C. Garcia-Mateo, A study of acoustic features for depression detection, in: 2nd Interna- tional W orkshop on Biometrics and Forensics, IEEE, 2014, pp. 1–6. [10] N. Cummins, J. Epps, M. Breakspear, R. Goecke, An in vesti- gation of depressed speech detection: Features and normaliza- tion, in: T welfth Annual Conference of the International Speech Communication Association, 2011. [11] V . T iwari, Mfcc and its applications in speaker recognition, In- ternational journal on emerging technologies 1 (1) (2010) 19– 22. [12] X. Ma, H. Y ang, Q. Chen, D. Huang, Y . W ang, Depaudionet: An e ffi cient deep model for audio based depression classifica- tion, in: Proceedings of the 6th International W orkshop on Au- dio / V isual Emotion Challenge, ACM, 2016, pp. 35–42. [13] A. Pampouchidou, P . Simos, K. Marias, F . Meriaudeau, F . Y ang, M. Pediaditis, M. Tsiknakis, Automatic assessment of depres- sion based on visual cues: A systematic re view , IEEE T ransac- tions on A ff ectiv e Computing (2017). [14] F . Ringev al, B. Schuller, M. V alstar, R. Cowie, H. Kaya, M. Schmitt, S. Amiriparian, N. Cummins, D. Lalanne, A. Michaud, et al., A vec 2018 workshop and challenge: Bipolar disorder and cross-cultural a ff ect recognition, in: Proceedings of the 2018 on Audio / V isual Emotion Challenge and W orkshop, A CM, 2018, pp. 3–13. [15] A. Pampouchidou, O. Simantiraki, C.-M. V azakopoulou, K. Marias, P . Simos, Y . Fan, F . Meriaudeau, M. Tsiknakis, D ´ etection de la d ´ epression par lanalyse de la g ´ eom ´ etrie faciale et de la parole, GRETSI, 2017. [16] H. Jiang, B. Hu, Z. Liu, L. Y an, T . W ang, F . Liu, H. Kang, X. Li, In vestigation of di ff erent speech types and emotions for detect- ing depression using di ff erent classifiers, Speech Communica- tion 90 (2017) 39–46. [17] L.-S. A. Low , N. C. Maddage, M. Lech, L. B. Sheeber , N. B. Allen, Detection of clinical depression in adolescents speech during family interactions, IEEE T ransactions on Biomedical Engineering 58 (3) (2010) 574–586. [18] H. Jiang, B. Hu, Z. Liu, G. W ang, L. Zhang, X. Li, H. Kang, De- tecting depression using an ensemble logistic regression model based on multiple speech features, Computational and mathe- matical methods in medicine 2018 (2018). [19] F . Ringeval, B. Schuller, M. V alstar, R. Cowie, M. Pantic, A vec 2015: The 5th international audio / visual emotion challenge and workshop, in: Proceedings of the 23rd ACM international con- ference on Multimedia, A CM, 2015, pp. 1335–1336. [20] S. Algho winem, R. Goecke, M. W agner , J. Epps, T . Gedeon, M. Breakspear, G. Parker , A comparati ve study of di ff erent clas- sifiers for detecting depression from spontaneous speech, in: 2013 IEEE International Conference on Acoustics, Speech and Signal Processing, IEEE, 2013, pp. 8022–8026. [21] F . Ringeval, B. Schuller, M. V alstar , J. Gratch, R. Cowie, S. Scherer , S. Mozgai, N. Cummins, M. Schmitt, M. Pantic, A vec 2017: Real-life depression, and a ff ect recognition work- shop and challenge, in: Proceedings of the 7th Annual W ork- shop on Audio / V isual Emotion Challenge, A CM, 2017, pp. 3–9. [22] M. V alstar , B. Schuller , K. Smith, F . Eyben, B. Jiang, S. Bi- lakhia, S. Schnieder , R. Cowie, M. Pantic, A vec 2013: the con- tinuous audio / visual emotion and depression recognition chal- lenge, in: Proceedings of the 3rd A CM international workshop on Audio / visual emotion challenge, A CM, 2013, pp. 3–10. [23] G. T rigeorgis, F . Ringev al, R. Brueckner , E. Marchi, M. A. Nicolaou, B. Schuller, S. Zafeiriou, Adieu features? end-to-end speech emotion recognition using a deep convolutional recurrent network, in: 2016 IEEE international conference on acoustics, speech and signal processing (ICASSP), IEEE, 2016, pp. 5200– 5204. [24] L. Y ang, D. Jiang, X. Xia, E. Pei, M. C. Oveneke, H. Sahli, Mul- timodal measurement of depression using deep learning models, in: Proceedings of the 7th Annual W orkshop on Audio / V isual Emotion Challenge, A CM, 2017, pp. 53–59. [25] P . V . Janse, S. Magre, P . Kurzekar , R. Deshmukh, A compara- tiv e study between mfcc and dwt feature extraction technique, International Journal of Engineering Research and T echnology 3 (1) (2014) 3124–3127. [26] J. Gratch, R. Artstein, G. M. Lucas, G. Stratou, S. Scherer, A. Nazarian, R. W ood, J. Boberg, D. DeV ault, S. Marsella, et al., The distress analysis intervie w corpus of human and computer interviews., in: LREC, Citeseer, 2014, pp. 3123–3128. [27] S. R. Livingstone, F . A. Russo, The ryerson audio-visual database of emotional speech and song (ra vdess): A dynamic, multimodal set of facial and vocal expressions in north ameri- can english, PloS one 13 (5) (2018) e0196391. [28] X. Ouyang, S. Kawaai, E. G. H. Goh, S. Shen, W . Ding, H. Ming, D.-Y . Huang, Audio-visual emotion recognition using deep transfer learning and multiple temporal models, in: Pro- ceedings of the 19th A CM International Conference on Multi- modal Interaction, A CM, 2017, pp. 577–582. [29] T . Atalay , D. A yata, Y . Y aslan, Comparison of feature selection methods in voice based emotion recognition systems, in: 2018 26th Signal Processing and Communications Applications Con- ference (SIU), IEEE, 2018, pp. 1–4. [30] H. X. Pham, Y . W ang, V . Pavlo vic, End-to-end learning for 3d facial animation from speech, in: Proceedings of the 2018 on In- ternational Conference on Multimodal Interaction, ACM, 2018, pp. 361–365. [31] M. V alstar, B. W . Schuller , J. Krajewski, R. Co wie, M. Pantic, A vec 2014: the 4th international audio / visual emotion challenge and workshop, in: Proceedings of the 22nd ACM international conference on Multimedia, A CM, 2014, pp. 1243–1244. 14
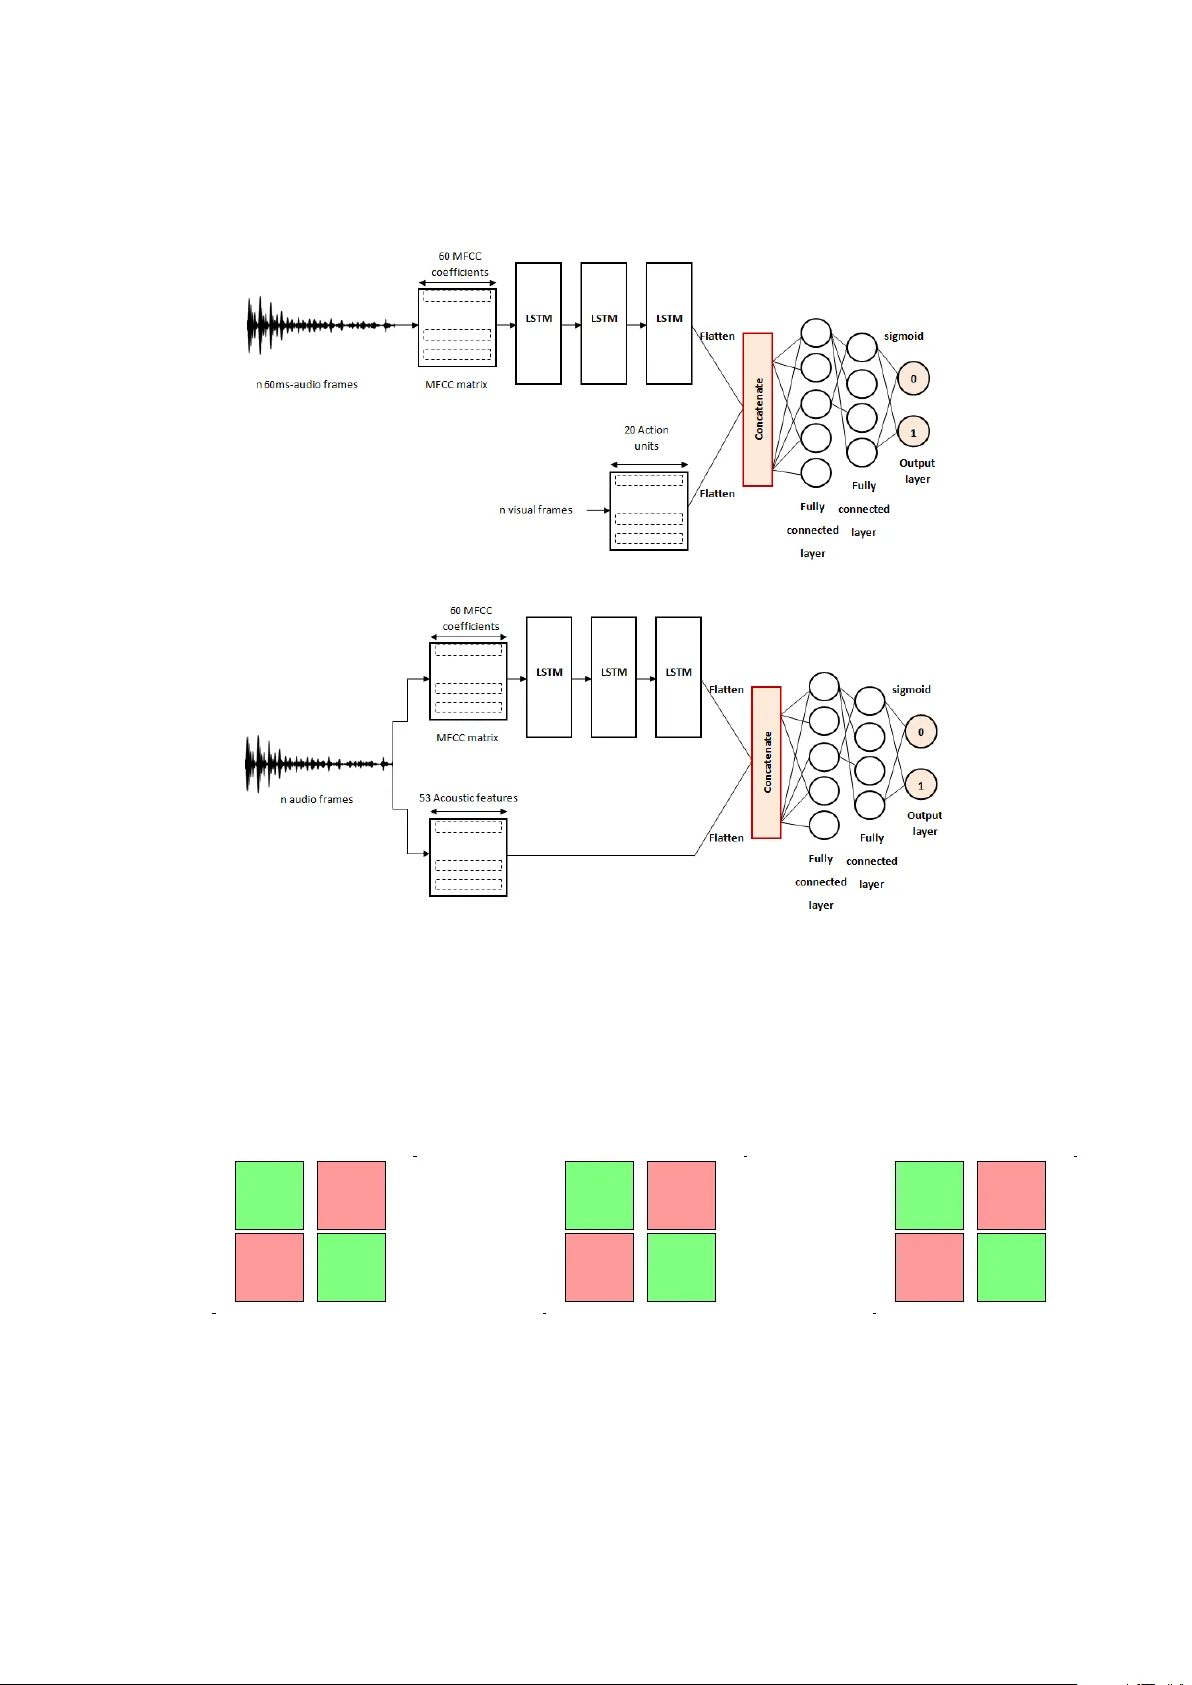
Original Paper
Loading high-quality paper...
Comments & Academic Discussion
Loading comments...
Leave a Comment