DeCaf: Diagnosing and Triaging Performance Issues in Large-Scale Cloud Services
Large scale cloud services use Key Performance Indicators (KPIs) for tracking and monitoring performance. They usually have Service Level Objectives (SLOs) baked into the customer agreements which are tied to these KPIs. Dependency failures, code bug…
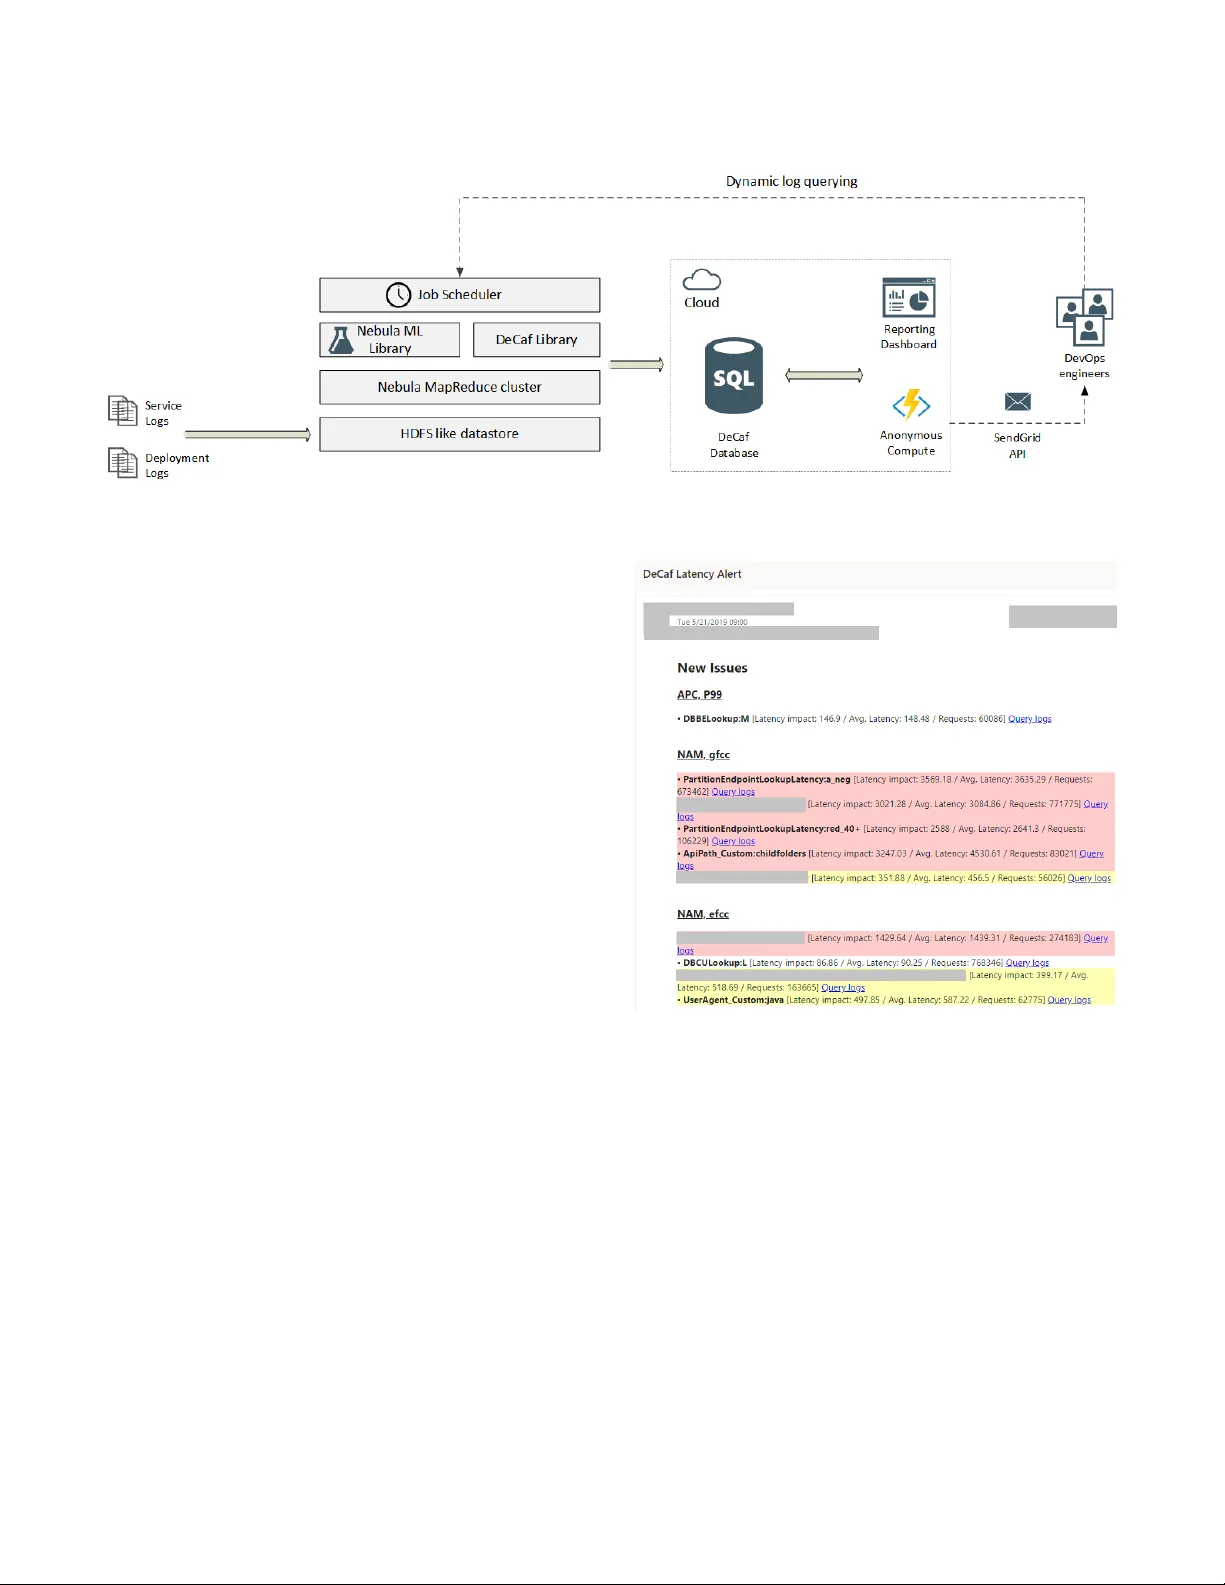
Authors: Chetan Bansal, Sundararajan Renganathan, Ashima Asudani
DeCaf: Diagnosing and T riaging Performance Issues in Large-Scale Cloud Ser vices Chetan Bansal chetanb@microsoft.com Microsoft Research Redmond, W A, USA Sundararajan Renganathan* rsundararajan20@gmail.com Stanford University Stanford, CA, USA Ashima A sudani, Olivier Midy ashimaa, olmidy@microsoft.com Microsoft Redmond, W A, USA Mathru Janakiraman* mathruj@gmail.com Amazon Seattle, W A, USA ABSTRA CT Large scale cloud services use K ey Performance Indicators (KPIs) for tracking and monitoring performance. They usually have Ser- vice Level Objectives (SLOs) baked into the customer agreements which are tied to these KPIs. Dependency failures, code bugs, in- frastructure failures, and other problems can cause p erformance regressions. It is critical to minimize the time and manual eort in diagnosing and triaging such issues to reduce customer impact. Large volume of logs and mixe d type of attributes (categorical, continuous) in the logs makes diagnosis of regressions non-trivial. In this paper , we present the design, implementation and experi- ence from building and deploying DeCaf, a system for automated diagnosis and triaging of KPI issues using service logs. It uses ma- chine learning along with pattern mining to help service owners automatically root cause and triage performance issues. W e present the learnings and results from case studies on two large scale cloud services in Microsoft where DeCaf successfully diagnosed 10 known and 31 unknown issues. DeCaf also automatically triages the iden- tied issues by leveraging historical data. Our key insights are that for any such diagnosis tool to be eective in practice, it should a) scale to large volumes of ser vice logs and attributes, b) support dierent types of KPIs and ranking functions, c) b e integrated into the DevOps processes. KEY W ORDS performance analysis, root causing, machine learning, issue triag- ing, cloud services A CM Reference Format: Chetan Bansal, Sundararajan Renganathan*, Ashima A sudani, Olivier Midy, and Mathru Janakiraman*. 2020. DeCaf: Diagnosing and Triaging Perfor- mance Issues in Large-Scale Cloud Ser vices. In Software Engineering in *W ork done while at Microsoft. Permission to make digital or hard copies of all or part of this work for personal or classroom use is granted without fee provided that copies are not made or distributed for prot or commercial advantage and that copies bear this notice and the full citation on the rst page. Copyrights for components of this work owned by others than the author(s) must be honor ed. Abstracting with credit is permitted. T o copy otherwise, or republish, to post on servers or to r edistribute to lists, requires prior specic permission and /or a fee. Request permissions from permissions@acm.org. ICSE-SEIP ’20, May 23–29, 2020, Seoul, Republic of Korea © 2020 Copyright held by the owner/author(s). Publication rights licensed to A CM. ACM ISBN 978-1-4503-7123-0/20/05. . . $15.00 https://doi.org/10.1145/3377813.3381353 Practice (ICSE-SEIP ’20), May 23–29, 2020, Seoul, Republic of Korea. ACM, New Y ork, NY, USA, 10 pages. https://doi.org/10.1145/3377813.3381353 1 IN TRODUCTION The move from boxed software to cloud services has changed how these products are built and deployed. It has simplied critical aspects of softwar e development like shipping updates and compat- ibility with client hardware. This has also introduced a new role of DevOps where the service owners are responsible and accountable for meeting Service Level Objectives (SLOs) on K ey Performance Indicators (KPIs). Large scale cloud services companies like Ama- zon, Facebook, Google and Microsoft have 100s of cloud services powering consumer and enterprise apps and websites. These cloud services use KPIs like latency , failure rate, availability , uptime, etc. to continuously monitor service health and user satisfaction. For a lot of commercial services, meeting SLOs with respe ct to these KPIs is often baked into the customer contracts and tied to service revenue . For instance, Amazon A WS Compute gives 10% service credit if uptime is less than 99.99% and 30% ser vice credit if uptime is less than 99.0% [ 2 ]. There can also be indirect impact of r egres- sions in performance, for instance, a 400 ms increase in latency causes about 0.5% drop in Google search volume [16]. Root causing and diagnosing performance issues in distributed systems is a well studie d problem in the Systems and Software Engineering communities. Existing work on log based performance diagnosis for services mainly relies on either anomaly detection [ 15 , 19 ] or association rule mining based methods [ 6 , 33 ]. Howe ver , DeCaf is not comparable to these methods because of several rea- sons. Anomaly detection methods cannot scale to high dimensional and high cardinality data. For instance, [ 15 , 19 ] have used anomaly detection on 100 numerical counters, while we have applied De- Caf on data with categorical attributes with up to 1M cardinality . Similarly , association rule mining based methods are not applicable to data with continuous attributes and KPIs, for instance , latency . Also, high dimensional and cardinality data will lead to a combina- torial explosion. Further , anomaly detection based metho ds also fail to detect pre-existing performance issues. W e designed and built DeCaf with these limitations in mind. It is an end-to-end system for diagnosing and triaging performance issues in large scale ser vices. W e deployed and integrated it into the Dev Ops processes for 2 large scale cloud services in Microsoft, where it was able to successfully diagnose 31 unknown issues. ICSE-SEIP ’20, May 23–29, 2020, Seoul, Republic of Korea Chetan Bansal, Sundararajan Renganathan, Ashima Asudani, Olivier Midy , and Mathru Janakiraman Contributions : In this work, we designed and implemented DeCaf, a generic system for automated diagnosis and triaging of KPI issues. Figure 1 shows the overall workow of DeCaf. Using existing ser vice logs, it is able to diagnose known and unknown issues in 2 large scale ser vices r esulting in signicant time savings and minimizing customer impact. It is also able to handle large volumes and large cardinality of logs as well as dierent types of KPIs. Lastly , it builds a knowledge base of results over time and can automatically triage newly detected issues. W e share the results and learnings from deploying and evaluating DeCaf on 2 cloud services in Microsoft. W e make the following contributions in this paper: (1) W e propose DeCaf, an end-to-end system for automatic diagnosis and triaging of performance issues in large scale cloud services from service logs. (2) It introduces a novel approach which combines machine learning and pattern mining for diagnosing and triaging dier ent types of KPI issues from large volume and high cardinality logs. (3) W e have integrated DeCaf into the DevOps processes of Microsoft starting from data collection to reporting and alerting De vOps engineers. (4) W e have deplo yed DeCaf on 2 large cloud scale services in Mi- crosoft. The results conrm the usefulness of the system b oth in terms of diagnosing 41 known and unknown performance issues and, also, signicantly reducing the manual eort in diagnosing performance issues. The rest of the pap er is organized into following se ctions: In Section 2, we discuss the challenges in diagnosing and triaging of perfor- mance issues in large scale services. In Section 3, we discuss the related work. W e pro vide an overview of the DeCaf system in Sec- tion 4. In Section 5, we describe our approach in detail. In Section 6, we describe the implementation details. In Se ction 7, w e present the results from case studies on 2 large scale cloud services in Mi- crosoft. In Section 8, we do an experimental evaluation of DeCaf for accuracy and runtime performance. W e discuss the applicability along with future work in Section 9. Finally , we conclude with a summary in Section 10. 2 CHALLENGES In Microsoft, we op erate O(100) external cloud ser vices power- ing several collaboration and cloud compute services running on O(100K) servers with O(10K) developers che cking in code every week. This results in a huge amount of code, dependency and in- frastructure churn which can lead to various kind of performance regressions. Diagnosing such issues using existing techniques is not only time consuming but also requires custom dashb oar ds and manual investigations. Moreov er , there could be important issues which are left undiscovered, as we show in our case studies. W e studied several large scale cloud services in Microsoft and made the following observations regarding the diagnostic practices and challenges: (1) Logging : These services log key request attributes and metrics. The attributes are of mixed types (categorical, continuous) and contain both structur ed and unstructur ed information. Attributes which are useful for monitoring and large-scale diagnosis (such as backend ser ver , component latencies, etc.) are logged in a structured manner . Information like exception stack traces used for diagnosing request level pr oblems are serialized and logged in an unstructured format. These services produce massive vol- umes of logs, up to O(1TB) per hour . So, the logs are aggregated periodically and stored in a central HDFS like massive data store with a Hadoop like map reduce system for data analytics. (2) Performance regressions : Performance degradation can be due to various reasons, such as code bugs, infrastructure fail- ure or overload, design gaps and dependency failures. These can also be local or global depending on various factors such as the root cause, deployment scope, etc. For instance, a har dware fail- ure in a data center can increase the load on the other servers, degrading the request latency for that data center . Similarly , a thread contention bug can impact the performance of the entire service. (3) Diagnosis : DevOps engineers usually do performance diagnosis for two purposes: (a) Reactive : T o resolve an issue discov ered through active moni- toring or customer complaints. (b) Proactive : T o proactively improve the ser vice performance and address performance gaps / bugs in the current codebase. For both proactive and reactive diagnosis, the service owners use custom KPI dashboards and the logs. Based on the issue , DevOps engineers might use the dashboard to manually narrow down the scope of the regression. Subsequently , they run custom queries to extract the request logs and, also, determine the impact of the issue. Sometimes, the diagnosis can also require additional logging or gathering performance counters from other sources. Challenges : W e made the following key observations about the challenges faced in diagnosing p erformance issues in large scale cloud services: (1) Triaging - Triaging is the process of prioritizing and determining which issue should be investigated and subse quently xed. This is critical since it can take anywhere from hours to days to root cause and x an issue . DevOps engineers consider various factors while triaging issues: (a) What is the impact of the issue? How many customers or requests are being impacted? (b) Is the issue localized or global? (c) Is it a known issue? If y es, has the impact increased? (d) Has this issue occurred in the past? Triaging performance issues is non-trivial b ecause engineers have to estimate the scope and impact of issues by taking into account historical data. (2) V olume of logs - A large scale service can generate anywhere from gigabytes to 100s of terabytes of logs every day . Manual querying and processing of logs for root causing issues is not scalable. Also, it is very expensive in terms of time and space to load such large amount of data in tools like Excel or in an SQL database. (3) High cardinality attributes - Log attributes from large scale services usually have high cardinality , making it infeasible to manually explore various combinations for root causing issues. For instance, in the Orion service, which is one of the case studies for DeCaf, there ar e more than O(1M) organizations. The KPIs can regress for a subset of these organizations which makes it DeCaf: Diagnosing and Triaging Performance Issues in Large-Scale Cloud Services ICSE-SEIP ’20, May 23–29, 2020, Seoul, Republic of Korea Figure 1: Diagnosis and triaging workow in DeCaf Attribute T ype Cardinality Organization Categorical ~1M Server Categorical ~10K ApiPath Categorical ~1K AppCategory Categorical ~10 AppId Categorical ~100 CapacityUnit Categorical ~100 User Agent Categorical ~100 DataCenter T arget Categorical ~10 DataCenterOrigin Categorical ~10 Forest Categorical ~10 UserCategory Categorical ~10 BuildV ersion Categorical ~10 UserCache L1 Latency Continuous - L2 Cache Latency Continuous - LoadBalancer Latency Continuous - A uth Latency Continuous - T able 1: Sample attributes from the Orion logs important to include such high cardinality data in diagnosing regressions. In T able 1, w e list the typ e of cardinality of the some of the attributes from the Orion logs. (4) Mixed attributes and KPI lab els - Logs can contain both cate- gorical and continuous features. For instance, in the Orion ser vice logs, we have both categorical featur es like backend, front end machines, and continuous features like sub-component latencies. Similarly , the log attributes for KPIs can also be categorical and continuous. While latency is a continuous metric, request status is a binary categorical variable (success or fail). (5) Interpretability - It is easier for DevOps engineers to investi- gate issues if the scope, performance impact and historical data is provided. One of the key insights which enable d us to successfully deploy DeCaf to multiple services within Microsoft is to make the results interpretable both quantitatively and qualitatively . 3 RELA TED WORK Leveraging machine learning techniques to perform diagnostics on service logs has be en the focus of much research over the past couple of decades [ 5 , 9 , 34 ]. Bodik et. al [ 5 ] rely on anomaly signa- tures of known issues along with regression models for diagnosing failures in data centers. Chen et. al [ 9 ], use classication trees to root cause failure rates in a large internet website like eBay . Co- hen et. al [ 10 ] use Tree- Augmented Bayesian Netw orks to identify combinations of system level metrics which are correlated with non-compliance of SLOs. Nair et. al [ 24 ] using hierarchical detectors with time series anomaly dete ction to diagnose issues. A combi- nation of clustering and anomaly detection techniques for root causing has also been proposed [ 12 , 14 ]. Howev er , these methods are not feasible for high cardinality data. W e distinguish our work by proposing a simple end-to-end system which can a) handle het- erogeneous and high cardinality O(1M) data, b) diagnose dierent types of KPIs, c) can automatically rank and triage the discovered issues, d) detect previously unknown issues. A lot of prior work has also focuse d on analyzing raw service logs to extract meaningful ev ents and diagnose abnormal system behavior . Xu et. al [ 32 ] jointly analyze source code and console logs to extract features and perform anomaly detecting on these feature collections. Deeplog [ 11 ] mo dels the sequence of events producing log les using LSTMs and constructs w orkows to aid in root causing when it is inferred that the log patterns have de- viated from the trained model. LogCluster [ 29 ] groups together log messages to construct representative log sequences thereby as- sisting engineers in diagnosing failures. Distalyzer [ 23 ] consumes two sets of logs, one with good performance and one with bad performance to extract systems behaviors that diverge the most across the two sets of logs and are correlated with bad system per- formance. AUDIT [ 22 ] takes a slightly orthogonal path by setting up lightweight triggers to identify the rst instance of a problem and then uses blame-proportional logging to when the problem reoccurs. Zawaw y et. al [ 35 ] propose a log reduction framework which lters and interprets a subset of streaming log data in order to p erform root cause analysis. In this work, we diagnose issues by using existing structured data logged by cloud services. It is a reasonable constraint to work under be cause most large-scale services log structured data to simplify monitoring, debugging and analytics. The empirical software engineering community has done a lot of work on automated bug triaging and characterization. Tian et al. [ 28 ] and Alenezi et al. [ 1 ] use textual features from bug reports for identication of duplicate bug reports. Xia et al. [ 30 ] uses topic modelling to assign the bug re-ports to the appropriate developer . Lamkan et al. [ 20 ] extract textual featur es from the bug r eports to ICSE-SEIP ’20, May 23–29, 2020, Seoul, Republic of Korea Chetan Bansal, Sundararajan Renganathan, Ashima Asudani, Olivier Midy , and Mathru Janakiraman predict the severity of the bug reports to assist in triaging. These techniques are complementary to DeCaf since they are applicable only after a detailed bug report has been led in the bug tracker . T o the best of our knowledge, DeCaf is the rst end-to-end system which uses historical results for triaging the issues. 4 O VERVIEW One of the major guiding principles while designing DeCaf was to build a generic system using simple interpretable techniques so that ser vice owners can themselves own and deploy DeCaf. W e have deployed DeCaf to two large scale services in Microsoft, Orion and Domino (name changed): (1) Orion - Orion is a stateless routing ser vice that pr oxies requests to the correct backend / mailbox server (the one hosting the user’s active mailbox database). It handles ab out O(100B) requests e very day and logs about O(100) attributes per request, generating O(100) terabytes of logs daily . Request latency is a key metric in Orion which impacts the latency of all clients. (2) Domino - Domino is a global scale internet measurement plat- form built for one of the major cloud providers. It is designe d to perform client-to-cloud path measurement from users around the world to the rst-party and third-party endpoints. Failure rate is one of the KPIs for Domino since it is tie d to service availability . Goal : With DeCaf, our goal was to build a system which can auto- matically help the DevOps engineers narrow down a performance regression to a subset of requests. So, for each identied issue, it outputs a r oot-cause which consist of a set of predicates along with impact metrics and a triage category . These predicates help narrow down a regression to a subset of log r ows and columns which can then be further used for mitigation of the issue. A predicate is a boolean valued function dene d as: P ( X ) → { t r ue , f al s e } (1) Predicates can be dened for both continuous and categorical log attributes, for example: A ut h L at enc y > 50 ms → { t r ue , f al s e } (2) Re д i on = N or t hA mer i c a → { t r ue , f al s e } (3) A DeCaf result consists of the following data: • Correlated predicate : Predicate correlated with performance regression. • Scope predicates : Predicates which dene the scope of the r e- gression. • Count of impacted requests in sampled data. • Performance impact : Impact on the KPI. • Triage result (r) : r ∈ {new , existing, regressed, improved, re- solved} Example : T o better understand the problem and the goals, here is an actual incident from the Orion service which was r oot caused using DeCaf: In the Orion service, DeCaf discovered a latency r egression in the AN150C01 server rack which was causing 90,000% higher latency than SLO for requests from o box requests. On investigation, it was root caused to an auth component which was not b eing logge d and was causing timeouts and errors. It was impacting the latency of ~1 Billion requests worldwide daily . Here is the output of DeCaf from this incident: • Correlated predicate : Rack:AN150C01 • Scope predicates : {RequestT ype:O box ∧ LocDataCenter:AN ∧ CrossDataCenter:true} • Requests impacted : ~1 Billion • Latency impact : 4419ms • Triage result : new 5 OUR APPROA CH In this section, we describe the details of DeCaf, which consists of 4 major steps: data preparation from the raw service logs, training of ML models, rule extraction from the learnt models and triaging of issues based on historical data. Out of these 4 steps, only the data preparation and model training steps require one time manual eort while deploying DeCaf for the rst time. 5.1 Data preparation Data sampling and feature sele ction is key to any machine learning or data-mining based system. Cloud services can generate 100s of terabytes of data every day and log hundreds of attributes. This makes any manual or automate d analysis challenging b oth in terms of space and time. T o solve this problem, we lev erage data sampling and feature selection. 5.1.1 Data pre-processing . Often the ser vice logs are distributed across multiple data streams. For instance, dierent components of a service can write logs to dierent data stores while logging a distinct correlation Id per request to help join the logs at a later stage. So, as a one time step, ser vice owners write queries for aggre- gating / joining data from various streams/sources. Similarly , often the data is serialized while b eing logged, so, we also de-serialize the data into a structured schema. T o handle missing values, we replace any missing value in categorical attributes by a placeholder ("") while for continuous attributes we use the median value. 5.1.2 Feature selection . Not all features present in the service logs are useful for root causing issues. For instance , features such as Request Id or Correlation Id which uniquely identies individ- ual rows are not useful in root causing widespread issues. These features can also have very high cardinality and can cause state explosion. T o be able to select the right features, we follow a hybrid approach: • DeCaf automatically classies features into continuous and cat- egorical types and measures the cardinality of the categorical variables. It provides recommendations for pruning the high cardinality features. • Service owners further prune the featur es based on their domain knowledge and the recommendations provided by DeCaf. 5.1.3 Stratification . Stratication is the process of dividing the data into mutually exclusive, homogeneous and collectively exhaus- tive subsets or classes. While it is possible to have multiple classes in stratication, we only consider binary classes in this work since DeCaf: Diagnosing and Triaging Performance Issues in Large-Scale Cloud Services ICSE-SEIP ’20, May 23–29, 2020, Seoul, Republic of Korea it supports diagnosis of all the KPIs we hav e seen in practice. W e divide the service requests into two classes: (1) Positive: Requests showing anomalous behavior or violating the performance SLO for the KPIs. (2) Negative: Requests which meet the KPI SLOs. The stratication criteria is determined by the SLO and is an input to DeCaf. For instance, in Orion, based on the latency SLO of the service, the criteria is: C = ( pos it i v e , R e que st Lat enc y > 5 ms , ne д at i v e , Re q u es t Lat enc y ≤ 5 ms . (4) 5.1.4 Sampling . The Orion and Domino services generate more than 100 terabytes and 10 terabytes of logs every day , respe ctiv ely . Using all this data will r esult in performance bottlenecks both in runtime and computational resources. There are se veral dierent statistical methods of sampling data: random sampling, systematic sampling, stratied sampling, cluster sampling, etc. In this work, we considered random and stratied sampling of data: • Random sampling : Data is randomly selected from the entire population. • Stratied sampling : Data from the positive and negative sub- sets is randomly sampled separately within each of the strata. W e selected the sampling method base d on tw o empirical obser va- tions: (1) Class imbalance : Most pr oduction services operate within SLO requirements most of the time. For instance , we observed only 0.1% requests missing the SLO in Orion. (2) T arget variable : Percentage metrics like failure rate are com- puted on the entire population, so, we do random sampling of data for such metrics. For absolute metrics like r equest latency , we use stratied sampling. Also, sampling the data improves eciency in terms of runtime and compute resources. 5.2 ML mo del training Random forest models [ 7 ] have been eectively utilized for various tasks such as image processing [ 27 ], churn prediction [ 31 ], intru- sion detection [ 13 ]. In DeCaf, we use Random Forest models for learning predicates which correlate with performance issues. It is an ensemble machine learning method for classication and regres- sion that op erates by constructing a multitude of decision trees [ 26 ]. For training the models, we use the KPI (latency , failure) as the target labels and the rest of the log attributes as the features or independent variables. Also, unlike conv entional machine learning, we do not use the trained models for prediction since the goal is not to predict the KPI for futur e service requests. DeCaf analyzes the trained mo dels to extract predicates which can help localize performance regressions. Decision trees : A decision tree consists of a set of split and leaf nodes where each node is dened by a predicate. Essentially , decision trees are a hierarchy of nodes in the form of a tr ee. Deci- sion trees can be used for both categorical and continuous target variables. If the target variable is categorical, classication trees are used; if it is continuous, regression trees are used. Both clas- sication and regression trees follow similar pr ocess for training. At each training step, the best predicate is selecte d for partitioning the data and this process is repeated. The splitting criteria varies between classication and regression trees. Classication trees : Classication trees are use d to predict categorical target variables (for instance, weather-outlook: rain or sunny). At the training time, classication trees maximize the information gain at each split by reducing the entropy of the parti- tioned data after the split. Information gain when the tr ee is split on attribute A i is dened as: I G ( S , A j ) = H ( S ) − Õ A i ∈ A | A i | S H ( A i ) , (5) where H(S), the entropy of set S, is dened as: H ( S ) = − Õ c ∈ C p c l o д 2 p c , (6) where p c is the probability of S for the class c. Regression trees : Regression trees are used to predict continu- ous variables, for instance , temperature or age. Unlike classication trees, instead of maximizing information gain, regression trees minimize the mean squared error (MSE) at each split: M S E = 1 n n Õ i = 1 ( y i − ˆ y i ) 2 , (7) where y i is the actual value of the target variable and ˆ y i is the predicted value. W e use random forest ML models in DeCaf for sev eral reasons: (1) It is one of the few classes of models that can support not only continuous and categorical features but also continuous and categorical target variables. (2) It is one of the most interpretable machine learning models [ 18 ]. (3) It is highly scalable both in terms of feature cardinality and data volume. Also , it is easily parallelizable on a MapReduce systems like Hadoop and Spark [8, 17, 21]. (4) As we evaluate in Section 6, it is less prone to overtting and perform better than the decision tree baseline. The feature sam- pling ensures that strong predictive attributes in the data do not dominate all the trees. Random forest mo dels, like other machine learning models, have several hyper-parameters which can be tuned to improv e the pre- diction accuracy and runtime performance. Much w ork has been done to analyze the impact of the hyper-parameters on prediction accuracy [3, 4]. Howev er , in this work, instead of using the model for prediction, we use the trained models for extracting rules for diagnosis of KPI regressions. Based on empirical experiments, w e found the following hyper-parameters to be useful: (1) Min rows in leav es: Species the minimum number of training data in a leaf to avoid ov ertting. If a leaf node contains less than this threshold, it will not continue to split the training data. The tree will stop growing on that leaf. This helps reduce the noise by eliminating rules which impact very small number of requests. Based on the discussion with the Orion and Domino teams, this was set to 1% of the log size. (2) Feature sample ratio: Species the sampling ratio used for sam- pling features when learning each tree. Setting the sampling ratio ICSE-SEIP ’20, May 23–29, 2020, Seoul, Republic of Korea Chetan Bansal, Sundararajan Renganathan, Ashima Asudani, Olivier Midy , and Mathru Janakiraman to 1 will cause all trees in the forest to b e identical. Base d, on empirical experiments we have set the sampling ratio to 0.6. (3) Number of trees: Numb er of trees to train. This increases the number of unique rules learnt for diagnosis while also increasing the training time. In DeCaf, base d on runtime constraints, we train 50 trees. While onb oar ding a new ser vice to DeCaf, a one time eort will be nee ded to tune the hyper-parameters based on the data schema, size and the compute resources. W e will work on automating this manual step in future work. Model output : After training the random forest model, we get a set of regression or classication trees. W e dump the binar y model into a text-based readable format. Each tree contains a hierarchical partitioned list of predicates starting from the root node to the leaf nodes. For each of the nodes, we also compute the following metrics: (1) Row count: Number of training samples in a node. (2) Anomaly probability (Classication trees): Probability of a train- ing sample belonging to the positive (anomalous) class. (3) Predicted value (Regression trees): A verage value of the target variable for the samples in a node. As we discuss in the ne xt step, these metrics are used for ranking and triaging the results. 5.3 Rule extraction Once the random forest model is trained, we implement a novel algorithm to analyze the model output to produce a ranked list of rules as discussed in Section 4: Step 1 : The random forest model generates a set of decision or regression trees. W e parse the text output of the random forest into an in-memory set of decision tree obje cts and then recursiv ely traverse each tree starting from the root no de . At each node, we compute aggregate scores of the left and the right sub-trees. DeCaf exposes an interface so that the scoring function can be dene d based on the requirements of the service owners using a lambda function. The scoring function takes in as parameters the metrics gener- ated by the random forest model. The scoring function is dened by the service owners based on the SLO. For instance, in case of Orion, the SLO included not just the latency impact but also the number of requests impacted. Here are the scoring functions used in the Orion and Domino deployments: • Orion: Score(row count, pr edicted value) = row count x predicted value • Domino: Score(row count, failure pr obability) = failure probabil- ity Step 2 : For each node predicate in the tree, we then compute a score for performance impact. It is the dierence between the score of the left child node and the right child node, i.e., when the predicate is true vs when it is false: Cor r e l at ionS cor e = S c or e ( Le f t Chi ld ) − S cor e ( Ri д htC hil d ) (8) If the correlation score is positive, that means the predicate (P:X → true) is positively correlated with a performance degradation, otherwise, it is negatively correlated. Step 3 : Using the above algorithm, we extract a set of rules from the random forest model; wher e a rule consists of: ( a) Correlated predicate: predicate of the current node, (b) Scop e predicates: logical conjunction of the predicates from the parent nodes, ( c) Corr elation score and (d) Request count: No . of requests impacted. Step 4 : Next, we de-duplicate the rule set by only keeping the rules with the maximum impact scor e for each correlated predicate. Also, based on the feedback from the service owners, w e remove the rules with negatively correlated predicates as they were not deemed useful by the service teams in root causing. For instance: ClientRegion:NorthAmerica → False only tells us that the client can be anywhere but in North America. While ther e might be cases where negative correlations ar e useful, we have not observed it in practice. 5.4 Triaging The results from the DeCaf algorithm are uploade d to an SQL database which allows us to build a historical knowledge base of all the detected issues. W e leverage this history to automatically triage rules generated by DeCaf into the following categories based on the correlated predicate and the correlation score: (1) New : A new predicate is extracted which has not appeared in the last 14 days. (2) Regressed : Score of the predicate is more than 1 standard de- viation above the mean score computed over the previous 14 days. (3) Known : Score is within 1 standard deviation of the mean scor e computed over the previous 14 days. (4) Improved : Score is at least 1 standard deviation below than the mean score computed over the pre vious 14 days. (5) Resolved : Correlated predicates which were extracted in the previous day are not e xtracted. The regression and history thresholds w ere determined based on inputs from the service owners and empirical validation on 1 month of Orion data. T o avoid the cold start problem, the auto-classication is enabled only once we have a 14 day history . 6 IMPLEMEN T A TION W e have implemented DeCaf using Microsoft Azur e Cloud and a Hadoop like MapReduce cluster in Microsoft for large scale data an- alytics, called Cosmos. The overall architecture of DeCaf is shown in Figure 2. Cosmos supports an SQL like query language for run- ning MapReduce jobs called Scope. W e wrote modules using this query language for the data sampling and model training. Also, we implemented the rule extraction and triaging module using C# (.NET Framework v4.5) and SQL. DeCaf is operationalized in Mi- crosoft both for retrospective analysis, i.e., diagnosing regressions in the past and, also, for near real time analysis where service own- ers root cause ongoing incidents which were caught using alerts or customer complaints. Data ingestion : Large scale cloud ser vices like Orion and Domino generate ~100 TB of logs daily which are initially stored in the local storage of each server . A data loader process runs at schedule d intervals and scrubs the users’ Personally Identiable Information (PII) from these logs and uploads these raw logs to an HDFS like DeCaf: Diagnosing and Triaging Performance Issues in Large-Scale Cloud Services ICSE-SEIP ’20, May 23–29, 2020, Seoul, Republic of Korea Figure 2: DeCaf implementation data store used by Cosmos. These logs ar e then processed by cus- tom MapReduce jobs by the respective service owners for various purposes like analytics, monitoring and debugging. W e use these processed logs in DeCaf. W e run the data ingestion job using a job scheduler for Cosmos called A vocado. A vocado also allows us sp ecify dep endency be- tween various jobs and, also, enables us to visualize the results of the map-reduce tasks using a declarative JavaScript based frontend interface. The cadence depends on the ser vice r equirements, it can be in near real time or at xed time inter vals, like hourly . Sometimes logs from multiple sources might also be aggr egated for diagnostics. For instance, in Orion, we used not only the Orion request logs but also infrastructure logs to be able to root cause performance issues related to infrastructure failures. Model training and analysis : For the Random Forest model training, we use an existing ML library for Cosmos available inter- nally at Microsoft. It implements a distributed version of the CART algorithm for training Random Forest models. Similar distributed implementations are available for MapReduce systems like Hadoop and Spark [8, 17, 21]. W e implemented a custom librar y in C# .NET framework 4.5 for analyzing the random forest model output and generating the ranked list of rules. The librar y uploads the results to a Azure SQL cloud database. The A vocado job for model training and analysis is triggered once the data is ingested. T o avoid having race con- ditions between the data and the model jobs, we have sequential dependency between the two jobs. DevOps integration : T o integrate DeCaf into the DevOps pro- cesses for the Orion and Domino services, we built a web dashboard, shown in Figure 3, which can be used to see the latest and histori- cal results of diagnosis and triaging. Howev er , based on developer feedback, we realized that a push-based notication me chanism is better suited than a pull-based one. Therefore, we also created a notication service which sends email notications with the results using the SendGrid SMTP service. Dynamic query generation : Before DeCaf was deployed, De- vOps engineers had to manually write MapReduce scripts for min- ing the service logs for investigating service incidents. T o reduce Figure 3: DeCaf report for Orion the manual eort, W e implemented dynamic Cosmos MapReduce query generation for the rules generated by DeCaf. Each rule has a "Query Logs" link, as shown in Figure 3, which automatically runs a Cosmos job for mining the logs satisfying that rule. Based on the feedback from the Orion and Domino teams, it has signicantly reduced investigation time and eort for incidents. 7 CASE ST UDIES In this section, we pr esent the results and learnings fr om deploy- ing DeCaf on Orion and Domino. In Orion, we deployed DeCaf in production for 4 months, where the De vOps engineers used it to diagnose and triage issues impacting Orion latency in produc- tion. For Domino, we did a 10-day pilot where DeCaf was used to diagnose high failure rates. ICSE-SEIP ’20, May 23–29, 2020, Seoul, Republic of Korea Chetan Bansal, Sundararajan Renganathan, Ashima Asudani, Olivier Midy , and Mathru Janakiraman No. Corr elated predicate Scope predicates Triage category Issue description 1 CapacityUnit: CX20A1 Region:NorthAmerica ∧ App- Name:AnonymizedApp ∧ LocDat- aCenter:CX2 ∧ CrossDatacenter:True New Gap in telemetry , latency of A uth token extraction was not being logged. 2 RoutingLatency > 568ms Region:NorthAmerica Regression Shard based routing cross process calls to routing service hang in RPC layer 3 UserLookup: L2 Region:AsiaPacic ∧ MailboxCacheLa- tency > 40 ∧ CapacityUnit:Anonymized New Regression in A sia Pacic region due to large no. of requests with cache miss 4 RoutingLatency > 16145ms Forest: FC3 ∧ CapacityUnit:CF5015A Regression Regression in Europe region due to lo ck contention bug in code 5 UserMapping Cache Latency > 132ms UserLookup:L1 ∧ Re- gion:NorthAmerica New High L1 cache latency due to DB page misses and disk IO latency 6 ServerLookup Cache: L2 Forest: F A4 ∧ Region: Europe New Large no. of L1 cache misses for backend server lookup 7 A uthLatency Latency > 47ms AppName:AnonymizedApp ∧ Address- Resolution < 5ms New High latency of requests due to timeout of the auth service T able 2: Some of the unknown issues diagnosed in Orion using DeCaf 7.1 Orion Oce365 is a large commercial collab oration and email ser vice. It employs a horizontal scale-out architecture based on sharding by users across O(100K) servers across the glob e that have both compute and storage capacity . The basic transaction processing model is to take compute as close to the data as possible, often to the very same server . Hence, we need a system to route requests eciently to the specic ser v er where the primary shard targeted by the request is presently activated. Orion is the system that does this smart request routing as the request routing plane. Orion runs on an IIS web ser vice and has multiple dependencies on internal as well as external sub-systems like shared caches, auth components, microservices, databases, etc. It is a massively distributed service that currently sustains a peak throughput of O(1M) requests/second, that target O(1B) shards, provisioned across O(100K) Oce365 servers, spr ead over O(100) data-centers worldwide. Oce365 has 1st party , 2nd party and 3rd party partners. Each of these partners have their own SLOs, and it becomes critical for the routing application layer to resolv e the shard location correctly and route requests with SLO of latency less than RT T (round trip time) + 5ms at the 99th percentile. Befor e a user request lands on its shard ' s lo cation, it gets processed by multiple routing applications like load balancer , network layer and multiple hops in request routing. The goal of using an automated root causing system for Orion was to not only dete ct regr ession but also nd existing bugs and design aws resulting in high latency . Given that Orion ser vice generates O(100TB) of diagnostics data daily , receives O(100B) re- quests per day and logs O(100) request attributes resulting in a cumulative cardinality of O(1M), it becomes challenging to perform root cause analysis on latency regression through manual or tradi- tional methods like big data processing, custom pivot dashboards, etc. Previously , root cause analysis was done manually by running queries on Cosmos as well as by analyzing Pow er BI [ 25 ] reports over aggregated data in a cloud SQL database . V arious limitations prevented Orion dev elopers from diagnosing and investigating la- tency regressions at scale: (1) Reporting limitation of maximum 1 GB data in their custom dashboards. (2) Refresh time out if data is huge which required manual interven- tion. (3) Given there ar e O(100) attributes, it was highly inecient to click through various pivots manually for root causing. Results : W e deployed DeCaf for root causing latency issues in Orion and discuss the results from a deployment done between March 2019 to September 2019. During this p eriod, DeCaf was able to diagnose 9 known and 15 unknown issues. This signicantly reduced the manual analysis overhead while also helping in nding new issues which would not have been detecte d otherwise. T able 2 lists the details of some of the unknown issues discovered in Orion impacting request latency . As p er an analysis done by the Orion engineers, using DeCaf saved them on average 20 hours per inv esti- gation. Previously , most of this time was spent in nding the right predicates manually using dashboards and running MapRe duce queries for validation and analysis. 7.2 Domino Domino is a global scale internet measurement platform built for one of the major cloud pro viders. It is designed to perform client- to-cloud path measurements from users around the world to Mi- crosoft ' s rst-party and third-party endpoints. The metrics it mea- sures includes the availability of and the latency to wards the above mentioned endpoints as seen by end-users spread across the glob e . It is emb edded in a variety of web-client and rich-client applications and p erforms measurements to the endpoints mentioned in the con- guration le that it fetches from a pre-spe cied web location. It is deployed in O(10) web clients and rich clients and monitors O(100) end-points. The user-base performing these measurements is spread across O(10,000) ISPs (mobile and non-mobile) and O(1000) metro areas. The measurement platform generates O(10TB) of data consisting of around O(1B) r equests, per day . Each request contains O(10) attributes with a cumulative cardinality of O(1M). DeCaf: Diagnosing and Triaging Performance Issues in Large-Scale Cloud Services ICSE-SEIP ’20, May 23–29, 2020, Seoul, Republic of Korea Algorithm Precision V alid Issues Baseline 0.66 2 DeCaf 0.72 8 T able 3: DeCaf evaluation Dataset Pre-processing Training Diagnosing Triaging Small 5 min 12 min 0.2 min 0.8 min Large 138 min 102 min 0.3 min 0.6 min T able 4: Runtime comparison of DeCaf stages Failure rate is an important KPI being tracked as it is tied to service availability . It is dened as the number of faile d Domino requests divided by the numb er of attempted requests in each time bucket. The scale and diversity of measurements being performed often resulted in the failure rate behaving in unexpected ways. One such issue was that certain large-scale client networks were facing higher failure rate during day times (in local time for the clients) as compared to night times. T o zone in on the pivots which wer e resulting in increased failur e rates, we applied DeCaf to the Domino data, as the high request volume coupled with the high cardinality of dimensions made manual analysis a problem of nding a needle in the haystack. Results : In a 10-day pilot with Domino, DeCaf found 16 un- known issues and 1 known issue which w ere causing high failure rates. Out of the 16 unknown issues, 11 were related to specic tenants and 5 were related to certain A utonomous Systems (ASs). On further investigation, we found that these faulty tenants and ASs were facing more than 90% failure rates. In addition to this, the fact that they performed more measurements during the day as compared to night times was r esulting in a higher aggregate failur e rate during day times, thereby explaining the initial obser vation. On following up with the respective ser vice owners, we found that these high failure rates were caused by enterprise tenants blocking these endpoints in their rewalls. By ltering out these blocking tenants and ASs, as reported by DeCaf, we could eliminate the incidence of higher failure rate and reduce noise in the data. 8 EXPERIMEN T AL EV ALU A TION For a quantitative evaluation, we compare the performance of DeCaf on 1 day of Domino ser vice logs with the method proposed by Chen et al. [ 9 ], referred to as the baseline . W e used 2 metrics for evaluation: precision and number of valid issues found. The results were manually evaluated by the service owners. Because of lack of ground truth of incidents and corr esponding root causes in the test dataset, we did not evaluate recall. The metrics are dened as: Precision : P r e ci si on = | { T P } | | { T P } | + | { F P } | (9) Number of valid issues : It is the number of valid issues discovered which were impacting performance. | {TP} | . Here, {TP} is the set of correct results (true positives) and {FP} is the set of incorrect results (false positives). As shown in T able 3, the number of valid issues discovered by DeCaf using the Random Forest model was 4x times the baselines. In terms of precision, as we can see in T able 3, DeCaf has 9.1% higher precision than the baseline. Overall, we can see that DeCaf gives signicantly better performance in diagnosing performance issues from service logs. Runtime performance : W e evaluated the runtime performance of the DeCaf system on two datasets fr om the Orion service. The Large dataset contained ~50GB of daily logs with ~45 million rows, 51 attributes and cumulative cardinality of 1.3 million. Whereas, the Small dataset was ~100MB in size, containing ~0.1 million rows. W e did the runtime analysis using the data from the production deployment running in the Cosmos MapReduce cluster . T able 4 shows the runtime of dierent stages of DeCaf. As we can see, data pr e-processing and model training are the most e xpensive task in terms of runtime. The rest of the steps are near real-time with ~1 min runtime. The diagnosing and triaging stages have similar runtime for both the datasets, b ecause these stages do not operate on the raw dataset but the model output and the 14 day historical results. The triaging stage is comparativ ely slower than the diag- nosing stage because of the multiple SQL queries which need to be run in the cloud in order to compare with historical results. 9 DISCUSSION In this section, we rst discuss the generalizability of DeCaf to other services and then discuss some of the future work. 9.1 Generalizability All commercial large scale ser vices have commitments to their customers for meeting SLOs for their KPIs. They also produce large amount of logs and telemetry which makes it prohibitively expensive to root cause and triage any r egression in the KPIs. W e designed and built DeCaf after looking at the requirements and existing DevOps practices of several services within Microsoft. As our case studies show , DeCaf has signicantly reduced the manual eort for the on-call engineers. W e believe , DeCaf solves a common problem which is applicable to almost any large scale service. It can be used to not just diagnose known incidents but also nd existing performance issues b efor e they lead to widespr ead customer impact. Further , to deplo y DeCaf, service owners only need existing domain knowledge about the service logs and a one time manual eort of writing the data aggregation queries and hyper-parameter tuning. 9.2 Future W ork T oday , even though DeCaf can handle heterogeneous attributes, it requires the data to be in a structured format. One of the next steps, will be to automate the transformation of the unstructured logs so that DeCaf can operate directly on the raw data. W e can use unsu- pervise d machine learning techniques to extract key-value pairs for various attributes from the logs. Further , DeCaf currently requires service owners to do feature selection based on domain knowledge. W e believe, this step can be automated based on past incident and root cause knowledge bases. W e can leverage NLP techniques to learn which attributes in the logs are useful. This information can then be surfaced to the service o wners as recommendations if not to completely eliminate the manual eort. Lastly , another interesting direction will be to diagnose multiple KPIs simultaneously instead of diagnosing individual KPI separately . ICSE-SEIP ’20, May 23–29, 2020, Seoul, Republic of Korea Chetan Bansal, Sundararajan Renganathan, Ashima Asudani, Olivier Midy , and Mathru Janakiraman 10 CONCLUSION W e have describ ed DeCaf, a system for diagnosing and triaging performance regressions in large-scale cloud ser vices. T erabytes of logs and the heterogeneous attributes generated by large-scale cloud services makes it infeasible to do any automated or man- ual analysis. DeCaf leverages Random Forest models along with custom scoring functions to mine predicates from the logs which are correlated with regressions. Furthermore, the results are au- tomatically triage d, making it easier for the on-call engineers to prioritize and investigate these issues. DeCaf has been deployed for two large-scale commercial cloud services in Microsoft. It was able to diagnose 10 known and 31 unknown performance issues while signicantly reducing manual eort. W e have also shared learnings and insights from integrating DeCaf into the DevOps processes at Microsoft. 11 A CKNO WLEDGMEN TS W e would like to acknowledge the invaluable contributions and support of B. Ashok, Pradnya Kulkarni, Kushal Narkhede, Nachiap- pan Nagappan, Jim Kle e wein, Ranjita Bhagwan and Saravanakumar Rajmohan. REFERENCES [1] Mamdouh Alenezi, Kenneth Magel, and Shadi Banitaan. 2013. Ecient Bug Triaging Using T ext Mining. JSW 8, 9 (2013), 2185–2190. [2] Amazon.com. 2019. Amazon A W A SLA. https://aws.amazon.com/compute/sla/. [3] James Bergstra and Y oshua Bengio. 2012. Random search for hyper-parameter optimization. Journal of Machine Learning Research 13, Feb (2012), 281–305. [4] James S Bergstra, Rémi Bardenet, Y oshua Bengio, and Balázs Kégl. 2011. Al- gorithms for hyper-parameter optimization. In Advances in neural information processing systems . 2546–2554. [5] Peter Bodik, Moises Goldszmidt, Armando Fox, Dawn B W oodard, and Hans Andersen. 2010. Fingerprinting the datacenter: automated classication of perfor- mance crises. In Proceedings of the 5th European conference on Computer systems . ACM, 111–124. [6] Daniela Brauckho, Xenofontas Dimitropoulos, Arno W agner , and Kavè Salama- tian. 2009. Anomaly extraction in backbone networks using asso ciation rules. In Proceedings of the 9th ACM SIGCOMM conference on Internet measurement . ACM, 28–34. [7] Leo Breiman. 2001. Random Forests. Machine Learning 45, 1 (01 Oct 2001), 5–32. https://doi.org/10.1023/A:1010933404324 [8] Jianguo Chen, Kenli Li, Zhuo T ang, Kashif Bilal, Shui Y u, Chuliang W eng, and Keqin Li. 2017. A parallel random forest algorithm for big data in a spark cloud computing environment. IEEE Transactions on Parallel and Distribute d Systems 28, 4 (2017), 919–933. [9] M. Chen, A. X. Zheng, J. Lloyd, M. I. Jordan, and E. Brewer. 2004. Failure diagnosis using decision trees. In International Conference on Autonomic Computing, 2004. Proceedings. 36–43. https://doi.org/10.1109/ICAC.2004.1301345 [10] Ira Cohen, Jerey S Chase, Moises Goldszmidt, T erence Kelly , and Julie Symons. 2004. Correlating Instrumentation Data to System States: A Building Block for Automated Diagnosis and Control.. In OSDI , V ol. 4. 16–16. [11] Min Du, Feifei Li, Guineng Zheng, and Vivek Srikumar . 2017. Deeplog: Anomaly detection and diagnosis from system logs through deep learning. In Proceedings of the 2017 ACM SIGSAC Conference on Computer and Communications Se curity . ACM, 1285–1298. [12] Songyun Duan, Shivnath Babu, and Kamesh Munagala. 2009. Fa: A system for automating failure diagnosis. In 2009 IEEE 25th International Conference on Data Engineering . IEEE, 1012–1023. [13] Nabila Farnaaz and MA Jabbar . 2016. Random forest mo deling for network intrusion detection system. Procedia Computer Science 89 (2016), 213–217. [14] Mostafa Farshchi, Jean-Guy Schneider, Ingo W eb er , and John Grundy. 2015. Experience report: Anomaly detection of cloud application operations using log and cloud metric correlation analysis. In 2015 IEEE 26th International Symposium on Software Reliability Engineering (ISSRE) . IEEE, 24–34. [15] Moshe Gabel, Assaf Schuster , Ran-Gilad Bachrach, and Nikolaj Bjørner. 2012. Latent fault detection in large scale services. In IEEE/IFIP International Conference on Dependable Systems and Networks (DSN 2012) . IEEE, 1–12. [16] Google.com. 2019. Spee d Matters. https://ai.googleblog.com/2009/06/sp eed- matters.html. [17] Jiawei Han, Yanheng Liu, and Xin Sun. 2013. A scalable random forest algo- rithm based on mapreduce. In 2013 IEEE 4th International Conference on Software Engineering and Ser vice Science . IEEE, 849–852. [18] Johan Huysmans, Karel Dejaeger , Christophe Mues, Jan Vanthienen, and Bart Baesens. 2011. An empirical evaluation of the comprehensibility of decision table, tree and rule based predictive models. Decision Supp ort Systems 51, 1 (2011), 141–154. [19] Shwetabh Khanduja, Vinod Nair , S Sundararajan, Ameya Raul, Ajesh Babu Shaj, and Sathiya Keerthi. 2015. Near Real-Time Ser vice Monitoring Using High- Dimensional Time Series. In 2015 IEEE International Conference on Data Mining W orkshop (ICDMW) . IEEE, 1624–1627. [20] Ahmed Lamkan, Serge Demeyer , Emanuel Giger, and Bart Goethals. 2010. Pre- dicting the severity of a reported bug. In 2010 7th IEEE W orking Conference on Mining Software Repositories (MSR 2010) . IEEE, 1–10. [21] Bingguo Li, Xiaojun Chen, Mark Junjie Li, Joshua Zhexue Huang, and Shengzhong Feng. 2012. Scalable random forests for massive data. In Pacic- Asia Conference on Knowledge Discovery and Data Mining . Springer , 135–146. [22] Liang Luo, Suman Nath, Lenin Ravindranath Sivalingam, Madan Musuvathi, and Luis Ceze. 2018. Troubleshooting Transiently-Recurring Errors in Production Systems with Blame-Proportional Logging. In 2018 USENIX A nnual T echnical Conference (USENIX A TC 18) . 321–334. [23] Karthik Nagaraj, Charles Killian, and Jennifer Neville. 2012. Structured compara- tive analysis of systems logs to diagnose performance problems. In Pr oceedings of the 9th USENIX conference on Networked Systems Design and Implementation . USENIX Association, 26–26. [24] Vinod Nair , Ameya Raul, Shwetabh Khanduja, Vikas Bahirwani, Qihong Shao, Sundararajan Sellamanickam, Sathiya Keerthi, Steve Herbert, and Sudheer Dhuli- palla. 2015. Learning a hierarchical monitoring system for detecting and di- agnosing service issues. In Proceedings of the 21th ACM SIGKDD International Conference on Knowledge Discovery and Data Mining . ACM, 2029–2038. [25] PowerBI.com. 2019. Power BI. https://powerbi.microsoft.com/. [26] J Ross Quinlan. 1986. Induction of Decision Trees. Machine Learning 1. I 8, 1 (1986), 106. [27] Grégory Rogez, Jonathan Rihan, Srikumar Ramalingam, Carlos Orrite, and Philip HS T orr . 2008. Randomized trees for human pose detection. In 2008 IEEE Conference on Computer Vision and Pattern Recognition . IEEE, 1–8. [28] Y uan Tian, Chengnian Sun, and David Lo. 2012. Improved duplicate bug report identication. In 2012 16th European Conference on Software Maintenance and Reengineering . IEEE, 385–390. [29] Risto V aarandi and Mauno Pihelgas. 2015. LogCluster-A data clustering and pattern mining algorithm for event logs. In 2015 11th International Conference on Network and Service Management (CNSM) . IEEE, 1–7. [30] Xin Xia, David Lo, Ying Ding, Jafar M Al-Kofahi, Tien N Nguyen, and Xinyu W ang. 2017. Improving automated bug triaging with specialized topic model. IEEE Transactions on Software Engineering 43, 3 (2017), 272–297. [31] Y aya Xie, Xiu Li, EW T Ngai, and W eiyun Ying. 2009. Customer churn prediction using improved balanced random forests. Expert Systems with A pplications 36, 3 (2009), 5445–5449. [32] W ei Xu, Ling Huang, Armando Fox, David Patterson, and Michael I Jordan. 2009. Detecting large-scale system problems by mining console logs. In Proce edings of the ACM SIGOPS 22nd symposium on Operating systems principles . A CM, 117–132. [33] T akehisa Y airi, Y oshikiyo Kato, and Koichi Hori. 2001. Fault detection by mining association rules from house-keeping data. In proceedings of the 6th International Symposium on Articial Intelligence, Robotics and Automation in Space , V ol. 18. Citeseer , 21. [34] Keun Soo Yim. 2016. Evaluation metrics of service-level reliability monitoring rules of a big data service. In 2016 IEEE 27th International Symposium on Software Reliability Engineering (ISSRE) . IEEE, 376–387. [35] Hamzeh Zawawy , Kostas Kontogiannis, and John Mylopoulos. 2010. Log ltering and interpretation for root cause analysis. In 2010 IEEE International Conference on Software Maintenance . IEEE, 1–5.
Original Paper
Loading high-quality paper...
Comments & Academic Discussion
Loading comments...
Leave a Comment