Estimating the sensitivity of centrality measures w.r.t. measurement errors
Most network studies rely on an observed network that differs from the underlying network which is obfuscated by measurement errors. It is well known that such errors can have a severe impact on the reliability of network metrics, especially on centrality measures: a more central node in the observed network might be less central in the underlying network. We introduce a metric for the reliability of centrality measures – called sensitivity. Given two randomly chosen nodes, the sensitivity means the probability that the more central node in the observed network is also more central in the underlying network. The sensitivity concept relies on the underlying network which is usually not accessible. Therefore, we propose two methods to approximate the sensitivity. The iterative method, which simulates possible underlying networks for the estimation and the imputation method, which uses the sensitivity of the observed network for the estimation. Both methods rely on the observed network and assumptions about the underlying type of measurement error (e.g., the percentage of missing edges or nodes). Our experiments on real-world networks and random graphs show that the iterative method performs well in many cases. In contrast, the imputation method does not yield useful estimations for networks other than Erd\H{o}s-R'enyi graphs.
💡 Research Summary
The paper addresses a fundamental problem in network analysis: the impact of measurement errors on node centrality rankings. While it is well known that missing or spurious nodes and edges can dramatically alter centrality values, there has been no systematic way to quantify how often the observed ranking agrees with the true, error‑free ranking. To fill this gap the authors introduce a new reliability metric called sensitivity. For a given centrality measure c, sensitivity ρc(G,O) is defined as the probability that, when two distinct nodes are drawn uniformly at random from the common vertex set of the hidden (error‑free) graph H and the observed (error‑contaminated) graph O, the node that is more central in O is also more central in H. Formally, ρc = nc/(nc+nd), where nc and nd are the numbers of concordant and discordant node pairs, respectively. This definition is equivalent to (γ+1)/2, where γ is the Goodman‑Kruskal rank‑correlation coefficient, linking the new metric to a well‑studied statistical measure.
Because the hidden graph H is never available in practice, the authors propose two estimation strategies that rely only on the observed graph O and on an assumed error mechanism ϕ (e.g., a known proportion of randomly missing edges).
-
Imputation method – The error is “undone” by applying an inverse operation ψ to O. If ϕ removes a known fraction of edges uniformly at random, ψ adds the same number of edges uniformly at random, producing a synthetic graph Ŝ. Sensitivity is then estimated as ρc(O, Ŝ). This approach assumes that the imputed edges are plausible replacements for the missing ones, an assumption that holds only for very homogeneous networks.
-
Iterative method – The observed graph O is treated as a proxy for the hidden graph. The same error mechanism ϕ is applied again to O, generating a second observed graph O′. Sensitivity is estimated as ρc(O, O′). The underlying hypothesis is that the relationship between O and O′ mirrors the relationship between H and O, i.e., the network exhibits a form of self‑similarity under the error process. This method is computationally simple and does not require any explicit reconstruction of missing elements.
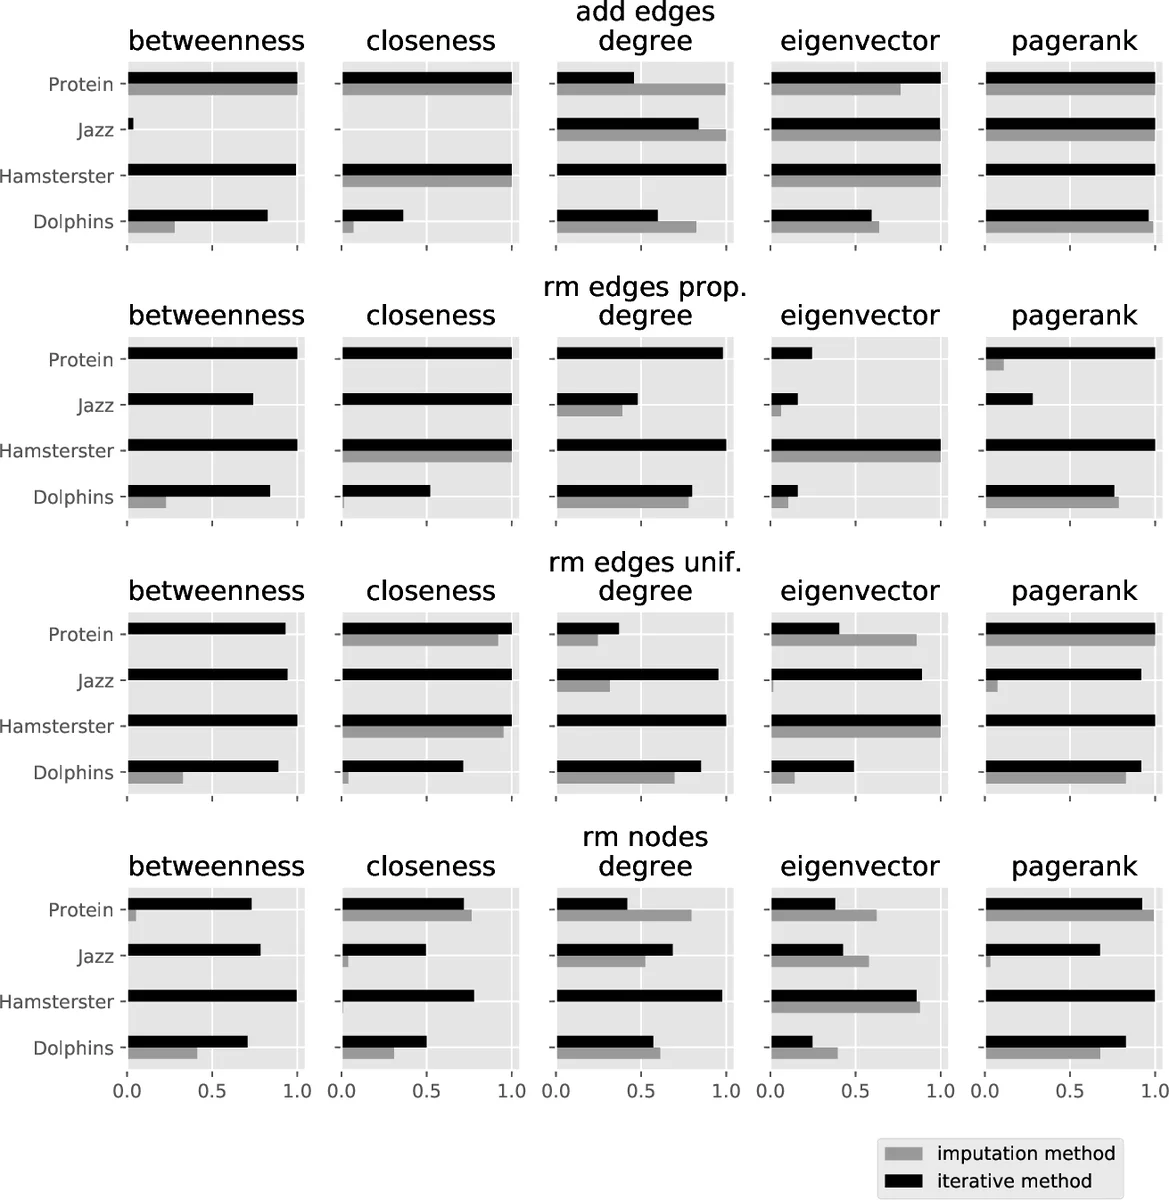
The authors evaluate both methods on synthetic and real‑world data. Synthetic experiments use Erdős–Rényi (ER) graphs (n = 100, p = 0.2) and Barabási–Albert (BA) graphs (n = 1000, m = 5). Four error mechanisms are considered: random node deletion, random edge deletion, degree‑proportional edge deletion, and random edge addition. Two error levels (10 % and 30 %) are examined. For each combination of centrality (degree, closeness, betweenness, eigenvector, PageRank) and error mechanism, 500 repetitions are performed, and the distribution of sensitivity values is recorded. Results show that degree centrality is the most robust across all settings, while the other measures are more sensitive to both the magnitude and the type of error. As expected, higher error rates lead to lower average sensitivity and higher variance.
Real‑world experiments involve several publicly available networks (social, collaboration, Internet topology). The same error mechanisms and levels are imposed artificially to create observed graphs. The imputation method yields reasonable estimates only for ER‑like networks; for BA‑type and empirical networks its estimates are biased and often far from the true sensitivity. In contrast, the iterative method consistently provides accurate approximations, especially for PageRank and eigenvector centralities, which are known to be more delicate under structural perturbations.
The paper’s contributions are threefold: (i) a clear, probabilistic definition of centrality reliability (sensitivity) that connects to established rank‑correlation statistics; (ii) two practical estimation procedures that require only the observed network and an assumed error model; and (iii) extensive empirical validation showing that the iterative approach is broadly applicable, while the imputation approach is limited to highly homogeneous graphs. The authors acknowledge that the iterative method rests on a self‑similarity assumption that may not hold for all network families, suggesting future work on formal conditions for its validity and on extensions to directed or weighted graphs.
Overall, the study provides network scientists with a concrete tool to assess how measurement errors may have distorted centrality rankings, enabling more transparent reporting of uncertainty and more reliable interpretation of network‑based findings.
Comments & Academic Discussion
Loading comments...
Leave a Comment