Affect-aware thermal comfort provision in intelligent buildings
Predominant thermal comfort provision technologies are energy-hungry, and yet they perform crudely because they overlook the requisite precursors to thermal comfort. They also fail to exclusively cool or heat the parts of the body (e.g., the wrist, t…
Authors: Kizito Nkurikiyeyezu, Anna Yokokubo, Guillaume Lopez
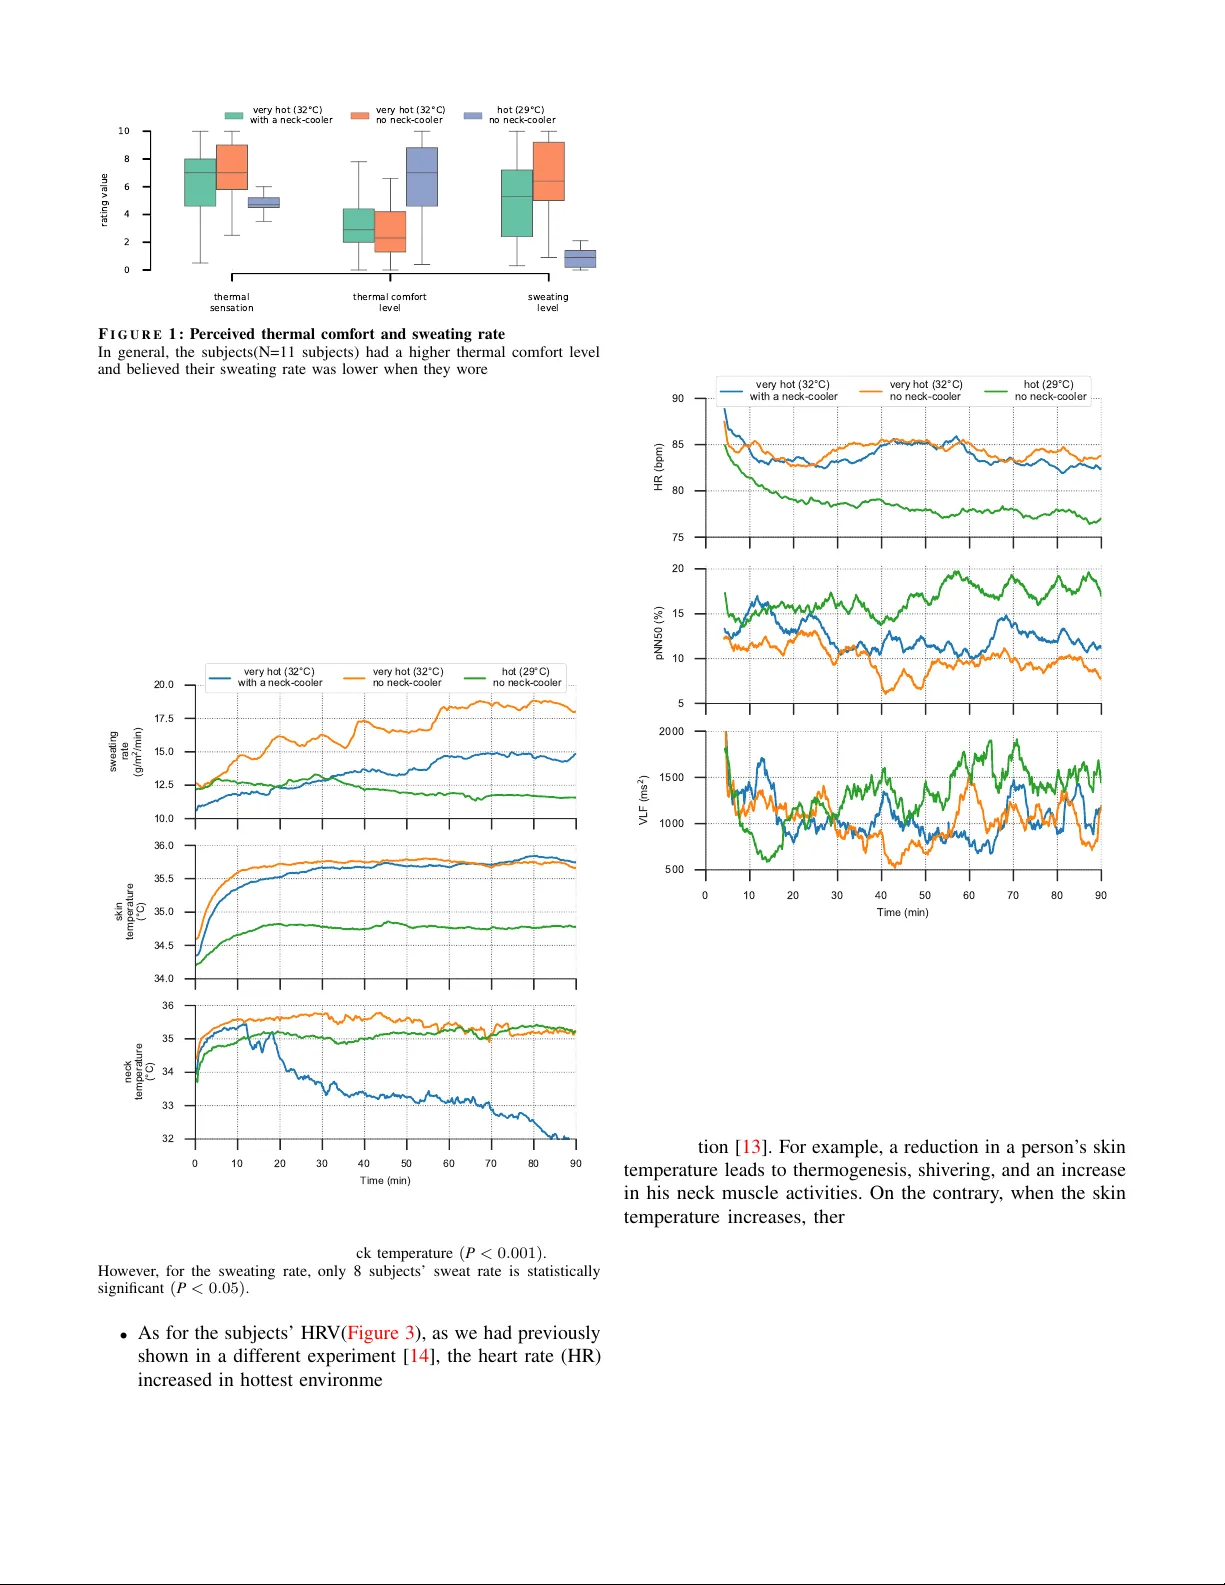
2019 8th International Conference on Affecti ve Computing and Intelligent Interaction (A CII) Af fect-a ware thermal comfort pro vision in intelligent b uildings Kizito Nkurikiyeyezu, Anna Y okokubo, and Guillaume Lopez W earable Information Lab Aoyama Gakuin Uni versity { kizito, guillaume } @wil-aoyama.jp, yokokubo@it.ao yama.ac.jp Abstract —Predominant thermal comfort provision technolo- gies are energy-hungry , and yet they perform crudely because they overlook the r equisite precursors to thermal comfort. They also fail to exclusively cool or heat the parts of the body (e.g., the wrist, the feet, and the head) that influence the most a person’ s thermal comfort satisfaction. Instead, they waste energy by heating or cooling the whole room. This resear ch in vestigates the influence of neck-coolers on people’ s thermal comfort perception and proposes an effectiv e method that deli vers thermal comfort depending on people’s heart rate variability (HR V). Moreov er , because thermal comf ort is idiosyncratic and depends on unf oreseeable circumstances, only person-specific thermal comfort models are adequate for this task. Unfortunately , using person-specific models would be costly and inflexible for deployment in, e.g ., a smart b uilding because a system that uses person-specific models would require collecting extensive training data from each person in the building. As a compromise, we devise a hybrid, cost-effective, yet satisfactory technique that derives a personalized person-specific-like model from samples collected from a large population. For example, it was possible to double the accuracy of a generic model (fr om 47.77% to 96.11%) using only 400 person-specific calibration samples. Finally , we propose a practical implementation of a real-time thermal com- fort provision system that uses this strategy and highlighted its advantages and limitations. Index T erms —thermal comfort model, humanized computing, smart building, heart rate variability , energy conservation I . I N T R O D U C T I O N Despite a century of research on thermal comfort, the technologies for its provision lea ve much to be desired [ 1 ], [ 2 ]. By definition, thermal comfort is “the condition of mind that expresses satisfaction with the thermal en vironment and is assessed by subjective ev aluation [ 3 ]”. Paradoxically , most thermal comfort provision technologies (e.g., air conditioning units) ignore this idiosyncratic nature of thermal comfort; instead, they pro vide neutral thermal conditions to all occupants of the buildings. Unfortunately , this strategy is inefficient and has many well-kno wn flaws highlighted in, e.g., [ 4 ], [ 5 ]: First, a one-size-fits-all strate gy cannot w ork well because of indi vidual differences (e.g., age, gender , and physiological makeup) that influence ho w each person percei ves thermal comfort [ 6 ]. Second, there is no rationale for providing “thermal neutral” conditions (i.e., conditions in which people feel neither warm nor cool [ 7 ]). In reality , people prefer non-neutral conditions [ 7 ]–[ 9 ]. Moreov er, there is a mounting suspicion that thermal neutrality is pernicious because it may be a root cause of sick building syndrome (SBS) [ 10 ], [ 11 ]. Third, achie ving thermal neutrality is costly and necessitates immoderate energy consumption [ 2 ]. Forth, only a few parts of the body (e.g., head, wrists, and feet) are mostly responsible for thermal comfort. For example, in uniform en vironmental conditions, when it is cold, a person’ s feet and hands feel colder than other parts of the body . On the contrary , the cold en vironment does not affect the thermal sensation on the head, which usually feels warmer than the rest of the body and require a relati vely lower temperature to achieve a satisfactory thermal comfort [ 12 ]. Howe ver , air conditioning units do not exclusiv ely direct the heat to these crucial parts of the body . Instead, the y inefficiently cool or warm an entire room and regardless of the number of people av ailable in the room. Lastly , current international thermal comfort standards are unambitious (they expect a mere 80% satisfaction rate [ 7 ]). Consequently , many luminaries in the field [ 1 ], [ 2 ], [ 5 ], [ 7 ] argue for a paradigm shift in how thermal comfort is provided. In our pre vious research, we proposed a thermal comfort provision method that aimed to solv e some of the above limitations. W e argued that, since thermal comfort is a subjec- tiv e psychological sensation and that thermoregulation leads to discernible physiological changes [ 13 ], it would be more efficient to provide thermal comfort based on variations in a person’ s physiological signals. W e revealed [ 14 ] that a change in a thermal environment led to detectable fluctuations in people’ s heart rate v ariability (HR V) and introduced an energy-ef ficient thermal comfort provision technique that uses people’ s physiological changes due to their surrounding thermal en vironments to provide a personalized thermal comfort [ 15 ]. W e also dev eloped a proof of concept machine learning-enabled apparatus that delivers, in real-time, a personalized thermal comfort [ 16 ]–[ 18 ]. The system uses people’ s photoplethysmo- gram (PPG) signals to estimate their thermal comfort level. While we have not yet completed the de velopment of the whole system, at its completion, we anticipate that the system shall deliv er optimum thermal comfort based variation in people’ s physiological signals and that it shall minimize the energy consumption depending on, e.g., the number of people in the room, their comfort le vel, and depending on the outside weather . At the moment, this system performs crudely because it uses a generic thermal comfort prediction model and does not take into consideration the physiological differences between its users. In this paper , we aim to improve these limitations. I I . M E T H O D S A. HRV datasets W e used a thermal comforts dataset described in [ 19 ]. W e collected the dataset by exposing elev en subjects to three experiments. In the first experiment, we placed the subjects in a very hot environment (32 ° C) and they wore adjustable 978-1-7281-3891-6/19/$31.00 ©2019 European Union (from 18 ° C up to 28 ° C) custom-made neck-coolers. In the second experiment, we put the subjects in the same very hot conditions, but in this case, they did not wear any neck-coolers. In the third experiment, we placed the subjects in a hot (29 ° C) en vironment and, like in the previous case, the subjects did not wear any neck-coolers. During the experiment, we recorded each subject’ s interbeat interval (IBI) using myBeat heart rate sensor (Union T ool co.). W e also recorded the subject’ s skin temperature on the chest, on the arm and the lo wer leg, on the neck and measured his/her sweating rate using SNT -200 sweat meters (Rousette Strategy , Inc.). The IBI signal was sampled at 1kHz. Other sensors were recorded at 1 sample per minute. The subject regularly self-ev aluated their thermal comfort level, their thermal sensation, and their sweat lev el on a 10-scale visual analog scale (V AS). All experiments lasted for at least 90 minutes. B. F eature extraction W e computed various heart rate variability (HR V) features 1 using the standards and algorithms proposed by the T ask Force of the European Society of Cardiology and the North American Society of Pacing and Electrophysiology [ 20 ]. W e first extracted an inter -beat interval (IBI) signal from the peaks of the electrocardiogram (ECG) signal of each subject. Then, we computed each HR V feature on a moving window as follows: W e used a five-minute array of IBI to compute the first HR V index. Then, a new IBI sample is appended to the IBI array while the oldest IBI sample is removed from the beginning of the IBI array . The new resulting IBI array is used to compute the next HR V index. W e repeated this process until the end of the entire IBI array . C. Model training and evaluation W e utilized the subject’ s self-assessment to dev elop re- gression models that estimate each subject’ s thermal comfort lev el. W e also classified the individual’ s comfort based on the experiment conditions of their thermal en vironment. W e used various machine learning algorithms ( T able I ) to train and ev aluate three thermal comfort prediction models: T A B L E I : Thermal comfort models and their key hyperparameters Model Hyperparameters AdaBoost estimator=DecisionT ree(max depth=64), n estimators=50 Bagging estimator=DecisionT ree(max depth=64), n estimators=50 ExtraT rees n estimators=100, max depth=64 RandomForest n estimators=100, max depth=64 XGBoost n estimators=50, max depth=64, subsample=0.8 • generic model —to assess how the model would perform in predicting the thermal comfort of new unseen subjects, (i.e., the subjects whose HR V samples were not part of the training set), we validated the performance of the generic model using a leave-one-subject-out (LOSO) approach. This method consists of using the data of one subject as a 1 refer to T able I and to subsection I-A in the supplementary material Algorithm 1: M O D E L C A L I B R A T I O N Input: machine learning algorithm h m Data: • HR V samples sample generic of n persons • Calibration HR V samples sample calibration that belong to q unseen persons such that q n Output: trained calibrated model h m 0 / * mix the calibration samples and the generic samples * / D 0 ← − ∅ D 0 ← − shuffle(sample generic ∪ sample calibration ) / * train the model h m on dataset D 0 * / h m 0 ← − h m (D 0 ) retur n h m 0 test set and the data of the remaining subjects as a training set. • person-specific model —unlike a generic model, a person- specific model is de veloped by training and testing the model exclusiv ely on the data of the same person. W e used a 10-folds cross-validation approach to ev aluate the performances of each model. • hybrid model —the generic model performs poorly because of individual differences in how people express thermal comfort. On the other hand, person-specific models would be costly to deploy in buildings because they would require acquiring and labeling the training data for each occupant of the building. W e propose a hybrid method to mitigate this limitation. In a nutshell, the technique ( Algorithm 1 ) consists of adding a few person-specific samples (they are referred to as “calibration samples” in the remaining of this paper) collected from pre viously unseen people into a generic thermal comfort model trained on a large group of people. In this paper , we tested the method with q = 3 on various algorithms ( T able I ) —and their performances are similar . Nevertheless, all the relev ant results in this paper are based on the predictions of Extremely Randomized Trees (ExtraTrees) models because they performed the best. I I I . R E S U L T S A. The effect of the neck-cooler s on thermal comfort For most subjects, wearing the neck-coolers improved how they felt about the thermal en vironments: • As shown in Figure 1 , the subjects expressed having a better thermal comfort le vel and a lo wer sweating rate when they wore the neck-coolers compared to when they did not, b ut the results of their thermal sensation is not conclusiv e (the median of the thermal sensation with or without the neck coolers is the same). Nev ertheless, in all cases, wearing the neck-coolers was not sufficient to offset the impact of the 29 ° C temperature gap between the very hot and the hot en vironment. • For all subjects, the skin temperatures and the neck temperatures decreased when they wore the neck-coolers thermal sensation thermal comfort level sweating level 0 2 4 6 8 10 rating value very hot (32°C) with a neck-cooler very hot (32°C) no neck-cooler hot (29°C) no neck-cooler F I G U R E 1 : Per ceived thermal comfort and sweating rate In general, the subjects(N=11 subjects) had a higher thermal comfort level and believed their sweating rate was lower when they wore the neck-coolers compared to when they did not wear any neck-coolers. Howev er, wearing the neck-coolers did not affect their thermal sensation significantly . ( P < 0 . 001) . Howe ver , there is no conclusi ve e vidence of the impact of the neck-coolers on the sweating rate because only the data of 8 subjects were statistically significant ( P < 0 . 05) . Furthermore, similarly to the previous case, the influence of the neck-coolers was not strong enough to negate the temperature differences between a 32°C and a 29°C en vironment ( Figure 2 ). 10.0 12.5 15.0 17.5 20.0 sweating rate ( g / m 2 / m i n ) very hot (32°C) with a neck-cooler very hot (32°C) no neck-cooler hot (29°C) no neck-cooler 34.0 34.5 35.0 35.5 36.0 skin temperature (°C) 0 10 20 30 40 50 60 70 80 90 Time (min) 32 33 34 35 36 neck temperature (°C) F I G U R E 2 : Mean (11 subjects, 8350 samples) temperatures and sweating rate —The recorded sensor data indicator that the neck-coolers reduced all subjects’ skin temperature, and their neck temperature ( P < 0 . 001) . Howe ver , for the sweating rate, only 8 subjects’ sweat rate is statistically significant ( P < 0 . 05) . • As for the subjects’ HR V( Figure 3 ), as we had pre viously shown in a different experiment [ 14 ], the heart rate (HR) increased in hottest en vironments, the pNN50 was lowest in the hottest environment and the V ery Low Frequency (VLF) band in the HR V po wer spectrum was highest in the coldest en vironment ( P < 0 . 001) . In particular, when the subjects wore the neck-coolers, their pNN50 signal is consistently and conspicuously higher than their counterpart pNN50 signal when they did not wear any neck-coolers. According to our previous research [ 14 ], this observation implies that, with the neck-coolers, subjects’ heart beating patterns reflected that of a lower -temperature en vironment. Other HR V indices (especially the HR) seem to follow this pattern ( P < 0 . 001) , albeit abstrusely and inconsistently . 75 80 85 90 HR (bpm) very hot (32°C) with a neck-cooler very hot (32°C) no neck-cooler hot (29°C) no neck-cooler 5 10 15 20 pNN50 (%) 0 10 20 30 40 50 60 70 80 90 Time (min) 500 1000 1500 2000 V L F ( m s 2 ) F I G U R E 3 : Mean (11 subjects, 94094 samples) Heart Rate V ariability (HR V) —The HR V changes depending on the thermal environment. Strikingly , it seems that, when the subjects wore the neck-coolers, their heart beating patters (especially for the pNN50) were similar to the heartbeat pattern they would have if they were in slightly lower temperature environment. B. Thermal comfort prediction The nervous system is a crucial player in people’ s ther- moregulation [ 13 ]. For example, a reduction in a person’ s skin temperature leads to thermogenesis, shiv ering, and an increase in his neck muscle activities. On the contrary , when the skin temperature increases, there is vasodilation and transpiration to bolster heat loss ( Figure 4 ). From this observation, we had previously shown [ 14 ] that it is possible to apply machine learning algorithms on a person’ s fluctuation in his physiologi- cal signals and to predict his thermal comfort in real-time [ 16 ]. W e applied regression and classification machine learn- ing algorithms on the HR V dataset as described in subsec- tion II-C . W e found that person-specific models achieved a suspiciously too good to be true performance ( accuracy = Hypothalamus Central thermoreceptors Peripheral thermoreceptors [Cold] [Hot] Thermal comfort decision T emperature reduction mechanisms T emperature generation mechanisms Sweat glands V ascular smooth muscles Brown adipose tissues Somatic muscles T ranspiration V asodilatation Vasoconstriction Heat production Shiver Cholinergic neurons of the sympathetic nervous system Noradrenergic neurons of the sympathetic nervous system Somatic motor neurons F I G U R E 4 : A simplified illustration of thermoregulation The brain’ s hypothalamus checks a person’s core temperature and kickoff the thermogenesis or heat dissipating processes depending on whether the person feels hot or cold. 99 . 98 ± 0 . 01 , RMSE = 0 . 04 ± 0 . 01 ) 2 . As shown in Figure 5 , this superb performance is, howe ver , only half the story of the real performance of the models 3 . Indeed, when we tested the same models on the unseen subjects (i.e., the subjects whose HR V samples were not part of the training set), the performance significantly decreased ( accuracy = 55 . 8 ± 0 . 98% , RMSE = 3 . 50 ± 0 . 83 , R 2 < 0 ). 50 60 70 80 90 100 accuracy (%) person-specific model generic model 1 2 3 4 5 6 7 8 9 10 11 subject ID 0 1 2 3 4 5 RMS error person-specific model generic model F I G U R E 5 : Perf ormance of the person-specific versus the generic model For all subjects (N=11 subjects), the person-specific models achieved a near- perfect prediction. Howe ver, due to the dif ferences in how each subject physiologically responds to thermal comfort, the generic model performed crudely . As unlikely as it seems, the models’ poor performance on the unseen subjects (i.e., the subjects whose data were not used for training the model) is arguably not a fruit of model overfitting because of four reasons. First, we used a large training dataset (364788 samples, 66 HR V features, size ≈ 430MB ). Although a lar ge training set does not ov erride overfitting, in most cases, a large train set is more diverse and reduces overfitting. Second, we tested numerous ensemble machine learning algorithms (e.g., T able I ) of various complexity , and they achie ved an outstanding cross-validation performance, but they flopped 2 see T able II and T able III in the supplementary material. 3 see T able IV and T able V in the supplementary material. when tested on the unseen subjects. Even a weak person- specific model that underfits the dataset performed better than the best person-independent model. As an illustration, a person- specific classification adaptive boosting model with a decision stump (i.e., a one-level decision tree) achieved a 56% accuracy . Its regression counterpart had 2.27 and 0.12 RMSE and R 2 respectiv ely . Third, all our models are based on ensemble machine learning algorithms, which, while they can overfit in some cases, are designed to reduce the likelihood of overfitting. Finally , and most importantly , we ev aluated the models using a cross-v alidation approach, and we obtained prediction with low standard deviations between the 10 folds. The poor performance on the unseen subjects is, howev er , not completely unexpected. Thermal comfort is intrinsically an idiosyncratic psychological sensation that depends on factors that are unique to each person [ 6 ]. Thus, it is not possible for a model to generalize on ne w unseen subjects. W e confirmed this phenomenon by in vestigating the influence of the indi vidual differences to the performance of the models. W e added a control prediction feature, the subject id , to the datasets. The subject id served as an indicator of the o wner of each sample in the dataset. W e computed and compared the rank of all features in the dataset and found that the subject id was always the most important feature. Similarly , we used a Recursiv e Feature Elimination (RFE) approach and found that the subject id was always among the most important feature. C. Thermal comfort model calibration The poor performance of the generic model highlights the limitation of the system we had pre viously proposed. A practi- cal thermal comfort prediction system that uses our approach needs to take into consideration the indi vidual differences in how each person expresses thermal comfort. The system should, for example, use only person-specific models. This approach, howe ver , is redundant, problematic, time-consuming, and very expensi ve to deploy in the real world because it would require to collect, label, and train extensi ve new data for every person in the building. Also, once the models are deployed, there is no guarantee they would work as expected because thermal comfort is affected by unpredictable factors [ 1 ], [ 6 ]. In our previous studies [ 21 ], we proposed a model calibration technique which incorporates a fe w samples from unseen people into a generic model trained on the data of a large group of people. In a nutshell, the technique ( Algorithm 1 ) consists of adding a fe w person-specific calibration samples collected from previously unseen people into generic data collected from a large group of people. In this study , the success of the proposed method hinges in the fact that humans share a similar response to thermal discomfort [ 13 ]. Howe ver , ev ery person possesses unique factors that supersede this generic response to thermal comfort [ 6 ]. From this observation, we hypothesis that adding a few person-specific calibration samples to the training data of the generic model would increase its performance because the new calibrated model would be able to capture the “uniqueness” of the new unseen people. When we applied this approach to the thermal comfort prediction, we observed that it improved 0 25 50 75 100 classification precision (%) accuracy (%) 0 50 100 150 200 250 300 350 400 calibration samples per subject 0 1 2 3 4 regression mean absolute error root mean square error F I G U R E 6 : Model calibration —without the calibration samples, the models performed poorly . Howe ver , their performance steadily improved when they were calibrated with a few person-specific samples the performance of the generic model considerably ( Figure 6 ) 4 . • The classification model’ s performance steadily increased when the calibration samples were added. For example, the accuracy increased from 48% to 82% when we used 100 calibration samples and culminated in a 96% accuracy when we used 400 calibration samples. • Similarly , for the regression model, the RMSE decreased from 3.65 to 1.09 when we used 400 calibration samples. At the same time, its R 2 coefficient improv ed from a futile R 2 = − 0 . 69 to a satisfactory R 2 = +0 . 84 It is imperativ e to note that it only took a small fraction of the calibration samples to increase the performance of the generic models trained on a large dataset. In this study , we added 400 samples to dramatically increase the performance of the generic models that we had trained on approximately 270000 samples. For most people, it would only take 5 to 6 minutes to collect the required 400 HR V calibration samples. I V. T H E R M A L C O M F O R T P R O V I S I O N One of the pillars of responsiv e, intelligent buildings (IBs) is to respond to each occupant’ s need and to maximize his comfort and well-being with a minimal negati ve impact on the environment [ 22 ]. Although there is a need for extensiv e studies to validate our findings, the results in this study corroborate with those in our pre vious studies and suggest that it could be possible to design an affect-a ware thermal comfort provision system that self-adjust to meet the needs of ev ery person in the building. Furthermore, as we discussed in our previous paper [ 15 ], such a system would provide a higher quality thermal comfort and requires lower energy . An archetype of such a system is sho wn in Figure 7 . As already argued by other researchers [ 2 ], [ 23 ]–[ 26 ], personalized comfort models do provide better thermal comfort and require lower energy . For example, Pasut and his co-authors [ 26 ] showed that a personalized heated/cooled chairs and a fan were able to provide satisfactory thermal comfort to 90% of the users. Furthermore, the whole setup consumed 50% less 4 see T able VI and T able VII in the supplementary material. energy compared to a central air-conditioning system. Our proposed method improv es their approach one step further because it directly estimates the thermal comfort from the person’ s physiological response to the thermal en vironment and adjusts the thermal environment accordingly . Furthermore, in case the system misjudge a person’ s thermal comfort, the person could adjust the temperature according to his liking. Hypothalamus Heart rate variability Energy vs. thermal comfort optimization decision Neck cooler Central A/C Cooling fan Heatable chair Office lights Machine learning F I G U R E 7 : Proposed comf ort provision system . A person’ s photoplethysmogram (PPG) signal is recorded using a wristband device (e.g., an Empatica E4). The device periodically sends the PPG signal to a computing device which computes and pre-processes (e.g., data cleaning, re- balancing and dimension reduction) the HR V features and sent them to a remote server where they are used to predict the person’ s thermal comfort. The server then uses constrained optimization algorithms to activ ate suitable actuators (e.g., neck-cooler, a fan, and heated/cooled chair) to deliv er an optimum and personalized thermal comfort using the least possible energy . In case the system miscalculates the person’ s thermal comfort, the user could adjust the temperature; thus, implicitly giving calibration samples that could be used to personalize the system to his liking further . This feedback is used to train a personalized stress prediction model, which is published and consumed as a RESTful API. When the model deteriorates, it is automatically updated based on the periodic self-ev aluations the system receiv ed from its users. Although the proposed system has many advantages, its deployment in real-world settings poses numerous challenges. Notably , there is a need to collect the bio-signals unobtrusiv ely , and its deployment would certainly need substantial upfront in vestment. Fortunately , there e xist many enabling technologies that would ease some of these challenges. For example, it could be possible to use an Empatica E4 wristbands 5 to collect the PPG signals. Furthermore, it might be economical to use off- the-shelf heatable ergonomic chairs, neck coolers, and fans instead of designing custom-made components. Finally , the design of the system might take advantages of the commercial machine learning cloud framew orks to simplify the deployment and maintenance of the machine learning models. For example, in our proposed system ( Figure 7 ), the designer could use the IBM’ s W atson Studio 6 to manage the thermal comfort models, including model calibration and deployment as a REST API. Additionally , ev en though the deployment and maintenance of the proposed system would require a significant upfront in vestment, the in vestment might pay of f itself because of the expected energy-saving it would bring. Furthermore, the 5 https://www .empatica.com/research/e4 6 https://www .ibm.com/cloud/machine-learning system could also double as a multipurpose system that uses the office occupants’ physiological signals for pre ventiv e medicine and stress management. The advantages of these spillov ers applications (prev entiv e medicine and stress monitoring) are good enough alone to offset the cost of the initial in vestment because stress and sickness cost employers billions of dollars to compensate for their work ers’ sick leav es, lo wer producti vity , job absenteeism, and high employee turnover . V. C O N C L U S I O N The technologies for thermal comfort provision in the buildings are ineffecti ve in terms of the quality of the comfort they provide and in terms of the energy they require. Our research hinges on neuroscience and cardiology studies that showed that thermally dis-comfortable environments yield detectable changes in a person’ s physiological signals, e.g., the variability in a person’ s heart beat-to-beat intervals. W e used these breakthrough to develop an intelligent thermal comfort provision system that deliv ers the thermal comfort depending on the fluctuations in a person’ s photoplethysmogram (PPG) signal. This system, howe ver , used a generic thermal comfort prediction model and did not take into account the uniqueness in how each person expresses thermal comfort. In this paper , we conducted experiments on 11 subjects doing office work in three thermal en vironments and compared ho w their thermal comfort would improve when they wore neck- coolers. W e found that the subjects expressed having a higher thermal comfort when they wore the neck-coolers. Therefore, using neck-coolers in the summers might sav e energy by keeping the indoor temperature at relativ ely high temperatures without compromising the occupants’ thermal comfort. Moreov er, because thermal comfort is a subjectiv e psy- chophysiological feeling that is influenced by many unpre- dictable factors, generic thermal comfort prediction models cannot work well. Instead, person-specific models do. Regret- tably , the deployment of a system that uses person-specific models would be costly and inflexible for deployment into real- world buildings. In this paper , we proposed a model calibration technique that incorporates a few calibration samples into the training data of a generic model to increase its performance. For example, when we added 400 calibration samples into a 270000 samples training set, its accuracy increased from 47.7% to 96.1%. W e also discussed a possible implementation of a real-time thermal comfort provision system that uses our techniques and highlighted its advantages and limitations. S U P P L E M E N T A R Y M A T E R I A L S The supplemental material 7 contains: • Method—Detailed description of Section II • T able I—List of the heart rate variability (HR V) features ( Section II-A ) • T able II and T able III—Performance of the person-specific models ( Section III-B ) • T able IV and T able V—Performance of the generic models ( Section III-B ) • T able VI and T able VII —Performance of the calibrated models ( Section III-C ) • T able VIII and T able IX —Feature importance when the subject id feature is added to the dataset ( Section III-B ) • Plots comparing the performance of the different machine learning models • The computed HR V dataset ( Section II-A ) • The python source code to reproduce the ke y findings of this research 7 freely available at https://www .kaggle.com/qiriro/comfort R E F E R E N C E S [1] J. F . Nicol and S. Roaf, “Rethinking thermal comfort, ” Build. Res. Inf. , vol. 45, no. 7, pp. 711–716, oct 2017. [2] G. S. Brager , H. Zhang, and E. Arens, “Evolving opportunities for providing thermal comfort, ” Build. Res. Inf. , vol. 43, no. 3, pp. 274– 287, 2015. [3] ANSI/ASHRAE, “Thermal environmental conditions for human occu- pancy standard 55-2013, ” Ashrae , 2013. [4] R. J. de Dear , T . Akimoto, E. A. Arens, G. Brager , C. Candido, K. W . D. Cheong, B. Li, N. Nishihara, S. C. Sekhar, S. T anabe, J. T oftum, H. Zhang, and Y . Zhu, “Progress in thermal comfort research over the last twenty years, ” Indoor Air , vol. 23, no. 6, pp. 442–461, dec 2013. [5] J. V an Hoof, “F orty years of fanger’ s model of thermal comfort: Comfort for all?” Indoor Air , vol. 18, no. 3, pp. 182–201, 2008. [6] Z. W ang, R. de Dear, M. Luo, B. Lin, Y . He, A. Ghahramani, and Y . Zhu, “Individual difference in thermal comfort: A literature revie w , ” Build. En viron. , vol. 138, pp. 181–193, jun 2018. [7] R. de Dear, “Revisiting an old hypothesis of human thermal perception: alliesthesia, ” Build. Res. Inf. , vol. 39, no. 2, pp. 108–117, apr 2011. [8] M. A. Humphreys and M. Hancock, “Do people like to feel neutral?” Ener gy Build. , vol. 39, no. 7, pp. 867–874, jul 2007. [9] G. S. Brager and R. de Dear, “Thermal adaptation in the built en vi- ronment: a literature revie w , ” Ener gy Build. , vol. 27, no. 1, pp. 83–96, 1998. [10] P . Ole Fanger , “Human requirements in future air-conditioned environ- ments, ” Int. J. Refrig. , vol. 24, no. 2, pp. 148–153, 2001. [11] J. Kaczmarczyk, A. Meliko v , and P . O. Fanger , “Human response to personalized ventilation and mixing ventilation, ” Indoor Air , vol. 14, no. s8, pp. 17–29, dec 2004. [12] E. Arens, H. Zhang, and C. Huizenga, “Partial- and whole-body thermal sensation and comfort - part i: Uniform environmental conditions, ” J. Therm. Biol. , vol. 31, no. 1-2 SPEC. ISS., pp. 53–59, 2006. [13] S. F . Morrison, “Central neural pathways for thermoregulation, ” F r ont. Biosci. , vol. 16, no. 1, p. 74, 2011. [14] K. N. Nkurikiyeyezu, Y . Suzuki, and G. F . Lopez, “Heart rate variability as a predictiv e biomarker of thermal comfort, ” J. Ambient Intell. Humaniz. Comput. , vol. 9, no. 5, pp. 1465–1477, aug 2018. [15] K. NKURIKIYEYEZU, Y . SUZUKI, P . MARET , G. LOPEZ, and K. IT A O, “Conceptual design of a collective energy-ef ficient physiologically-controlled system for thermal comfort delivery in an office en vironment, ” SICE J. Control. Meas. Syst. Inte gr . , vol. 11, no. 4, pp. 312–320, 2018. [16] K. Nkurikiyeyezu and G. Lopez, “T oward a real-time and physiologically controlled thermal comfort provision in office buildings, ” in Intell. En viron. IOS Press, 2018, pp. 168–177. [17] G. Lopez, T . T okuda, M. Oshima, K. Nkurikiyeyezu, N. Isoyama, and K. Itao, “Dev elopment and ev aluation of a low-energy consumption wearable wrist warming device, ” Int. J. Autom. T echnol. , vol. 12, no. 6, pp. 911–920, nov 2018. [18] G. Lopez, K. T akahashi, K. Nkurikiyeyezu, and A. Y okokubo, “Devel- opment of a wearable thermo-conditioning device controlled by human factors based thermal comfort estimation, ” in 2018 12th F r . 10th Eur . Congr . Mechatr onics . IEEE, sep 2018, pp. 255–259. [19] G. LOPEZ, Y . KA W AHARA, Y . SUZUKI, M. T AKAHASHI, H. T AKA- HASHI, and M. W ADA, “Effect of direct neck cooling on psychological and physiological state in summer heat environment, ” Mech. Eng. J. , vol. 3, no. 1, pp. 15–00 537, 2016. [20] M. Malik, J. T . Bigger, A. J. Camm, R. E. Kleiger , A. Malliani, A. J. Moss, and P . J. Schwartz, “Heart rate variability: Standards of measurement, physiological interpretation, and clinical use, ” Eur . Heart J . , vol. 17, no. 3, pp. 354–381, mar 1996. [21] K. Nkurikiyeyezu, A. Y okokubo, and G. Lopez, “Importance of indi vidual differences in physiological-based stress recognition models, ” in 2019 15th Int. Conf. Intell. En viron. Rabbat: IEEE, 2019. [22] A. Ghaff arianhoseini, U. Berardi, H. AlW aer, S. Chang, E. Halawa, A. Ghaffarianhoseini, and D. Clements-Croome, “What is an intelligent building? analysis of recent interpretations from an international perspec- tiv e, ” Ar chit. Sci. Rev . , vol. 59, no. 5, pp. 338–357, sep 2016. [23] J. Kim, S. Schiav on, and G. Brager, “Personal comfort models – a new paradigm in thermal comfort for occupant-centric environmental control, ” Build. Envir on. , 2018. [24] Q. Deng, R. W ang, Y . Li, Y . Miao, and J. Zhao, “Human thermal sensation and comfort in a non-uniform environment with personalized heating, ” Sci. T otal Envir on. , 2016. [25] T . Hoyt, E. Arens, and H. Zhang, “Extending air temperature setpoints: Simulated energy sa vings and design considerations for new and retrofit buildings, ” Build. Envir on. , vol. 88, no. September , pp. 89–96, jun 2015. [26] W . Pasut, H. Zhang, E. Arens, and Y . Zhai, “Energy-ef ficient comfort with a heated/cooled chair: Results from human subject tests, ” Build. En viron. , vol. 84, pp. 10–21, 2015.
Original Paper
Loading high-quality paper...
Comments & Academic Discussion
Loading comments...
Leave a Comment