Spatial and Temporal Consistency-Aware Dynamic Adaptive Streaming for 360-Degree Videos
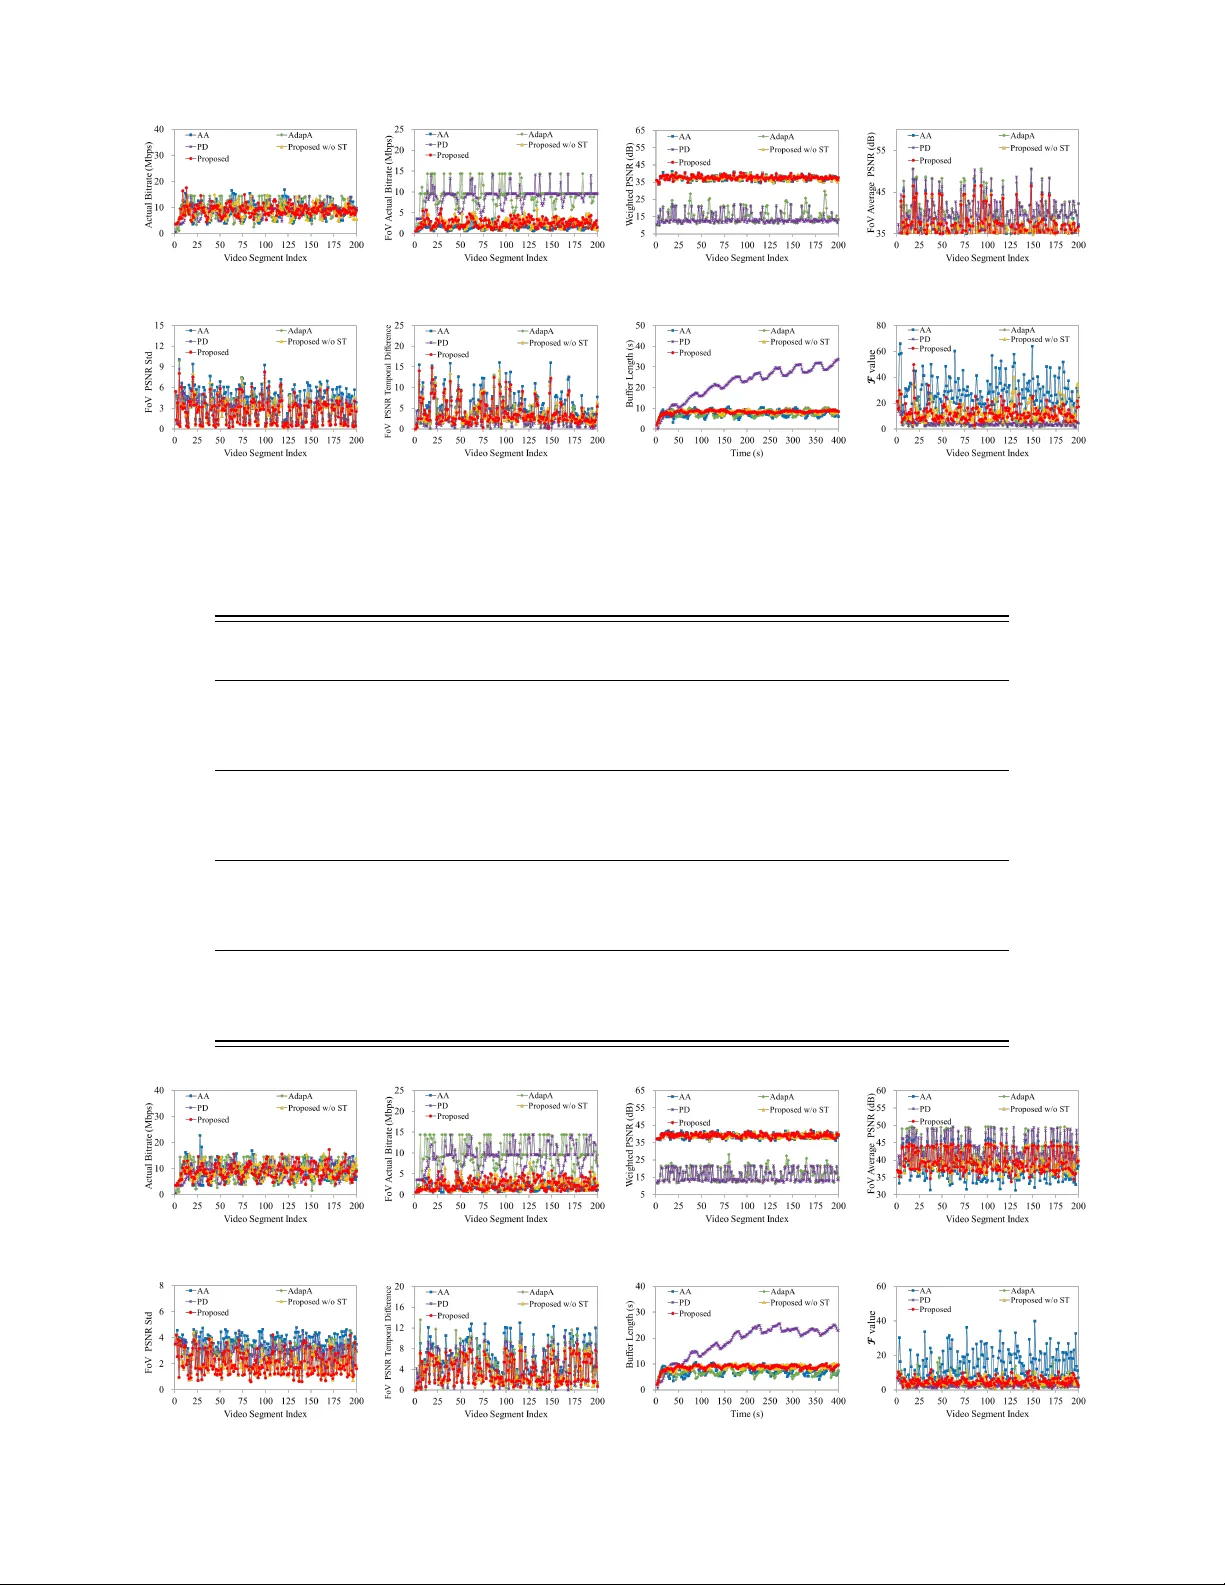
The 360-degree video allows users to enjoy the whole scene by interactively switching viewports. However, the huge data volume of the 360-degree video limits its remote applications via network. To provide high quality of experience (QoE) for remote …
Authors: Hui Yuan, Shiyun Zhao, Junhui Hou
1 Spatial and T emporal Consistenc y-a ware Dynamic Adapti v e Streaming for 360-de gree V ideos Hui Y uan, Senior Member , IEEE, Shiyun Zhao, Junhui Hou, Member , IEEE, Xuekai W ei, and Sam Kwong, F ellow , IEEE Abstract —The 360-degree video allo ws users to enjoy the whole scene by interactively switching viewports. Ho wever , the huge data volume of the 360-degree video limits its remote applications via network. T o provide high quality of experience ( QoE ) for remote web users, this paper presents a tile-based adaptive streaming method for 360-degree videos. First, we pr opose a simple yet effecti ve rate adaptation algorithm to determine the requested bitrate for downloading the curr ent video segment by considering the balance between the buffer length and video quality . Then, we pr opose to use a Gaussian model to predict the field of view at the beginning of each requested video segment. T o deal with the circumstance that the view angle is switched during the display of a video segment, we propose to download all the tiles in the 360-degree video with different priorities based on a Zipf model. Finally , in order to allocate bitrates for all the tiles, a two-stage optimization algorithm is pr oposed to preser ve the quality of tiles in FoV and guarantee the spatial and temporal smoothness. Experimental results demonstrate the effectiveness and advantage of the proposed method compar ed with the state-of-the-art methods. That is, our method preserv es both the quality and the smoothness of tiles in F oV , thus pr oviding the best QoE for users. Index T erms —360-degree video, field of view , rate adaptation, D ASH, video compression, quality of experience. I . I N T RO D U C T I O N W ITH great advances in multimedia and computer tech- nologies, augmented and virtual reality (AR/VR) are becoming more and more popular in both academic and industrial communities [1]. As one kind of immersive media for representing AR/VR scenes, the 360-degree video can provide users with more immersi ve experience than traditional monoscopic videos. By making use of various head-mounted displays (HMDs) that can detect head movements of users and This work was supported in part by the National Natural Science Foundation of China under Grants 61571274 and 61871342; in part by the Shan- dong Natural Science Funds for Distinguished Y oung Scholar under Grant JQ201614; in part by the National Ke y R&D Program of China under Grants 2018YFC0831003; in part by the Y oung Scholars Program of Shandong Univ ersity (YSPSDU) under Grant 2015WLJH39. The corresponding author is Junhui Hou. H. Y uan is with the School of Control Science and Engineering, Shandong Univ ersity , Ji’nan 250061, China (Email: huiyuan@sdu.edu.cn). S. Zhao is with the School of Information Science and Engineering, Shandong Uni versity , Qingdao, 266237, China (Email: zhaoshiyun@yeah.net). J. Hou, X. W ei and S. Kwong are with the Department of Computer Science, City Univ ersity of Hong Kong, K o wloon, Hong K ong (Email: jh.hou@cityu.edu.hk, xuekaiwei2-c@my .cityu.edu.hk, and cssamk@cityu.edu.hk). Copyright (c) 2019 IEEE. Personal use of this material is permitted. Howev er , permission to use this material for any other purposes must be obtained from the IEEE by sending an email to pubspermis- sions@ieee.org. provide corresponding viewport for users, such as Samsung Gear VR Glass, Oculus Rift, and HTC V i ve, users can enjoy the scene as if they were there. Howe ver , due to the huge data volume and the complex rendering algorithms, it is difficult to achiev e all the functions (e.g. storage, rendering, interaction, etc.) of a VR system for a mobile device. Therefore, the sce- nario that a user interacts with a remote webserver (such as the edge computing node and content distribution server) to enjoy VR/AR applications is taken into account. In this case, users will interactively request video content of different viewports from the webserv er . The function of the webserver is to storage 360-degree videos and send video content to users based on their requirements. Due to the div erse network en vironments between users and the webserver , how to efficiently transmit 360-degree videos to users is becoming a critical problem. T o deal with div erse network en vironments, adaptiv e streaming techniques, e.g. Hypertext Transfer Protocol (HTTP) streaming, are becoming more and more popular in these years [2][3]. Under this circumstance, the Moving Picture Experts Group (MPEG) of International Standardization Organization (ISO)/International Electro technical Commission (IEC) has standardized a protocol named Dynamic Adaptive Streaming ov er HTTP (DASH) [4][5]. Owing to its highly adapti ve property , D ASH is a reliable solution for real-time 360-degree video transmission. In a D ASH-based video deliv ery system, media content is first divided into sev eral segments (or chunks) [6] with the same playback duration, e.g., 2 seconds. Then, each segment is encoded with different bitrates corresponding to different quality lev els and stored in a webserver . The webserv er will generate a manifest (MPD) file that records the description of all the av ailable segments of a video, e.g., URL addresses, segment lengths, quality levels, resolutions, etc. The user will request to download segments with different bitrates from the webserver to adapt to the network throughput variation according to the receiv ed MPD file, user preference, etc. Considering the fact that users can only see the field of view (FoV) that contains the current region of interest (ROI) of users [7], the server allows to transmit a part of a 360-degree video to the user . Fortunately , there is a “tile” concept that can support to di vide a high resolution video into sev eral parts in the H.265/High Efficienc y V ideo Coding (HEVC) video coding standard [8]. Therefore, in addition to dividing video content into segments along the temporal axis, we can also divide the 360-degree video into multiple tiles spatially to satisfy user’ s viewing preference adaptiv ely . Each tile is then encoded independently into different versions with multiple 2 bitrates and stored in the webserv er . The webserver will deliver the tiles that contain the current FoV with high quality ac- cording to the user’ s request so as to provide higher quality of experience ( QoE ) with low bandwidth consumption for users. T ile-based 360-degree video streaming can provide a variety of viewpoints for users adapti vely , but it may also suffer from high viewport-switching delay . The reason is that there is no video content of the other vie wports in the currently deli vered video content. During the display time of the current video segment, delay occurs when the user changes his/her vie wport suddenly . Therefore, not only the tiles that contain the current FoV but also the other tiles should be transmitted to the user . T o sav e bandwidth consumption, the low bitrate versions of the tiles that may not be viewed can be deli v ered. Besides, because of the time and space discrete characteristics of tile-based 360- degree video, the effects of spatial and temporal smoothness on QoE should also be considered [9][10] during the deli very . Consequently , the challenges of adaptiv ely streaming a tile- based 360-degree video lie in (a) ho w to design a simple yet effecti v e rate adaptation algorithm to tackle the network throughput variation; (b) how to predict the view angle at the beginning of each request, and the priority of each tile in the current requested video segment and (c) how to find the best bitrate combination of all the tiles by considering not only the video quality but also the spatial and temporal smoothness to cope with sudden view switching in the display duration of a video segment. Accordingly , to improve user QoE , we first propose a rate adaptation algorithm to adapt to the div erse network throughput. Then, a Gaussian model [11] and a Zipf model [12] are used to predict view angle at the beginning of each request and the priority of each tile during the display time of a video segment. Finally , we model the bitrates combination problem as an optimization problem by considering both the video quality and the spatial-temporal smoothness of FoVs. The rest of this paper is or ganized as follo ws. In Section II, basic concepts and related work are briefly revie wed. Then, the proposed rate adaption algorithm, view angle prediction, and the solution of the bitrates combination problem are giv en in Section III. Experimental results and analyses are provided in Section IV . Finally , Section V concludes this paper . I I . B AS I C C O N C E P T S A N D R E L A T E D W O R K In this section the basic concepts of the tile-based 360- degree video and the D ASH system are revie wed first. Then, the related work of rate adaptation and bit allocation algo- rithms are briefly introduced. A. T ile-based 360-degr ee V ideo The 360-degree video is usually captured by a set of cameras that are fixed on a sphere or a circle uniformly [13]. After aggre gating and stitching [14] the images captured by different cameras, a panoramic image can be generated, and finally formed to be a 360-degree video. Because it is hard to store and operate the 360-degree video in the spherical domain, the 360-degree video is usually projected onto a Fig. 1. An e xample of the tile-based 360-degree video. two-dimensional (2D) plane [15][16], and represented by the commonly used equirectangular format (ERP) [17][18]. W ith the help of HMDs, users will enjoy the spherical video content by re-projecting the ERP formatted images onto a sphere. The resolution of an ERP image is usually at least 3840 × 1920 (4K). Limited by the FoV (usually , 90-degree and 110-degree in the vertical and horizontal directions, respectively), users can only enjoy a part of the whole 360-degree video at a time [19]. Therefore, to deal with the huge data volume, it is better to process and transmit a part of the 360-degree video. In H.265/HEVC [8][20], the concept of tile is to divide a video picture into re gular-sized, rectangular regions which can be independently encoded and decoded in order to enable parallel processing architectures and spatial random access to local regions. The tile-based adaptive streaming is a suitable way for transmitting 360-degree videos as the visible region of the video is only a small part of the whole video content. As shown in Fig. 1, after projecting the sphere onto a 2D plane, a 360-degree video picture with ERP format is di vided into 24 tiles with 4 ro ws and 6 columns, the corresponding area of FoV is shown by the red block. When the user changes his/her head to another direction from the current view angle, the FoV will be switched accordingly . Dif ferent tile partitions result in different panoramic experience. Existing studies have presented efficient methods of how to cut a 360-degree video into suitable sized tiles [21]-[24]. By in vestigating the tradeof f between bitrate o verhead, view switching adapti vity , and the bandwidth consumption, the partition method with 4 ro ws and 6 columns is the recommended [20]. B. DASH System In a DASH system, videos are encoded into different bitrates and divided into sev eral segments with the same display duration, e.g. 2 seconds, for the purpose of satisfying user requirement. For the tile-based 360-degree video, as shown in Fig. 2, a 360-degree video is temporally di vided into segments and then spatially cut into tiles. The tiles are then encoded with different bitrates by an encoder, e.g., H.265/HEVC. The webserver in the D ASH system will store the encoded stream of each tile, and generate a corresponding MPD file that records URL address of each stream, segment length (represented by display time), spatial resolutions, quality le vels (corresponding to different bitrate versions), and the spatial relationship description (SRD) [23] which describes the spatial information of rectangular tiles in a video content so as to locate the FoV accurately . The user client first downloads the MPD file by using HTTP protocol from the server . Then it will parse the MPD file 3 Fig. 2. DASH system architecture of a tile-based 360-degree video streaming. and request the tiles with desired quality le vels according to the buffer length, av ailable throughput and user’ s FoV . In this procedure, the deliv ery service has to adapt to the view switching of the user as well as the network throughput fluctuation. Finally , the received tiles are decoded and used to render the visual content with the help of HMDs. C. Rate Adaptation Algorithms T o achieve network throughput adaptation and decrease the number of display interruptions, rate adaption algorithms are usually designed based on the buf fer occupancy and through- put estimation [25]. In brief, there are two main kinds of bitrate adaptation algorithms, i.e., quality-first-based algorithm (QF A) and buf fer-first-based algorithm (BF A). The QF A [26][27] tries to download video segments with relativ ely high available video quality representation (i.e., bitrate) to match the predicted bandwidth no matter how lar ge the buf fer is. Howe ver , this kind of algorithm will lead to frequent quality fluctuations, which is extremely annoying to users [28]. In contrast, the BF A [29][30] aims to remain the buf fer length stable so as to ensure continuous and smooth video playback. Howe ver , the receiv ed video quality lev els in this algorithm are not taken in first consideration. The user client always plans to fill a predefined buffer length with the lowest video quality level. When the buf fer length is larger than a predefined buf fer length, it tries to request video segments with the next higher quality representation until buf fer length is lo wer than the predefined buf fer length. The BF A prefers to fill its predefined buf fer length before switching to higher bitrates. Thus, it av oids the risk of inaccurate throughput esti- mation, and stabilizes the buf fer so as to ensure smooth video playback. But, BF A usually do wnloads video se gments with significantly lower qualities than the QF A, causing abundant bandwidth waste. Hence, there should be a trade-off between QF A and BF A. A detailed revie w of the rate adaptation algorithms for adaptive streaming is shown in [31]. On the basis of QF A and BF A, we also propose a simple but ef fectiv e rate adaptation algorithm in Part A of Section III . D. Bit Allocation Algorithms Besides rate adaptation algorithm, bit allocation algorithm is another critical technology that can af fect the user QoE . F or a tile-based 360-de gree video, the problem can be described as how to optimally allocate a target bitrate to all the tiles so as to guarantee the quality of the FoV as well as spatial and temporal smoothness of different tiles. Y un and Chung [32] proposed a bit allocation algorithm to minimize the vie w-switching delay by employing a buf fer control, parallel streaming, and server push scheme. In this algorithms, all the possible views that may be switched to are equally treated. Ban et al. [33] proposed a QoE -dri ven optimization framew ork under limited network for tile-based adaptiv e 360-degeree video streaming. The bitrates of all the tiles are determined optimally , aiming at maximizing the ov erall quality and minimizing the spatial and temporal quality variation of all the tiles without considering the FoV . Because users can only see the video content in FoV , most researchers focused on how to allocate bitrates for tiles by considering the priorities of tiles in FoV . Rossi and T oni [34] proposed an algorithm to choose the best set of tiles by solving an integer linear programming problem. Chao et al. [35] proposed an optimal bitrate allocation scheme for a no vel multiple views navigation rule, allo wing the clients to maxi- mize the video quality over D ASH. Xie et al. [36] modeled the perceptual impact of the quality variations (through adapting the quantization step-size and spatial resolution) with respect to the refinement duration, and yield a product of two closed- form e xponential functions. Y u et al. [37] proposed a conv olu- tional neural network (ConvNet) assisted seamless multi-view video streaming system. In this framew ork, Con vNet assisted multi-view representation algorithm and a bit allocation mech- anism guided by a navig ation model were combined to provide flexible interactivity and seamless navigation under network bandwidth fluctuations without compromising on multi-view video compression efficienc y . Carlsson et al. [38] proposed a novel multi-video stream bundle framew ork for interactiv e video playback that allows users to dynamically switch among multiple parallel video streams capturing the same images from dif ferent viewpoints. Liu et al. [19] described a server - side rate adaptation strategy for 360-degree video streaming, in which a tile visibility probability model is established. Y ang et al. [39] proposed a DASH-based 360-de gree video adap- tiv e transmission algorithm based on user’ s viewport. In this algorithms, the network throughput, video buf fer length, and viewport were considered for adapti ve decision so that it could effecti vely sav e the bandwidth. Zhang et al. [40] designed a streaming transmission strategy to select the optimal set of views for users to download, such that the navigation quality experienced of the user can be optimized with the bandwidth constraint. T o sum up, these algorithms try to improve user e xperience from aspects of average quality , display continuity , quality variation, etc. Due to the space and time partition of 360- degree videos in tile-based adaptiv e streaming, how to pre- serve the spatial and temporal smoothness for FoVs is still a challenge. I I I . T H E P RO P O S E D M E T H O D As shown in Fig. 3, in a tile-based 360-degree video adaptiv e streaming system, a 360-degree video with the ERP 4 Fig. 3. The storage structure of tile-based videos for adapti ve streaming. Fig. 4. System diagram of the proposed method. format is first temporally partitioned into L segments with the same display duration (e.g., 2 seconds). Each segment is then cut into N tiles spatially . Consequently , each tile is encoded into U quality levels (or bitrate versions), and the corresponding bitrate of the n -th tile with the u -th quality lev el in the l -th segment is denoted as R l,n,u , l ∈ { 1 , · · · , L } , n ∈ { 1 , · · · , N } , u ∈ { 1 , · · · , U } . Owing to the additional spatial division, the representation of a tile-based 360-degree video is more flexible than that of a traditional video that is only temporally divided. In this system, the user clients will first determine the requested bitrate based on the buf fer length and the predicted throughput, and then do wnload the video segment whose bitrate is the closest to the requested bitrate. Since a video segment is di vided into several tiles, the combination of those tiles with different bitrates must be determined so as to provide the highest QoE under the constraint of the requested bitrate. In the following, as shown in Fig. 4, we will first present a simple yet ef fective rate adaption algorithm. Then, we propose to use a Gaussian distribution-based FoV switching model to predict the view angle trajectory of each segment and Zipf model-based tile priority model to determine the priority of each tile in a segment. After that, we propose a bit allocation algorithm to find the best combination of tiles based on the tile priorities. A. Buffer-quality-based Rate Adaptation Algorithm Inspired by QF A [26][27] and BF A [29][30], we propose a simple yet effecti ve rate adaption algorithm, namely buf fer- quality-based algorithm (BQA), which considers both the buf fer length and video quality to guarantee the quality and smoothness of the recei ved videos. Since the rate adaptation algorithm is independent of the video content, we explain it by taking a video without the tile partition for simplicity . Let b cur denote the current b uffer length. In the proposed algorithm, we set two buf fer thresholds ( b min and b max ). At the beginning, the user client will request the video segments with the lowest quality to quickly fill the buf fer until the buf fer length is equal to b 0 which is usually set to be 2 seconds. Then, at a certain decision time, the user client will first predict the throughput T cur by the download time and total bitrate of previously downloaded L 0 video segments: T cur = 1 L 0 X l l − L 0 +1 r l · t 0 t download,l , (1) where r l and t download,l denote the bitrate and the download time of the l -th segment, respectiv ely . And the playback duration of a segment is equal to t 0 (e.g., 2 seconds). The user client will then calculate the segment quality lev el ( u cur ) whose corresponding bitrate is less than and closest to T cur . When b cur < b min , the user client will request the video segment with the next lower quality le vel than u cur ; when b cur > b max , the user client will request the video segment with the next higher quality lev el than u cur ; otherwise, when b min ≤ b cur ≤ b max , the user client will request the video segment with the quality lev el u cur . According to the buf fer length and predicted throughput capacity , we can get the final selected segment quality le vel u select and the corresponding bitrate R l,r equest . In summary , the proposed rate adaption algorithm first guarantees the minimal buf fer length, and then controls the b uf fer length such that it fluctuates between the two predefined buf fer thresholds b min and b max . Algorithm 1 shows the detailed procedure of our proposed rate adaptation method. Algorithm 1 : Rate Adaptation Algorithm f or Video Segment Request 1: Initially , the user client requests the minimum bitrate from the server to quickly establish the initial b uffer length b 0 . 2: while l ≤ L do 3: predict throughput T cur and calculate quality level u cur 4: if b cur < b min then 5: u select = u cur − 1 6: else if b min ≤ b cur ≤ b max then 7: u select = u cur 8: else 9: u select = u cur + 1 10: end if 11: l = l + 1 12: end while For the tile-based 360-de gree video, as there are no explicit quality lev els of a segment, we hav e to define a rule to confirm the requested bitrate. Based on Algorithm 1 , when b cur < b min , the requested bitrate R l,r equest should be lower than throughput T cur ; when b min ≤ b cur ≤ b max , the requested bitrate R l,r equest should match to T cur ; when b cur > b max , R l,r equest should be higher than T cur . W e define the following function to calculate R l,r equest : R l,r equest = ε · T cur , (2) where ε is the coefficient depending on the current buf fer length: ε = b cur b min b cur < b min , 1 b min ≤ b cur ≤ b max , b cur b max b cur > b max . (3) 5 B. F oV Switching and T ile Priority Model For remote applications, to deal with the limited and varied network en vironment, the user client must pre-fetch enough bit streams to fill the buf fer . At the beginning (buf fer is empty), the FoV can be calculated directly by the HMD of the user . After that, when the buf fer is not empty , it is very important to predict the FoV accurately [41]-[43]. Existing FoV estimation methods can be roughly classified into three categories, i.e., data driven approaches [44], probability model based approaches [35][45] and motion saliency detection based approaches [46]. Although data driv en approaches and motion saliency detection based approaches achie ve good perfor - mance, the viewport movement depends only on the subjecti ve will of a user, and it can ne ver be predicted accurately . Because immersion also depends on audio and motion perception apart from video content [47]-[49]. In addition, the implementation complexity of these approaches is also high. In this paper , from the perspecti ve of a practical application, we choose the probability model based approach to predict the FoV of users, o wing to its low computational complexity . Specifically , the Gaussian model [11] is employed to determine the FoVs at the beginning of each video segment. First, we define 20 FoV patterns as shown in Fig. 5 by considering the projection relationship between the spherical structure and the ERP format. When requesting video segments, the variation of the FoV pattern follows the Normal distribution, i.e., N ( µ, σ 2 ) , where the mean µ and variance σ 2 reflect the mean value and dispersion degree of the FoV pattern variation, respectiv ely . Based on the assumption that the center of a picture is usually the ROI, we restrict the mean value of the Gaussian model to be 11 corresponding to the 11-th FoV pattern, as shown in Fig.5. It is worth pointing out the mean value can also be defined based on other R OI or saliency detection algorithms. The Gaussian model will generate a random value ranging from 1 to 20 to determine the FoV of a video segment, as shown in Fig. 6. T o deal with the unpredictable change of the vie w angle during the display time of a video segment, the webserv er has to transmit all tiles to the user . In order to save bandwidth, a Zipf model [12] is used to calculate the priority of each tile in a video segment. Thus, the high (resp. low) quality v ersions of the tiles with high (resp. low) priorities can be transmitted under the constraint of the requested bitrate. First, we set 4 priorities for tiles according to the distance from FoV to each tile. As shown in Fig. 5, dif ferent colors represent tiles with different priorities, which are red , orang e , gr een and blue , respecti vely . W e assume the priority of a tile decreases with its distance to the FO V . Therefore, the priorities of red , orange , green and blue regions are in a descending order . In order to quantitativ ely calculate the priority of each region, the Zipf model is used. Let p l,c,ϕ denote the priority of the ϕ -th tile in a color region c , where c ∈ C = { “ r ed ” , “ or ang e ” , “ g r een ” and “ blue ” } in l -th segment, and π c be the number of tiles in the color region c . Note that π c depends on the FoV patterns shown in Fig. 5, and the priority of each tile in the same color region is the same. Accordingly , from the basis of Zipf model, the priority Fig. 5. FoV patterns,the red area denotes the FoV of each pattern. (a) (b) Fig. 6. Gaussian model-based FoV trajectory examples, (a) σ 2 =4, (b) σ 2 =9. of each tile can be calculated by solving X c ∈ C π c · p l,c,ϕ = 1 , (4) where p l,c,ϕ = d − 1 l,c , (5) and d l,c denotes the relative distance from the color region c to the red region (FoV). T o solv e Eq. (4), we empirically set d l, “ or ange ” = 2 · d l, “ r ed ” , d l, “ g reen ” = 3 · d l, “ r ed ” , and d l, “ blue ” = 4 · d l, “ r ed ” . C. Bit Allocation Algorithm for T iles Based on the requested bitrate R l,r equest , the predicted FoV and the priority ( p l,n , n ∈ { 1 , · · · , N } ) of the n -th tile in the l -th segment, the remaining problem is how to determine the bitrate combination of tiles to improve the user QoE , which can be formulated as a bit allocation problem, i.e., how to allocate appropriate bitrates for all the tiles with the constraint of a total target bitrate (the requested bitrate). Here, we propose a coarse-to-fine algorithm to solve the problem. Stage 1: Coarse Bit Allocation 6 In the first stage, we use the weighted distortion of tiles in the l -th requested segment as the objectiv e function, and model the problem as min R l,n X N n =1 ( p l,n D l,n ) , s.t. X N n =1 R l,n ≤ R l,r equest , (6) where R l,n and D l,n denote the allocated bitrate and the corresponding distortion of the n -th tile, respectiv ely . T o solve the problem, the rate distortion function must be explicitly determined. T o find the analytic solution, mean squared error (MSE) is used as the distortion metric. Accord- ing to the Cauchy distribution-based rate distortion function [50][51], the relationship between distortion D l,n and rate R l,n can be written as D l,n = α l,n · R l,n − β l,n , (7) where α l,n , β l,n > 0 are model parameters that can be obtained at the step of video encoding. Since the Cauchy-based rate distortion function is conv ex, the constrained optimization problem of (6) can be con verted into an unconstrained optimization problem by Lagrange mul- tiplier method: min J R l,n = X N n =1 ( p l,n D l,n ) + λ X N n =1 R l,n − R l,r equest , (8) and solved by Karush-Kuhn-T ucher (KKT) conditions: ∂ J ∂ R l, 1 = 0 ∂ J ∂ R l, 2 = 0 · · · ∂ J ∂ R l,N = 0 ∂ J ∂ λ = 0 , (9) where λ is the Lagrange multiplier . Stage 2: F ine Bit Allocation It is worth pointing out that the resulting R l,n from stage 1 may not be equal to any stored bitrate versions of tiles, i.e., R l,n,u , u ∈ { 1 , · · · , U } . Therefore, the tiles whose bitrate versions are closest to, but not larger than R l,n are selected first. For the selected tiles with certain quality levels, the corre- sponding bitrates are denoted by R 0 l,n , which is the solution of Eq. (6). In order to further improve the user QoE , the av erage quality , the spatial and temporal smoothness of tiles in an FoV are tak en into account to refine the quality le vels of tiles in an FoV . Assume that there are M (0 < M < N ) tiles in an FoV . The bitrate and distortion of the m -th tile in the FoV of the l -th segment are denoted by R 0 l,F oV ,m and D 0 l,F oV ,m , respectiv ely , whereas the bitrate and distortion of the other tiles of the l -th segment are denoted by R 0 l,N F oV ,n and D 0 l,N F oV ,n , respectiv ely . The objecti ve function of the refinement procedure is de- fined as F = θ 1 · D l,F oV ,av g + θ 2 · D l,F oV ,ss + θ 3 · D l,F oV ,ts , (10) where θ 1 , θ 2 and θ 3 are weighted coefficients of a verage quality of FoV , spatial smoothness, and temporal smoothness, respectiv ely , which meet the condition: θ 1 + θ 2 + θ 3 = 1 . Under extreme conditions, if we only consider the average quality of FoV , the parameters should be set θ 1 = 1 , θ 2 = 0 and θ 3 = 0 . And if we only consider the spatial and temporal consistency , the parameters could be set θ 1 = 0 , θ 2 = 0 . 5 and θ 3 = 0 . 5 . These three parameters can be set according to the characteristics of the video content. Changing the values of these three parameters will not cause the algorithm to crash. If the video content is complicated and the spatiotemporal texture changes greatly between tiles, we increase the values of θ 2 and θ 3 to ensure the spatial and temporal consistency , while the video content is simple and consistent, we raise the value of θ 1 to ensure the av erage quality of FoV . The av erage quality D l,F oV ,av g of the FoV can be calculated by D l,F oV ,av g = 1 M X M m =1 D F l,F oV ,m , (11) where D F l,F oV ,m is the distortion of the m -th tile in the FoV that should be determined, the spatial smoothness D l,F oV ,ss of the tiles in the FoV is represented by the standard deri vation: D l,F oV ,ss = 1 M X M m =1 D F l,F oV ,m − D l,F oV ,av g 2 1 / 2 , (12) and the temporal smoothness D l,F oV ,ts is defined as D l,F oV ,ts = 1 2 | D l − 1 ,F oV ,av g − D l,F oV ,av g | . (13) By constraining the total bitrate and the av erage distortion of tiles in the FoV to be not lar ger than the predefined thresholds, i.e., R th and D th , the problem of the refinement procedure can be formulated as min ( R F l,F oV,m , D F l,F oV,m ) F , s.t. P M m =1 D F l,F oV ,m − P M m =1 D 0 l,F oV ,m ≤ D th P M m =1 R F l,F oV ,m − P M m =1 R 0 l,F oV ,m ≤ R th P M m =1 R F l,F oV ,m + P N − M n =1 R 0 l,N F oV ,n ≤ R l,r equest . (14) Because the problem in the objective function of Eq. (14) is non-con vex, even not analytical, we used a search-based method to solv e it, as shown in Algorithm 2 in which R 0 l,F oV ,m and D 0 l,F oV ,m are used as the starting point. Fortunately , the search space is not too large ( M tiles with U quality lev els in the FoV , resulting in U M possible combinations), and the solution can be found ef fectiv ely and efficiently by the search- based method. I V . E X P E R I M E N TA L R E S U L T S In this section, we will first verify the performance of the proposed buf fer-quality-based rate adaptation algorithm and then compare the proposed tile-based bit allocation algorithm with the baseline and two state-of-the-art algorithms. 7 Algorithm 2 : Coarse to Fine Bit Allocation Algorithm Stage 1: Coarse Bit Allocation 1: Confirm the rate distortion model parameters of α and β for all the tiles in the l -th segment. 2: Solve (8) by KKT conditions as shown in (9) to obtain R l,n . Stage 2: Fine Bit Allocation 1: Confirm the starting point, R 0 l,F oV ,m and D 0 l,F oV ,m . Note that D 0 l,F oV ,m corresponds to a quality lev el u l,F oV ,m . 2: Build a candidate set A for possible combinations of tiles in FoV , i.e., the initial set A = { a 1 } , where a 1 = u l,F oV , 1 , · · · , u l,F oV ,M T . Note the initial number of elements of A is J = 1 , 3: set j = 1 4: while j ≤ J 5: for m ← 1 to M 6: Confirm the quality levels of a j = u l,F oV , 1 , · · · , u l,F oV ,m , · · · , u l,F oV ,M T , and fix the quality level of all the other tiles except for the m -th tile 7: for k ← 1 to U 8: Change the quality level of the m -th tile to be u k l,F oV,m 9: Check the constraints of (14) 10: if (14) holds 11: if u l,F oV , 1 , · · · , u k l,F oV,m , · · · , u l,F oV ,M T not exists in A 12: a J +1 = u l,F oV , 1 , · · · , u k l,F oV,m , · · · , u l,F oV ,M T is added to A , 13: J ← J + 1 14: end if 15: end if 16: end for 17: end for 18: j ← j + 1 19: end while 20: Count the number (denoted by J ) of elements in set A 21: for i ← 1 to J 22: Calculate F i 23: if F i < F i − 1 24: R F l,F oV ,m = R i l,F oV ,m 25: end if 26: end for A. P erformance of the Buffer -quality-based Rate Adaptation Algorithm The proposed buf fer-quality-based algorithm (denoted as BQA ) is compared with QF A [26][27] and BF A [29][30]. As shown in Fig. 7, two kinds of network en vironments, i.e., stable channel with a fixed bandwidth of 10Mbps and Marko- vian channel with a transition probability of p t =0.5 [27], were simulated. In the proposed BQA , b min and b max are set to be 10 seconds and 12 seconds, respectiv ely . As shown in Fig. 8, because QF A will request the bitrates that match (less than or equal to) the bandwidth, its buf fer length is smaller than BF A and BQA . For the BF A , the buf fer length is kept at a relativ ely high le vel, but the downloaded segment bitrate fluctuates seriously , which is definitely not good for the user’ s experience. Besides, the buf fer length is not stable. At the same time, we can also see that the proposed BQA makes a compromise between the QF A and BF A . The bitrates of the downloaded video segments are comparatively stable, while the buf fer variations are also controlled at the predefined range (from 10 seconds to 12 seconds). Based on the proposed BQA , we will further compare the tile-based bit allocation algorithms. (a) (b) Fig. 7. T wo kinds of network channel en vironments, (a) fixed bandwidth of 10Mbps, (b) Markovian channel. (a) (b) (c) (d) Fig. 8. Simulation results, (a) requested segment bitrates under fixed 10Mbps bandwidth channel, (b) buffer length under fixed 10Mbps bandwidth channel, (c) requested segment bitrates under Markovian channel, (b) buf fer length under Markovian channel. B. Comparison of the T ile-based Bit Allocation Algorithms Three 360-degree video sequences AerialCity (with camera motion), DrivingInCountry (with camera motion), and P ole- V ault (without camera motion), with resolution of 3840 × 1920 are used as test sequences. The tested video sequences are spatially partitioned into 4 rows and 6 columns, i.e., 24 tiles. Each tile is then temporally di vided into multiple seg- ments with a fixed display time of 2 seconds. Afterwards, each tile is encoded with 16 quality lev els (i.e., U =16) by H.265/HEVC test model version 16.14 (HM.16.14). The cor- responding bitrates are { 150kbps, 300kbps, 450kbps, 600kbps, 750kbps, 900kbps, 1050kbps, 1200kbps, 1350kbps, 1500kbps, 1650kbps, 1800kbps, 1950kbps, 2100kbps, 2250kbps and 2400kbps } . Because the display time of the tested sequences is only 10 seconds (5 segments), we loop the display in the experiments. Note that the rate-distortion model parameters α l,n and β l,n of the n -th tile in the l -th se gment in Eq.(7) can be calculated by statistical regression based on the encoding results, as shown in Fig. 9, in which “r1c1”, “r1c2”, etc., denote the corresponding tiles located at row 1 and column 1, row 1 and column 2, etc. W e can see that the model parameters of tiles are quite different. Therefore, in order to improve user QoE , 8 (a) (b) Fig. 9. Rate-distortion model parameters (a) α l,n , (b) β l,n of the n -th tile in the l -th segment. it is not enough to only consider the bitrates. According to the random walk theory [52], the initial viewport is selected randomly . Then the Gaussian model is used to predict the viewport at the beginning of each segment with µ =11 and σ 2 =4 for video sequences with camera motion (i.e. AerialCity and DrivingInCountry ) and µ =11 and σ 2 =9 for video sequences without camera motion (i.e. P oleV ault ). After that, the Zipf model is used to determine the priority of each tile in a segment. For the spatial and temporal smoothness in Eq. (10), we set θ 1 =0.2, θ 2 =0.3 and θ 3 =0.5 empirically . Besides, D th and R th for solving (14) are set to be 0.4 and 2Mbps, respectively . T o demonstrate the advantage of our proposed bit alloca- tion method, the av erage allocation method (denoted by AA Method ) is used as the baseline. The AA Method allocates the av ailable bitrates to all the tiles equally . Besides, the state-of- the-art algorithms including adaptiv e allocation method [38] (denoted by AdapA Method ) and partial delivery method [20](denoted by PD Method ), are also compared. In the AdapA Method , the requested bitrate will first be allocated to the tiles with relati vely high priorities (e.g., tiles in F oV). Note that some tiles with low priorities may not be downloaded depending on the requested bitrate, the current view angle, and the view switching probability . The PD Method only requests the tiles in the FoV with the highest possible quality representation and all other tiles are not requested at all. Besides, we also compared the performance of the first stage of the proposed method (denoted by Pr oposed Method w/o ST ), i.e., the solution of Eq. (6) in which the spatial and temporal smoothness are not considered. T o ensure the f airness in the experiments, the BQA is used to determine the requested video bitrates for all the compared bit allocation methods, and the buf fer thresholds b min and b max are set as 10 seconds and 20 seconds in the experiments. The performance is ev aluated by the following quotas: (a) actual downloaded bitrates of tiles in a segment (denoted by Actual Bitrate ); (b) weighted PSNR of all tiles in a video segment (denoted by W eighted PSNR ,i.e., W eighted PSNR = X N n =1 p l,n × 10log 10 255 2 D l,n , (15) where p l,n and D l,n represent the priority and the distortion of the n -th tile in the l -th video segment; (c) actual downloaded bitrates of tiles in FoV (denoted by F oV Actual Bitrate ); Fig. 10. Server bandwidth with staged variation. (d) average PSNR of tiles in FoV , i.e., (denoted by F oV A verag e PSNR ); (e) standard deviation of PSNR of tiles in FoV (denoted by F oV PSNR Std ); (f) average PSNR difference of FoVs between two consec- utiv e segments (denoted by F oV PSNR T emporal Differ ence ); (g) Buffer length ; (h) F value , i.e., the objection value of Eq. (10). W e then established a test platform for video deliv ery based on the guidelines of DASH Industry Form [53]. The test platform consists of two parts: an Apache HTTP webserver and a user client. The proposed algorithm is validated under two network environments: Case1: the network connection between the webserver and the user client is controlled by DummyNet [54]; Case 2: the server and the user client ar e connected by the actual campus wir eless network of Shandong University . For Case 1 , the staged throughput variation [55], as shown in Fig.10, is monitored periodically . W e set L 0 in Eq. (1) to be 1, i.e., the current bandwidth is predicted by download time and bitrate of the previous segment. For Case 2 , because of the frequent fluctuations in the actual network throughput, the user client is more likely to suffer from buf fer starvation. T o tackle this problem, we set L 0 =4. Besides, we conduct the experiments for 10 times, and the a verage results are reported. (i) Results of Case 1 Because Dummynet cannot control the network throughput steadily , the actual channel throughput fluctuates irregularly based on the curve of Fig. 10. Therefore, even when the bandwidth is fixed, the actual bitrates will also fluctuate. Detailed experimental results of the three video sequences are shown in Figs.11-13. T aking AerialCity as an example, from Fig.11(a), we can see that the Actual Bitrates of the fiv e methods are similar . When ev aluating the F oV Actual Bitrate , as shown in Fig. 11(b), the F oV Actual Bitrates of the AdpaA Method and the PD Method are obviously lar ger than the others because the requested bitrate will be first allocated to tiles in an FoV , while the remaining tiles are not be downloaded. In addition, the F oV Actual Bitrate of the AA method is the lowest. Figs.11(c) and (d) compare the W eighted PSNR and F oV A verag e PSNR of each segment, respectiv ely . The W eighted PSNRs of the AdpaA Method and the PD Method are 9 (a) (b) (c) (d) (e) (f) (g) (h) Fig. 11. Results of Case 1 with video sequence AerialCity . T ABLE I Q UA NT I T A T I V E C O M P A R I S IO N S O F C A S E 1 W I T H V I D E O S E Q UE N C E A E RI A L C IT Y Sudden view switching F oV Actual F oV F oV F oV PSNR probability in the duration Method Bitrate A verage PSNR Std T emporal F value QoE of each video segment (Mbps) PSNR (dB) Differ ence 0% AA 1.61 38.82 2.01 1.75 4.4533 3422.84 AdapA 9.34 41.42 1.80 1.20 2.1424 5745.09 PD 8.94 41.44 1.80 1.08 2.0610 6740.97 Proposed w/o ST 3.10 39.78 1.35 1.23 2.7815 5663.52 Proposed 3.14 39.76 1.26 1.17 2.7216 5757.89 5% AA 1.63 38.87 1.99 1.77 4.4177 3414.86 AdapA 9.16 40.63 1.89 1.99 636.1096 4643.83 PD 8.74 40.55 1.94 1.95 730.1807 5512.03 Proposed w/o ST 3.06 39.79 1.34 1.23 2.7745 5657.39 Proposed 3.10 39.78 1.25 1.18 2.7147 5749.24 10% AA 1.64 38.90 1.97 1.76 4.3906 3422.88 AdapA 8.94 39.60 1.95 3.00 1415.6537 3228.17 PD 8.53 39.46 1.90 3.03 1506.5815 4005.35 Proposed w/o ST 3.02 39.78 1.33 1.23 2.7779 5655.92 Proposed 3.06 39.77 1.25 1.19 2.7230 5739.96 20% AA 1.65 38.90 1.96 1.77 4.3836 3411.31 AdapA 8.50 37.80 2.13 4.69 2811.7930 836.50 PD 8.12 37.63 1.99 4.75 2888.1290 1563.43 Proposed w/o ST 2.96 39.74 1.32 1.22 2.7882 5660.95 Proposed 2.99 39.73 1.25 1.18 2.7399 5736.80 obviously lower than the others because some tiles that do not belong to FoVs are not downloaded. Nev ertheless, the F oV A verage PSNR of the PD Method is higher because it prioritizes the tiles in an FoV . As expected, the AA Method has the lowest F oV A verage PSNR , and the v alues of the Proposed Method w/o ST and the Proposed Method are in between with the PD Method and the AA Method . When comparing the F oV PSNR Std sho wn in Fig. 11(e), we can see that the F oV PSNR Std of the Proposed Method is the smallest. For the F oV PSNR T emporal Differ ence , the PD method is the smallest (followed by the Proposed Method ) for AerialCity and DrivingInCountry , while that of the Pr oposed Method is the smallest for P oleV ault . The reason is that the PD method always guarantees the highest FoV quality of all the video segments by ignoring the other tiles. Moreov er , from Fig. 11(g), the buf fer length of the Proposed Method is more stable than the other methods, and the buf fer of the PD Method continues to grow because it uses the bandwidth inadequately . When comparing the F value sho wn in Fig. 11(h), the PD Method is the smallest, while that of the AA Method is the largest. Note that Fig.11 is obtained under the experiments that there is no sudden view switching in the display duration of each video segment. Therefore, the F value is unfair for the proposed method. Consider the circumstance that a user is watching a video segment at the current viewport. The tiles of the current video se gment are do wnloaded based on the current viewport. During the playback of the current video segment, the user may switch his/her vie wing angle suddenly even if the viewport has been accurately predicted at the beginning of the current video segment. T o simulate this sudden change, we randomly select n video segments (from a total N video segments) during which a vie wport switching occurs. The sudden view switching probability is calculated to be p = n N . 10 (a) (b) (c) (d) (e) (f) (g) (h) Fig. 12. Results of Case 1 with video sequence DrivingInCountry . T ABLE II Q UA NT I T A T I V E C O M P A R I S IO N S O F C A S E 1 W I T H V I D E O S E Q UE N C E D R IV I N G IN C O U NT RY Sudden view switching F oV Actual F oV F oV F oV PSNR probability in the duration Method Bitrate A verage PSNR Std T emporal F value QoE of each video segment (Mbps) PSNR (dB) Differ ence 0% AA 1.61 34.85 4.03 5.32 27.7687 2234.94 AdapA 9.22 40.31 3.07 3.68 5.4414 6519.90 PD 8.79 40.38 3.08 3.43 4.6455 7645.58 Proposed w/o ST 2.49 36.27 2.61 4.07 12.7353 5429.34 Proposed 2.53 36.33 2.59 3.95 12.4203 5592.72 5% AA 1.63 35.05 4.09 5.39 27.5176 2197.93 AdapA 9.03 39.51 3.19 4.44 710.5147 5451.16 PD 8.60 39.54 3.20 4.21 732.6536 6540.67 Proposed w/o ST 2.45 36.41 2.69 4.14 12.7793 5373.25 Proposed 2.50 36.47 2.66 3.99 12.3947 5571.77 10% AA 1.64 35.17 4.12 5.43 27.5912 2169.94 AdapA 8.82 38.57 3.18 5.37 1448.0600 4148.80 PD 8.37 38.52 3.16 5.24 1508.9930 5108.33 Proposed w/o ST 2.44 36.49 2.73 4.19 12.9401 5337.29 Proposed 2.47 36.53 2.70 4.07 12.6049 5494.45 20% AA 1.65 34.96 4.07 5.33 27.9048 2250.22 AdapA 8.39 36.66 3.22 6.82 2844.7701 2022.67 PD 7.99 36.62 3.14 6.68 2890.3337 2991.32 Proposed w/o ST 2.44 36.28 2.70 4.13 13.2384 5369.88 Proposed 2.48 36.33 2.68 4.01 12.8806 5527.01 (a) (b) (c) (d) (e) (f) (g) (h) Fig. 13. Results of Case 1 with video sequence P oleV ault . 11 T ABLE III Q UA NT I T A T I V E C O M P A R I S IO N S O F C A S E 1 W I T H V I D E O S E Q UE N C E P O LE V AU L T Sudden view switching F oV Actual F oV F oV F oV PSNR probability in the duration Method Bitrate A verage PSNR Std T emporal F value QoE of each video segment (Mbps) PSNR (dB) Differ ence 0% AA 1.80 38.54 3.54 5.69 13.9128 2713.72 AdapA 9.53 43.04 2.83 4.60 3.6132 5761.57 PD 8.81 43.13 2.81 4.23 2.8124 7231.01 Proposed w/o ST 2.48 39.53 2.05 3.81 4.9554 6526.02 Proposed 2.45 39.50 2.04 3.69 4.9138 6664.61 5% AA 1.80 38.54 3.54 5.72 13.9212 2681.28 AdapA 9.32 42.13 2.93 5.43 683.0140 4584.68 PD 8.61 42.18 2.91 5.11 714.0150 5991.69 Proposed w/o ST 2.46 39.51 2.07 3.84 5.0069 6484.86 Proposed 2.43 39.48 2.05 3.72 4.9570 6633.89 10% AA 1.81 38.61 3.53 5.71 13.8633 2715.93 AdapA 9.11 41.16 2.98 6.30 1445.0381 3335.20 PD 8.38 41.13 2.93 6.06 1499.5414 4644.41 Proposed w/o ST 2.43 39.55 2.09 3.81 5.0670 6525.18 Proposed 2.40 39.52 2.07 3.72 5.0551 6640.70 20% AA 1.81 38.54 3.51 5.65 13.7798 2767.03 AdapA 8.71 39.25 3.24 7.84 2882.1543 1107.30 PD 8.05 39.24 3.18 7.62 2932.5991 2392.20 Proposed w/o ST 2.41 39.45 2.07 3.76 5.0604 6574.42 Proposed 2.39 39.42 2.05 3.64 4.9961 6719.47 (a) (b) (c) (d) (e) (f) (g) (h) Fig. 14. Results of Case 2 with video sequence AerialCity . (a) (b) (c) (d) (e) (f) (g) (h) Fig. 15. Results of Case 2 with video sequence DrivingInCountry . 12 T ABLE IV Q UA NT I T A T I V E C O M P A R I S IO N S O F C A S E 2 W I T H V I D E O S E Q UE N C E A E RI A L C IT Y Sudden view switching F oV Actual F oV F oV F oV PSNR probability in the duration Method Bitrate A verage PSNR Std T emporal F value QoE of each video segment (Mbps) PSNR (dB) Differ ence 0% AA 3.23 40.04 1.91 1.22 2.9870 5794.73 AdapA 10.22 41.66 1.78 1.05 1.9365 6866.06 PD 9.80 41.62 1.78 1.03 1.9468 6947.33 Proposed w/o ST 6.13 40.91 1.31 0.84 1.9346 6592.22 Proposed 6.24 40.89 1.22 0.79 1.8986 6643.07 5% AA 3.26 40.09 1.89 1.24 2.9655 5781.74 AdapA 10.02 41.08 1.90 1.61 477.2496 6076.49 PD 9.59 40.72 1.93 1.91 730.0694 5712.55 Proposed w/o ST 6.06 40.92 1.30 0.85 1.9307 6581.81 Proposed 6.16 40.90 1.22 0.81 1.8960 6629.96 10% AA 3.28 40.11 1.88 1.26 2.9546 5768.19 AdapA 9.79 40.33 2.05 2.36 1094.3622 5035.36 PD 9.35 39.63 1.88 2.99 1506.4761 4194.56 Proposed w/o ST 5.99 40.91 1.29 0.86 1.9352 6568.95 Proposed 6.10 40.90 1.21 0.82 1.9005 6617.84 20% AA 3.30 40.12 1.86 1.23 2.9321 5797.00 AdapA 9.31 38.69 2.22 3.90 2350.6802 2856.96 PD 8.90 37.78 1.98 4.73 2888.0340 1737.18 Proposed w/o ST 5.86 40.87 1.28 0.85 1.9449 6568.43 Proposed 5.97 40.86 1.20 0.81 1.9096 6616.21 T ABLE V Q UA NT I T A T I V E C O M P A R I S IO N S O F C A S E 2 W I T H V I D E O S E Q UE N C E D R IV I N G IN C O U NT RY Sudden view switching F oV Actual F oV F oV F oV PSNR probability in the duration Method Bitrate A verage PSNR Std T emporal F value QoE of each video segment (Mbps) PSNR (dB) Differ ence 0% AA 2.63 36.87 3.67 4.18 12.4804 6276.68 AdapA 10.21 40.87 2.98 3.37 3.8464 7757.06 PD 9.71 40.79 3.00 3.27 3.8911 8101.26 Proposed w/o ST 4.75 38.45 1.89 2.59 4.7437 7948.48 Proposed 4.70 38.41 1.86 2.58 4.7083 7952.63 5% AA 2.66 37.06 3.72 4.25 12.4060 6228.81 AdapA 10.01 40.24 3.11 3.99 570.8212 6886.79 PD 9.51 39.95 3.12 4.06 731.9261 6979.09 Proposed w/o ST 4.68 38.56 1.96 2.64 4.7545 7904.02 Proposed 4.63 38.52 1.93 2.63 4.7235 7909.38 10% AA 2.68 37.17 3.75 4.31 12.4351 6177.52 AdapA 9.77 39.41 3.21 4.81 1266.0067 5737.11 PD 9.27 38.91 3.08 5.09 1508.2876 5533.58 Proposed w/o ST 4.63 38.61 1.99 2.71 4.8424 7833.55 Proposed 4.58 38.57 1.96 2.70 4.8018 7840.25 20% AA 2.69 36.99 3.71 4.18 12.5354 6290.44 AdapA 9.30 37.54 3.26 6.24 2608.7359 3652.25 PD 8.83 36.99 3.07 6.58 2889.6746 3369.29 Proposed w/o ST 4.65 38.44 1.98 2.66 4.9926 7864.77 Proposed 4.61 38.40 1.96 2.65 4.9554 7864.82 In the experiment, we take the value of p as 5%, 10% and 20% and we can observe that the F oV PSNR Std , F oV PSNR T emporal Differ ence and F value of the Proposed Method are always the smallest. Since the user’ s FoV may be switched to other tiles that were not do wnloaded in the PD Method , its F value is the largest. Besides, we also ev aluated the performance of dif ferent methods by using a commonly used QoE metric [27]: QoE = P L l =1 q l − γ P L − 1 l =1 | q l +1 − q l | − δ P L l =1 max [0 , t download,l − b l ] − η P L − 1 l =1 (max [0 , b ref − b l +1 ]) 2 , (16) where γ =6, δ =500 and η =0.1 are model parameters that are empirically defined [27]. L is the number of receiv ed segments, q l is the F oV averag e PSNR v alue of l -th segment, t download,l is the download time of l -th segment, b l is the buf fer length at the end time of the l -th segment, and b ref =15 seconds. Note that q l is only calculated by the average PSNR of tiles in the FoV . The detailed quantitative comparisons are also provided in T able I, from which we can see that the user QoE of the Proposed Method is the best. Similar results can also be found in Figs.12 and 13 and T ables II and III, for DrivingInCounrty and P oleV ault . This means that the Proposed Method is rob ust to various video content. (ii) Results of Case 2 13 (a) (b) (c) (d) (e) (f) (g) (h) Fig. 16. Results of Case 2 with video sequence P oleV ault . T ABLE VI Q UA NT I T A T I V E C O M P A R I S IO N S O F C A S E 2 W I T H V I D E O S E Q UE N C E P O LE V AU L T Sudden view switching F oV Actual F oV F oV F oV PSNR probability in the duration Method Bitrate A verage PSNR Std T emporal F value QoE of each video segment (Mbps) PSNR (dB) Differ ence 0% AA 3.15 40.54 3.21 4.75 6.1603 6331.66 AdapA 11.35 43.88 2.70 4.22 2.2275 7080.98 PD 10.61 43.77 2.71 4.12 2.2429 7663.80 Proposed w/o ST 5.04 41.59 1.68 2.78 2.4270 8375.75 Proposed 4.95 41.51 1.61 2.76 2.4235 8399.94 5% AA 3.16 40.54 3.21 4.78 6.1704 6298.79 AdapA 11.09 42.91 2.80 5.11 713.4498 5823.29 PD 10.37 42.81 2.82 5.00 713.4641 6408.60 Proposed w/o ST 5.00 41.56 1.69 2.80 2.4512 8346.05 Proposed 4.92 41.48 1.62 2.78 2.4492 8368.39 10% AA 3.17 40.61 3.21 4.75 6.1574 6344.58 AdapA 10.82 41.87 2.84 6.07 1496.2501 4466.65 PD 10.11 41.75 2.84 5.97 1499.0027 5032.74 Proposed w/o ST 4.92 41.57 1.70 2.78 2.4608 8373.40 Proposed 4.84 41.49 1.64 2.76 2.4589 8393.66 20% AA 3.17 40.54 3.19 4.70 6.1193 6394.97 AdapA 10.34 39.94 3.10 7.65 2917.8390 2178.77 PD 9.68 39.82 3.11 7.57 2932.1145 2727.61 Proposed w/o ST 4.89 41.47 1.69 2.76 2.4871 8382.43 Proposed 4.81 41.39 1.62 2.74 2.4867 8402.37 In the case of a real network en vironment, Figs. 14-15 compare the performance of the bit allocation methods. T aking AerialCity as an example, from Fig. 14(a), we can observe that the Actual Bitrates of the AdpaA Method and the PD Method are smaller than the other methods. Similar to the results of Case 1 , Fig. 14(b) shows that the F oV Actual Bitrates of the AdpaA Method and the PD Method are the larger because it distrib utes more bitrate to the current FoV , while that of the AA Method is smaller . In Fig. 14 (c), the W eighted PSNR of the Proposed Method is the highest, while this value of the PD Method is the smallest. Although, as shown in Fig. 14(d), the F oV A verag e PSNR of the Proposed Method is not the highest, the spatial and temporal smoothness are the best as sho wn in Figs. 14(e) and (f). From T able IV , we can see that when there is no sudden view switching during the display of each video segments, the QoE of the PD Method is the largest, and the F value of it still very small; whereas, in this case, the QoE of the Proposed Method is also large, and the F value of the Pr oposed Method is the smallest. When there exists sudden view switching during the display of some video segments, the F values of the Proposed Method are still the smallest, meanwhile the corresponding QoEs are also the largest. Similar results can also be found for the other two tested video sequences, DrivingInCountry and P oleV ault . V . C O N C L U S I O N In this paper , we have presented an effecti ve adaptiv e streaming framework for 360 videos. W e first presented a nov el bitrate adaptation algorithm for 360-degree videos to determine the requested bitrate. Then, the Gaussian model is adopted to predict the FoV at the starting time of each requested video se gment. Besides, to tackle the risk that the view angle is switched during the display of a video segment, 14 all tiles in the 360-de gree video are downloaded. Because users can only watch the content of the FoV in a 360-degree video, a Zipf model is proposed to determine priorities for different tiles. Finally , a two-stage coarse to fine optimization algorithm is proposed to allocate bitrates for all the tiles so that the video quality as well as the spatial and temporal smoothness of tiles in the FoV can be preserved. Experimental results show that the performance of our proposed method is much better than the state-of-the-art methods. A C K N O W L E D G M E N T The authors would like to thank Institute of Information T echnology (ITEC) at Klagenfurt Univ ersity for the valuable and basis work of DASH. They would also like to thank the editors and anon ymous revie wers for their valuable comments. R E F E R E N C E S [1] F . Duanmu, E. Kurdoglu, Y . Liu and Y . W ang, “V iew Direction and Bandwidth Adaptive 360 Degree V ideo Streaming using a T wo-T ier System, ” in Proc. IEEE International Symposium on Cir cuits and Systems , Baltimore, Maryland, SA, May 2017, pp. 1-4. [2] G. K. W alker , T . Stockhammer , G. Mandyam, Y . K. W ang, and C. Lo, “R OUTE/D ASH IP Streaming-Based System for Delivery of Broadcast, Broadband, and Hybrid Services, ” IEEE T rans. Broadcast. , vol. 62, no. 1, pp. 328-337, Mar. 2016. [3] C. Begen, T . Akgul, M. Baugher , “W atching V ideo ov er the W eb, P art I: Streaming Protocols, ” IEEE Int. Comput. , vol. 15, no. 2, pp. 54-63, Mar . 2011. [4] I. Sodagar , “The MPEG-D ASH Standard for Multimedia Streaming Ov er the Internet, ” IEEE MultiMedia , v ol. 18, no. 4, pp. 62-67, Apr . 2011. [5] ISO/IEC IS 23009-1: “Information T echnology-Dynamic Adaptive Streaming ov er HTTP (D ASH)-Part 1: Media Presentation Description and Segment Formats, ” 2012. [6] T . Stockhammer, “Dynamic Adapti ve Streaming ov er HTTP-Standards and Design Principles, ” in Proc. ACM confer ence on Multimedia systems (MMSys ’11) , Santa Clara, CA, USA, Feb . 2011, pp.133-144. [7] E. Mercan, S. Aksoy , L. G. Shapiro, D. L. W eaver , T . T . Bruny ´ e , and J. G. Elmore, “Localization of Diagnostically Relevant Regions of Interest in Whole Slide, ” Journal of Digital Imaging , vol. 29, no 4, pp. 496-506, Aug. 2016. [8] G. J. Sulliv an, J. R. Ohm, W . J. Han, and T . Wie gand, “Overview of the High Efficienc y V ideo Coding (HEVC) Standard, ” IEEE T ransactions on Circuits and Systems for V ideo T echnology , vol. 22, no. 12, pp. 1649- 1668, Dec. 2012. [9] H. W ang, V . T . Nguyen, W . T . Ooi, and M. C. Chan, “Mixing Tile Resolutions in Tiled V ideo: A Perceptual Quality Assessment, ” in Pr oc. ACM SIGMM NOSSDA V , Sing apore, Mar . 2014, pp. 25:25-25:30. [10] C. Y im and A. C. Bovik, “Evaluation of temporal variation of video quality in packet loss networks, ” Signal Processing: Image Communi- cation , vol. 26, no. 1, pp. 24-38, Jan. 2011. [11] D. W illiams, W eighing the odds: a cour se in pr obability and statistics , Cambridge: Cambridge Univ ersity Press, 2001. [12] D. M. W . Powers, “ Applications and explanations of Zipf ’ s law , ” in Pr oc. the Joint Conferences on New Methods in Language Processing and Computational Natural Language Learning , Sydney , Australia, Jan. 1998, pp.151-160. [13] M. Doma ´ n ski, O. Stankiewicz, K. W egner and T . Grajek, “Immersive visual media MPEG-I: 360 video, virtual navigation and beyond, ” in Pr oc. 2017 International Conference on Systems, Signals and Image Pr ocessing (IWSSIP) , Poznan, Poland, May 2017, pp. 1-9. [14] E. Adel, M. Elmogy , H. Elbakry , “Image Stitching based on Feature Extraction T echniques: A Survey , ” International Journal of Computer Applications , vol. 99, no. 6, pp. 1-8, Aug. 2014. [15] C. W . Fu, L. W an, T . T . W ong, and C. S. Leung, “The Rhombic Dodecahedron Map: An Efficient Scheme for Encoding Panoramic V ideo, ” IEEE T ransactions on Multimedia , vol. 11, no. 4, pp. 634-644, Jun. 2009. [16] M. Y u, H. Lakshman, and B. Girod, “ A Frame work to Evaluate Omni- directional V ideo Coding Schemes, ” In Pr oc. 2015 IEEE International Symposium on Mixed and Augmented Reality (ISMAR) , Fukuoka, Japan, Sep. 2015, pp. 31-36. [17] C. Robert, A. Maneesh and A. Aseem, “Optimizing Content-Preserving Projections for Wide-Angle Images, ” ACM T ransactions on Graphics , vol. 28, no. 3, pp. 461-439, Aug. 2009. [18] K. K.-Sreedhar, A. Aminlou, M. M. Hannuksela, and M. Gabbouj, “V iewport-adapti ve encoding and streaming of 360-degree video for vir- tual reality applications, ” in Pr oc. 2016 IEEE International Symposium on Multimedia (ISM) , San Jose, CA, USA, Dec. 2016, pp. 583-586. [19] C. Liu, N. Kan, J. Zou, Q. Y ang and H. Xiong, “Server-Side Rate Adaptation for Multi-User 360-Degree V ideo Streaming, ” in Proc. 2018 25th IEEE International Conference on Image Processing (ICIP) , Athens, Greece, Oct. 2018, pp. 3264-3268. [20] M. Graf, C. Timmerer , C. Mueller, “T owards Bandwidth Efficient Adaptiv e Streaming of Omnidirectional V ideo ov er HTTP: Design, Implementation, and Evaluation, ” in Pr oc. the 8th A CM on Multimedia Systems Confer ence (MMSys’ 17) , T aipei, T aiwan, Jun. 2017. pp. 261- 271. [21] F . Dai, Y . Shen, Y . Zhang, and S. Lin, “The Most Ef ficient Tile Size in T ile-Based Cylinder Panoramic V ideo Coding and its Selection Under Restriction of Bandwidth, ” in Pr oc. IEEE Int. Conf. Multimedia Expo , Beijing, China, Jul. 2007, pp. 1355-1358. [22] Y . Sanchez, R. Skupin, and T . Schierl, “Compressed domain video processing for tile based panoramic streaming using HEVC, ” in Proc. IEEE International Conference on Image Pr ocessing (ICIP) , Quebec City , QC, Canada, Sep. 2015, pp. 2244-2248. [23] O. A. Niamut, E. Thomas, L. D’Acunto, C. Concolato, F .ranck Denoual, and S. Y . Lim, “MPEG D ASH SRD: spatial relationship description, ” In Pr oc. the 7th International Conference on Multimedia Systems (MMSys’ 16) , Klagenfurt, Austria, May 2016, pp. 1-8. [24] A. Zare, A. Aminlou, M. M. Hannuksela, and M. Gabbouj, “HEVC- compliant Tile-based Streaming of Panoramic V ideo for V irtual Reality Applications, ” In Pr oc. the 24th ACM international conference on Multimedia (MM ’16) , Amsterdam, The Netherlands, Oct. 2016, pp. 601-605. [25] D. K. Krishnappa, D. Bhat and M. Zink, “D ASHing Y ouTube: An Analysis of Using DASH in Y ouT ube V ideo Service, ” in Pr oc. IEEE Conf. Local Computer Networks , Sydney , NSW , Oct. 2013, pp. 407- 415. [26] M. Dr ¨ a xler and H. Karl, “Cross-Layer Scheduling for Multi-Quality V ideo Streaming in Cellular Wireless Networks, ” in Proc. the 9th Int. W irel. Commun. and Mobile Comput. (IWCMC) , Sardinia, Italy , Jul. 2013, pp. 1181-1186. [27] C. Federico, D. Stefano, T . Laura and F . Pascal, “Online Learning Adap- tation Strate gy for D ASH Clients. ” in Proc. the 7th ACM International Confer ence on Multimedia Systems (MMSys’ 16) , Klagenfurt, Austria, May 2016, pp.77- 88. [28] N. Cranley , P . Perry , and L. Murphy , “User perception of adaption video quality , ” Int. J. Human-Comput. Stud. , vol. 64, no. 8, pp. 637-647, Aug. 2006. [29] T . Y . Huang, R. Johari, and N. McKeo wn, “Downton abbey without the hiccups: Buffer -based rate adaptation for http video streaming, ” in Pr oc. ACM SIGCOMM W orkshop Future Human-Centric Multimedia Netw . , Hong Kong, China, Aug. 2013, pp. 9-14. [30] T . Y . Huang, R. Johari, N. McKeown, M. Trunnell, and M. W atson, “ A buf fer-based approach to rate adaptation: Evidence from a large video streaming service, ” in Proc. A CM Conf. SIGCOMM , Chicago, Illinois, USA, Aug. 2014, pp. 187-198. [31] J. Kua, G. Armitage and P . Branch, “ A Survey of Rate Adaptation T ech- niques for Dynamic Adaptiv e Streaming over HTTP , ” IEEE Commun. Surveys and Tutorials , vol. 19, no. 3, pp. 1842-1866, Mar . 2017. [32] D. Y un and K. Chung, “DASH-based multi-view video streaming system, ” IEEE T rans. Cir cuits Syst. V ideo T echnol. , vol. 28, no. 8, pp. 1974-1980, Aug. 2018. [33] Y . Ban, L. Xie, Z. Xu, X. Zhang, Z. Guo and Y . Hu, “ An optimal spatial-temporal smoothness approach for tile-based 360-degree video streaming, ” in Pr oc. IEEE V isual Communications and Image Processing (VCIP) , St. Petersbur g, FL, USA, Dec. 2017, pp. 1-4. [34] S. Rossi and L. T oni, “Navigation-aware adapti ve streaming strategies for omnidirectional video, ” in Proc. the 19th International W orkshop on Multimedia Signal Processing (MMSP) , Luton, UK, Oct. 2017, pp. 1-6. [35] Y . Chao X. Jimin, Z. Y ao and M. Anlong, “V ideo Streaming Adaptation Strategy for Multi view Navigation over DASH, ” IEEE T ransactions on Br oadcasting (Early Access) , DOI: 10.1109/TBC.2018.2871370, pp. 1- 13, Oct. 2018. [36] S. Xie, Q. Shen, Y . Xu, Q. Qian, S. W ang, Z. Ma, and W . Zhang, “V iewport Adaptation-Based Immersive Video Streaming: Perceptual Modeling and Applications, ” arXiv .org [cs.MM] , abs/ 1802.06057, pp. 1-12, Feb. 2018. 15 [37] L. Y u, T . Tillo, J. Xiao, and M. Grangetto, “Conv olutional neural network for intermediate view enhancement in multivie w streaming, ” IEEE Tr ans. Multimedia , vol. 20, no. 1, pp. 15-28, Jan. 2018. [38] N. Carlsson, D. Eager , V . Krishnamoorthi, and T . Polishchuk, “Opti- mized adapti ve streaming of multi-video stream bundles, ” IEEE T rans. Multimedia , vol. 19, no. 7, pp. 1637-1653, Jul. 2017. [39] F . X. Y ang, J. T . Luo, J. C. Y ang and Z. Xu, “Region Priority Based Adaptiv e 360-Degree V ideo Streaming Using DASH, ” in Proc. International Confer ence on Audio, Language and Image Pr ocessing , Shanghai, China, Jul. 2018, pp. 398-405. [40] X. Zhang, L. T oni, P . Frossard, Y . Zhao and C. Lin, “ Adaptiv e Streaming in Interactive Multiview V ideo Systems, ” IEEE T ransactions on Circuits and Systems for V ideo T echnology (Early Access) , DOI: 10.1109/TCSVT .2018.2819804, pp. 1-15, Mar . 2018. [41] J. Ba, V . Mnih, and K. Kavukcuoglu, “Multiple object recognition with visual attention, ” in Proc. International Conference on Learning Repr esentations (ICLR) , San Die go, CA, USA, May 2015, pp. 1-10. [42] S. Jetley , N. Murray , and E. V ig, “End-to-end saliency mapping via probability distribution prediction, ” in Pr oc. IEEE Confer ence on Com- puter V ision and P attern Recognition (CVPR) , Las V egas, NV , USA, Jun. 2016, pp. 5753-5761. [43] Y . C. Lin, Y . J. Chang, H. N. Hu, H. T . Cheng, C. W . Huang, and M. Sun, “T ell me where to look: In vestigating ways for assisting focus in 360 video, ” In Pr oc. CHI Confer ence on Human F actors in Computing Systems , Denver , Colorado, USA, May 2017, pp. 2535-2545. [44] Y . Su, D. Jayaraman, and K. Grauman, “Pano2vid: Automatic cine- matography for watching 360 videos, ” In Pr oc. the 13th Asian Con- fer ence on Computer V ision (ACCV) , T aipei, T aiwan, Nov . 2016, pp. 154-171. [45] Z. Xu, X. Zhang, K. Zhang and Z. Guo, “Probabilistic V iewport Adaptiv e Streaming for 360-degree V ideos, ” in P roc. IEEE International Symposium on Cir cuits and Systems (ISCAS) , Florence, Italy , May 2018, pp. 1-5. [46] H. Hu, Y . Lin, M. Liu, H. Cheng, Y . Chang, and M. Sun, “Deep 360 Pilot: Learning a Deep Agent for Piloting through 360 ◦ Sports V ideo, ” In P roc. IEEE Conference on Computer V ision and P attern Recognition (CVPR) , Honolulu, HI, USA, Jul. 2017, pp. 1396-1405. [47] D. Be gault, 3-D Sound for V irtual Reality and Multimedia , Cambridge, U.K.: Academic Press Professional, 1994. [48] K. Niwa, Y . Hioka and H. Uematsu, “Ef ficient Audio Rendering Using Angular Region-W ise Source Enhancement for 360 ◦ V ideo, ” IEEE T ransactions on Multimedia , vol. 20, no. 11, pp. 2871-2881, Nov . 2018. [49] J. J. Cummings and J. N. Bailenson, “How Immersive Is Enough? A Meta-Analysis of the Effect of Immersiv e T echnology on User Presence, ” Media Psychology , vol. 19, no. 2, pp. 272-309, May 2015. [50] H. Y uan, S. Kwong, X. W ang, W . Gao and Y . Zhang, “Rate Distortion Optimized Inter-V iew Frame Lev el Bit Allocation Method for MV - HEVC, ” IEEE T ransactions on Multimedia , vol. 17, no. 12, pp. 2134- 2146, Dec. 2015. [51] N. Kamaci, Y . Altunbasak and R. M. Mersereau, “Frame bit allocation for the H.264/A VC video coder via cauchy-density-based rate and distortion models, ” IEEE T rans. Circuits Syst. V ideo T echnol. , vol. 15, no. 8, pp. 994-1006, Aug. 2005. [52] Random walk. [Online]. A vailable: https://en.wikipedia.org/wiki/Rand- om walk. [53] Dash Industry Forum. [Online]. A vailable: https://github.com/DashIndu- stry-Forum/dash.js [54] D. X. W ei, C. Jin, S. H. Low , and S. Hegde, “Fast tcp: Motiv ation, architecture, algorithms, performance, ” IEEE/ACM Tr ans. Netw . , vol. 14, no. 6, pp. 1246-1259, Dec. 2006. [55] S. Akhshabi, S. Narayanaswamy , A. C. Begen and C. Dovrolis, “ An Experimental Evaluation of Rate-Adaptiv e V ideo Players over HTTP , ” Signal Processing Imag e Communication , vol. 27, no. 4, pp. 271-287, Apr . 2012. Hui Y uan (S’08-M’12-SM’17) received the B.E. and Ph.D. degree in telecommunication engineer- ing from Xidian University , Xi’an, China, in 2006 and 2011, respecti vely . From 2011.04 to no w , he works as a lecturer (2011.04-2014.12), an asso- ciate Professor (2015.01-2016.08), and a full pro- fessor (2016.09-), at Shandong University (SDU), Jinan, China. From 2013.01-2014.12, and 2017.11- 2018.02, he also worked as a post-doctor fellow (Granted by the Hong Kong Scholar Project) and a research fello w , respectively , with the department of computer science, City Uni versity of Hong K ong (CityU). His current research interests include video/image/immersiv e media processing, compres- sion, adaptive streaming, and computer vision, etc. Shiyun Zhao receiv ed the B.E.degree in commu- nication engineering from Y unnan University , Kun- ming, China, in 2017. She is currently w orking to- ward the M.S. de gree in Electronics and Communi- cation Engineering at the School of Information Sci- ence and Engineering, Shandong University , Qing- dao, China. Her current research interests include video transmission and multimedia communication. Junhui Hou (S’13-M’16) receiv ed the B.Eng. de- gree in information engineering (T alented Students Program) from the South China University of T ech- nology , Guangzhou, China, in 2009, the M.Eng. degree in signal and information processing from Northwestern Polytechnical University , Xian, China, in 2012, and the Ph.D. degree in electrical and electronic engineering from the School of Electrical and Electronic Engineering, Nanyang T echnological Univ ersity , Singapore, in 2016. He has been an As- sistant Professor with the Department of Computer Science, City University of Hong Kong, since 2017. His research interests in- clude image/video/3D geometry data representation, processing and analysis, semisupervised/unsupervised data modeling for clustering/classification, and data compression and adaptive streaming. Dr . Hou was the recipient of sev eral prestigious awards, including the Chinese Government A ward for Outstanding Students Study Abroad from China Scholarship Council in 2015, and the Early Career A ward from the Hong Kong Research Grants Council in 2018. He is serving/served as an Associate Editor for The V isual Computer , an Area Editor for Signal Processing: Image Communication, the Guest Editor for the IEEE Journal of Selected T opics in Applied Earth Observ ations and Remote Sensing and the Journal of Visual Communication and Image Representation, and an Area Chair of ACM International Conference on Multimedia (ACM MM) 2019. Xuekai W ei received the B.Eng. degree in Elec- tronic Information Science and T echnology from Shandong Uni versity in 2014, and the Master’ s de- gree in Communication and Information Systems from Shandong Univ ersity in 2017. He is cur- rently working toward the Ph.D. degree in computer science with the City Univ ersity of Hong Kong, Hong Kong, China. His current research interests in- clude video coding, video transmission, and machine learning. 16 Sam Kwong (M’93-SM’04-F’13) received the BS degree from the State University of New Y ork at Buff alo, in 1983, the MS degree in electrical engi- neering from the Uni versity of W aterloo, W aterloo, ON, Canada, in 1985, and the PhD de gree from the University of Hagen, Germany , in 1996. From 1985 to 1987, he was a diagnostic engineer with Control Data Canada, Mississauga, ON, Canada. He joined Bell Northern Research Canada, Ottawa, ON, Canada, as a member of Scientific Staff. In 1990, he became a lecturer with the Department of Electronic Engineering, The City Univ ersity of Hong Kong, where he is currently a professor with the Department of Computer Science. His research interests are video and image coding, and evolutionary algorithms. He serves as an associate editor of IEEE Transactions on Industrial Electronics and the IEEE T ransactions on Industrial Informatics. He is a fello w of the IEEE.
Original Paper
Loading high-quality paper...
Comments & Academic Discussion
Loading comments...
Leave a Comment