Deep Learning based Multiple Regression to Predict Total Column Water Vapor (TCWV) from Physical Parameters in West Africa by using Keras Library
Total column water vapor is an important factor for the weather and climate. This study apply deep learning based multiple regression to map the TCWV with elements that can improve spatiotemporal prediction. In this study, we predict the TCWV with th…
Authors: Daouda Diouf, Awa Niang, Sylvie Thiria
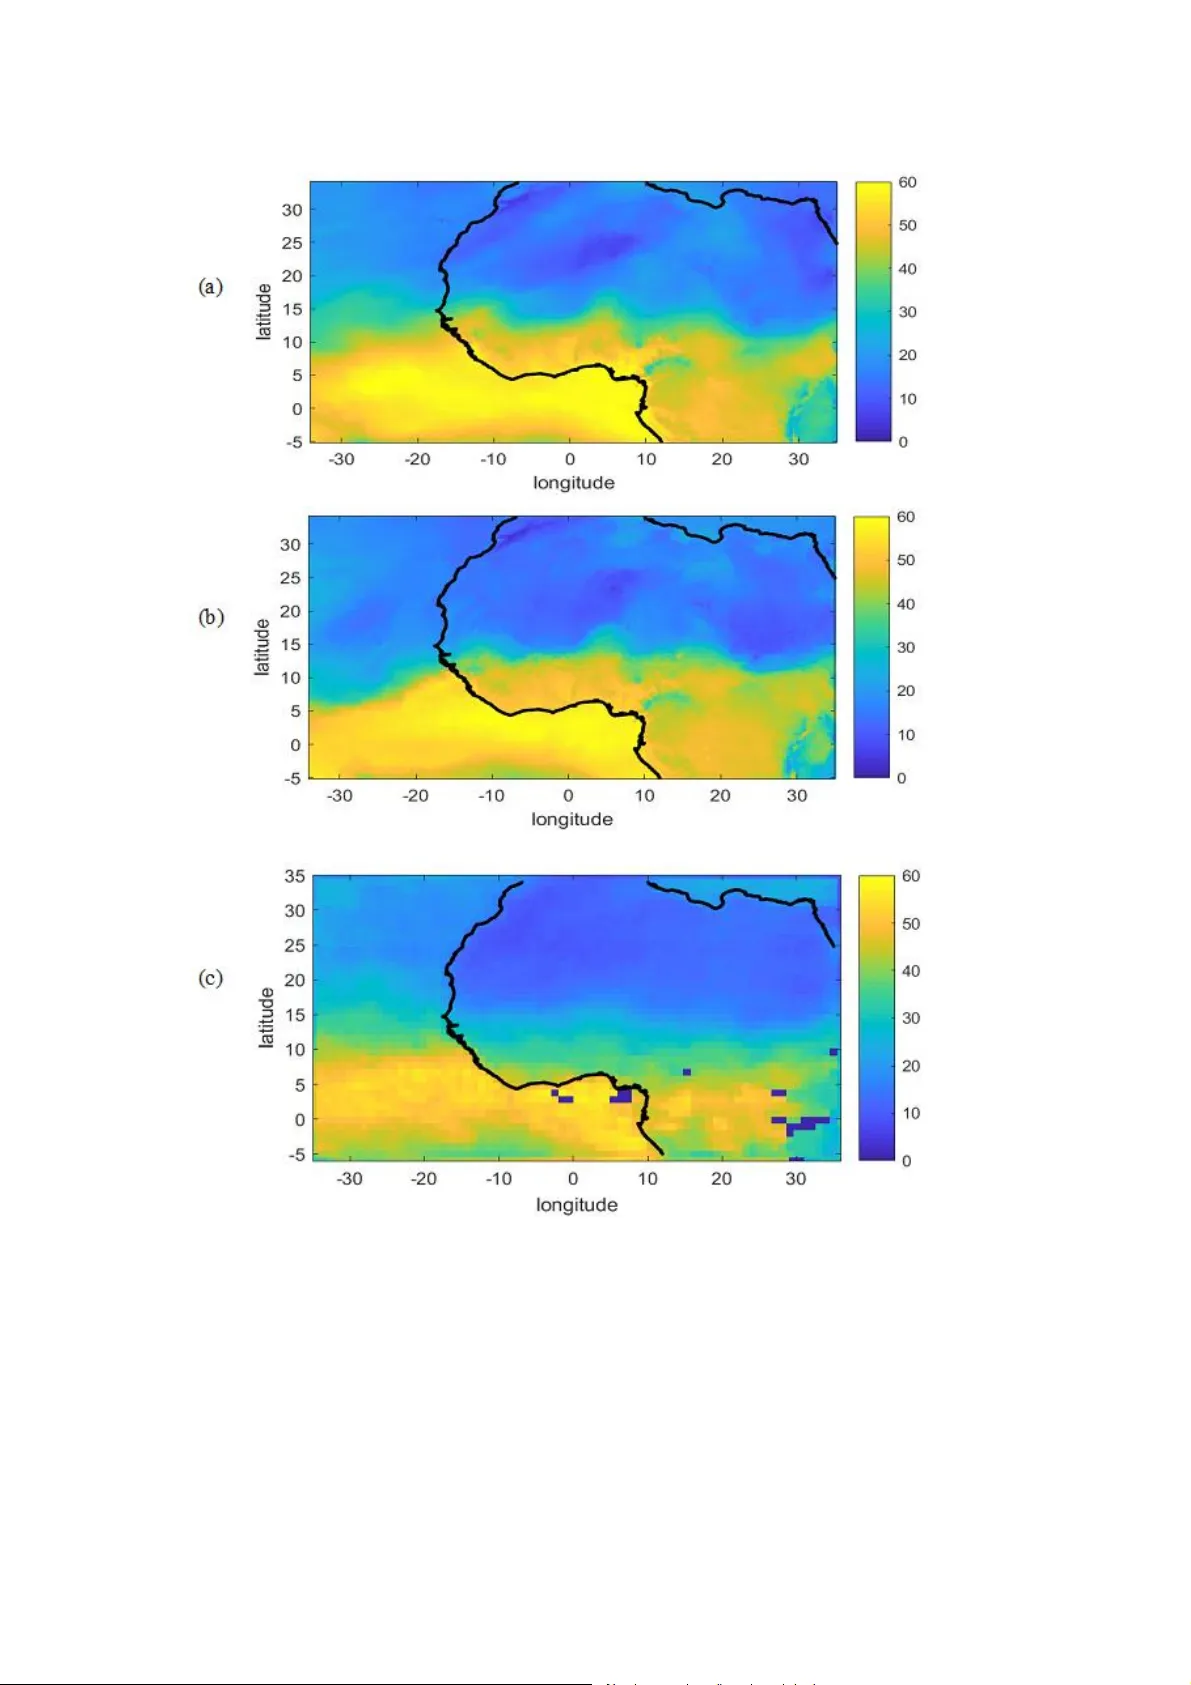
I nternational Jo urna l of Data Mining & Knowl edge Manag ement P ro cess (IJDK P) Vol.9, No.6, No vem ber 2019 DOI: 10.512 1/ijdkp.201 9.9602 13 D EEP L EARN ING B ASED M ULTIPLE R EG RESSIO N T O P REDICT T OT AL C OLUMN W ATER V APO R (TCWV) F ROM P HYSICAL P ARAME TERS I N W EST A FRICA B Y U SING K ERAS L IBRARY . Daouda DIOUF 1 , Awa Niang 1 and Syl vie Thiria 2 1 Lab or atoi re de Trai te m ent de l’ I nf o rma t i on (LTI) – ESP – Univ ersi t é C h e i k h Anta Di o p de Dakar BP : 5085 Dakar -Fann (Sénégal) 2 Lab or atoi re d’Océa nographie et du Clim at : Expérimen t ations et Approches Nu m ér i ques (IPSL / LOCEAN) – Universi t é P i erre et Mari e Cur i e, 75252 Pari s (Fra n ce) A BSTRACT Total co lumn wate r vapor is an im p o r tant facto r fo r the weathe r a nd c lim ate. T h is study apply deep le ar ning based m ulti p le reg r e ssion t o m ap the TCWV w ith e lements that c an improve spatiotem poral pre dic tion. In thi s stud y, we pr ed ict t h e TCWV w ith the use of ERA 5 th a t is the fi ft h gene rat ion ECMWF atmo spheric reanalysi s of the g lobal clim at e. W e use a n appr o pr i a te deep le arning ba sed multiple regr e ssion algo rithm using Keras library to im prove nonline ar predi ction between T o ta l Colu m n water vapo r and pr edi ct o r s as Me an sea level pr essure , S urface pressure , Sea surface tempe ra ture, 100 me tr e U w ind c om ponent, 100 me tr e V wind com p onen t, 10 me tr e U wind com p onen t, 10 me tr e V w ind com ponen t, 2 me tre dew poi n t t em peratur e , 2 me tr e t em peratur e . The r e sults obtained p e r mit to bu ild a predic t or which mode lli ng TCWV with a me a n a bs e rr o r (MA E) eq ual to 3.60 kg/m 2 a n d a coefficien t o f de t e r min a tion R 2 equal to 0.90. 1. I NTR ODUCTION Wate r vapo r is the mo st abund a n t g r eenho us e gas a nd is a g ood fact or fo r the we at he r and c lim at e [1][2] . T he heating ra te a n d ci rculation of the atm osphere depend gr e at l y to the T CWV thro ugh the c on densation of the latter into c louds. The a tmo spheric com p osi t ion can be a ffe ct ed also by the T CWV v ia the pho t ochem ical r e actions. A good predic t ion and moni t o r i ng of we at her, clim at e a n d a better unde rstanding atmo sp he ric physics and c hem istry go through a bette r knowledge of the TCWV th at is h ighly variable in space and time . A t presen t, TCWV, a lso known a s T PW ( Total Precipi table Wat e r ), is re tr ie ved from vario us im a ge r remo t e s en sing a s AMSU on bo a rd the P OES and MET OP po lar -orbi ting sa tel lites, SS M/I on bo ar d t he DMSP F-13 sate lli t e , f r om the s ounders as GOES and g round-bas ed Global Posi tioning System (GPS ) eq uip m ent [3] , [ 4]. The a im of this pape r is to pr e dic t the T otal Column w at e r vapo r (TCWV ) from climate parame t e rs in We st Af r i ca( F igure 1) . T h e following v ar iable s we r e us ed: Mea n s e a level pressure , Surface pre ssur e , Sea surface t em pe ra tur e , 100 me tr e U wind c om ponent, 100 m e tr e V wind component, 10 me tr e U wind com p onen t, 10 metre V wind component, 2 me tre dewpoin t tempe ra ture , 2 me tre t emperature . I nternational Jo urna l of Data Mining & Knowl edge Manag ement P ro cess (I JDKP) Vol. 9, No.6 , No vem ber 2019 14 Figu r e1: A r ea of study an d transect (in y e ll ow ) on latitude 0°N, 15°N and 30°N Due t o its high computing powe r, machine learning h as sh own a pa rtic ular in t e r est in pr o cessing and unde rsta n ding o f lar ge and m ultifunc t ion al data [5 ] . In the case o f envi ronmental data, the s e ar e often c omple x and highly non-line ar . From this nonline ar ity and com p le x ity of data, w e ai m to bui ld a dee p learning mode l able t o mo del the TCWV pa rame ter from othe r pa rame ters. 2. D ATASET The dataset we us ed a re from Eur o p e an C entre for Medium -Range Weathe r F o recasts, E RA5 Re a n alys i s . T h e s e dataset are taken in an ar e a of t he W e st A frica, be tween -5°N and 34°N a nd - 34°W and 35°W. T h ese me asur eme nts extend t he p e r i od of January 2004 to Octo b e r 2018. The l e ar n ing dataset de scrib e s ni ne (09) and i s conc e rned with modeling the T o ta l column w at ervapo r . The se 09 pa rame ters are no t ed by x a nd the TCWV by y . To avo id the over fitting, we r andom the data. Then 36 370 741 of pixel t aken fr om 2004 to 2006 are r andom . From thes e r andom value , w e take the 1% for train data and 0 ,5 % fo r te st data. The model is tra ine d t o predic t the o utputs and generalize to other no n -tr ained data. T e st data is used t o t e st the accura cy of t he mode l. It is to bui ld , by learning , a neura l mode l a ble t o f i nd t h e TC WV from in put d at a. For com par ison we a lso used mon thl y observation s d a ta on GOME -2 instrumen t on b o a rd of t he Me tOp- A sa tel lit e . 3. N EURAL N ETWORK M OD EL A deep le ar ning based m ultiple regr e ssion ne t wo rk t hat con sist an i n put laye r, a m u lti - hidden laye r with mo r e the one hidden laye r a n d a n output layer. The node s a re fully connec t ed . The num ber of i n put l a ye r node s is equal to the n u m ber of features of t he input d a ta. The mo r e hidden laye rs, t he highe r the number of f e atur e s nee ded to reduce the infl u en ce of u nde r fitting or over fi tti ng . Ea ch hidden layer no de is com p o s ed of neuron s. The ne ur ons con tain bo th rectifie r activ ati on and a gg r eg ation f unction, w hen c on str ucting the dee p le arning m ultiple regression mode l, t he a ctiv a tion function in the default ne ur on is the R ectifie d Linear activ ati on function, I nternational Jo urna l of Data Mining & Knowl edge Manag ement P ro cess (I JDKP) Vol. 9, No.6 , No vem ber 2019 15 m a king t he dee p le ar ning ne t wo rk ne ur on s h a ve sparse ch a ra cte r isti cs, which red u ces th e influen ce o f ove rfitting whi le incr e a sing t he depth of the network , im pr oving t he tr aining spee d of the mode l, and ef f ec t ively overcoming t he probl em of gradien t disappe ar anc e. This function that we m ust defi ne is responsi bl e for creating the ne ur al netwo rk mode l to be ev a luated [6]. 3.1 Deep Lear nin g Based Regres sion A deep learning e stim at or is esse ntially based on the distributed repre s en t ation, this me a n that an output data is due to the interactions of var i ous componen t sat d iffe r ent levels [7]. In this st ud y, the dee p learning estimato r is org anized in t wo training pr ocedure s, with a pr e-le ar ning and tuning wit h respe ct to the targe t TCWV . 3.2 Neur al network model We train the neur al ne t work by de fini ng a se quen t ial ke r as m odel. We ar e using t he 09 in put s variable s as Mean s e a level pre ssur e , Surface pr e ssur e , Se a sur face t em p e ra tu r e, 10 0 me tr e U wind com p onen t, 100 m etre V w ind c om p onen t, 10 me tr e U w ind com p onen t, 10 me tr e V wind com p onen t, 2 me tr e dewpoint tem p e ra ture, 2 me tr e t em p e ra ture. T h e s e 09 input fe a tures are fully connec t ed to a fi r st den se hidden laye r of 64 (L1), t h is one fully connected to a se cond hidden laye r of 32 ne urons (L2), and fin all y using the a ctiv a tion fun ct ion , the R e ctified Linear U nit (Re LU), to proce ss the output (Total col u m n w at e r vapo r) . Re LU ar e de fined as f(x) = m ax(0,x) and a re used with m ini ba tch size of 64. The wo r k fl ow f o r train ing the mode l is simple. We w a n t to e sti m a te a ) ( x g y function ) ( R y et R x p but by k nowing only ce r tain realiz a tion s of t hi s fun cti on : N n y x n n ... 1 , . T h is se t is calle d le ar ning se t. T he pur po se of the le ar ning is to e st im at e the weights of the ne t wo r k so t h at the output function noted F be st approache s t he r e alization s of g . It is ther e fore a q u estion of minim izing t he following function so - called cost function: n n n w x F y w J 2 ) , ( ) ( whe r e w is the se t of weights. Sin ce the cost function is the su m over all the r ea l izations n n y x , , the gradi en t m ust be calc ulat ed fo r each of the realiz at ion s. Note n J th e parti al cost function correspondin g to the realiz at i on n : 2 ) ( n n n x F y J Le t the error o bs e rved n J fo r the output neuron j a nd t he tr ainin g d at a n. The gradien t with respe ct to the output y j of the neuron i s : Indee d, knowing the gradie nt with r e sp e ct to the outputs of all the ne urons of a laye r k make s it possi bl e to calculate the gradien t s wi t h r e sp ec t to t he outputs of the neur on s of the antecedent laye r k - 1: j j k j k ij k j k i k j k j n k i v f w y y y J ) ( ' 1 1 1 But it is easy to know the gradien t of the cost func t ion with respe ct to t he output neuron . In our case , the quadratic co st fu nc tion is: j n j y J I nternational Jo urna l of Data Mining & Knowl edge Manag ement P ro cess (I JDKP) Vol. 9, No.6 , No vem ber 2019 16 ) .( 2 ) ( 2 Y y Y Y y Y J n n n And so by backward propag a tio n, first in the output laye r, then in the hi dden laye r s, we ca n calc ulat e the gra d ient n J with r e sp ect to each of the weights o f the ne t wo rk. 3.3Tune t he n eur al netwo r k We have specified 140 e poc h s fo r our mode l. For thi s deep le a rning model, we choo s e Ad a m as an optimization a lgori t hm [8] . Adam is a n optim ization a l gorithm t hat can used instead of the cl ass ic al stoc h ast i c gradien t [9] descen t pr o cedur e to update ne t work weig hts iterative bas ed in training data. A dam is combining the advan tages o f two other e xtensions o f stoch astic gr adient de scent, sp e cifically the Adaptive Gra die nt Algorithm (AdaGrad) and Root Mean S quare Propagatio n (RMSPr op) . 4. R ESULT S Test data is use d t o te st the predi ct ion a ccuracy o f the model . T hi s model is used to pr edi ct TC WV from de p enden t o r inde p enden t variable s. The a ccuracy on the le ar ning s et is 90.47% and the va lid a tion accura cy is 90.23%. T he learning me a n abs e rr o r is 3.60 k g/m 2 and the validation me a n abs e rr o r is 3.45 kg / m 2 . In the figur es below , the scatter plo t be tween t he tar ge t r e tr ie ved from tr ainin g f eatur e s a n d the r e al t arge t are qui t e good. Most of the prediction e rr or le ss than |5 kg / m 2 | . Figu r e 2: Scat ter plo t o f predicted TCW V v ersus true TCW V Figu r e 3: Error predictio n 4.1 Val idation against dependent data sets We com pa red two data sets of total col u m n wate r vapor t h at did no t pa rtici pat e in le a rning phase to the me asur e from ERA-5 at t h e sa me date. F i gur e 4 show a com par ison of TCWV predic t ed and T CWV me a sured above bot h la nd and oce an on January 2004. The global me a n bias be t ween the t wo data sets is quite sm a ll: 0.10 kg / m 2 . Then , the T CWV re tr iev al fr om t he othe rs parame t e rs by using neural network a re obtaine d wit h good accuracy . Ja nuary me a n T CWV range s from 0.5 to 57 kg / m 2 . We denoted m axi m u m val u e s between -5° N to 5°N. I nternational Jo urna l of Data Mining & Knowl edge Manag ement P ro cess (I JDKP) Vol. 9, No.6 , No vem ber 2019 17 4.2 Val idation against i ndependent dat a sets Com par ison b etween the Total Column Water Vapor (TCWV) retrieved wi t h the GOME - 2 instrume nt on board of the M etOp-A sa te lli t e ( c) , the r etrieved T CWV fr o m mode l with using the ECMWF ERA-5 parame t e rs rean a ly s is (b) and the me asur ed T CWV of ECMWF ERA-5 (a) in May 2007 can be seen in fig ur e 5. The pattern s fo r t he t h ree b o x e s are ve r y simil ar . We can obse rve t h at the highe st values are all l ocated b e tween - 5°N and 10°N. Figu r e 4: Map o f the TCW V ECMWF ERA-5 a n aly sis (a) w ith the co rr espo n ding retrie ve d from the neural netwo rk model(b ) in Janua r y 2004. I nternational Jo urna l of Data Mining & Knowl edge Manag ement P ro cess (I JDKP) Vol. 9, No.6 , No vem ber 2019 18 Figu r e 5 :M ap o f th e TCWV ECMW F ER A-5 analy sis (a) w ith t h e co rr espo n ding r et riev ed from the neu r al netwo rk model (b) a n d GOM E2 ob servations dat a (c) in May 2007. The resul ts shows the a ccuracy of the ne ur al model to retrieve d total col u mn w at e r vapor f r om few para me t e rs. T he f igure 5 perm it us to see that the r e is not mo r e diffe r en ce b etween th e me a sur ed value s (a) and the pr e dicted valu e s (b) but th ese last two have li ttle diffe r en ce with (c). We can s ee t hat the wat e r vapor patt e rns ove r land and oce a n a re clearly visi b le with moist In t e rt ropi cal Conve r gence Z one ne ar the eq uat o rial r eg i on s. We ar e plo t ting the a nn ual TC WV a ve ra ge retrieved for ye a rs 2004 and 2005. T he plots conce r n the latitudinal t ranse ct at 0°N, 15°N and 30°N of T CWV, outputted by the neural netwo r k model I nternational Jo urna l of Data Mining & Knowl edge Manag ement P ro cess (I JDKP) Vol. 9, No.6 , No vem ber 2019 19 using the annual ave r age of t he ni ne paramete rs as i nputs for ye a rs 2004 and 2005, a nd compared by the annual T CWV ECMWF ERA-5 anal ysis a ve ra ge (figur e 6). W e a l so calc u late t he co rr e sp ond ing p e rf o r m a n ces between the predicted a nnual TCWV ave ra ge and the annual TC WV ECMWF ERA -5 a n a l ysis a ve ra ge a t three latitudes f o r years 2004 and 2005 (Tab.1 and Tab. 3) . In addi tion, the perfor m a nce of pr edi ct ed a n nual TCWV ave r age a nd tho s e o f the GOME2 obse rvations TCWV ar e calc ulate and c ompared (Ta b.2 and Tab.4). For the s e correl ati on s, there ar e all qui t e high (> 90%) e xcept at latitude 0°N when they a re around 60 -70%. Fr o m ta b.1 to tab.4, we can obse r ve t he lowness of stand a rd devi ati on fo r the years 2004 and 2005. Figu r e 6 : A nn u alTCWV av erage fo r y ear 2 004 (lef t) and 200 5 (right ) at diff erent latitudes I nternational Jo urna l of Data Mining & Knowl edge Manag ement P ro cess (I JDKP) Vol. 9, No.6 , No vem ber 2019 20 Tab.1: P r edic ted TCWV vs .TCWV ECMW F ERA-5 analy si s fo r 2004 Standard dev iati on (k g/m2) Correlation (%) Latitude 0° N 6.73 93.32 Latitude 15° N 4.52 76.68 Latitude 30° N 5.18 94.78 Tab.2: P r edic ted TCWV vs .TCWV GO ME2 ob s ervations data fo r 2004 Standard dev iati on (k g/m2) Correlation (%) Latitude 0° N 2.61 60.33 Latitude 15° N 7.76 91.59 Latitude 30° N 5.12 90.44 Tab.3: P r edic ted TCWV vs .TCWV ECMW F ERA-5 analy si s fo r 2005 Standard dev iati on (k g/m2) Correlation (%) Latitude 0° N 6.23 76.62 Latitude 15° N 7.75 95.26 Latitude 30° N 6.42 92.21 Tab.4: P r edic ted TCWV v s. TCWV GOM E2 o bse r v at io n s d ata fo r 2005 Standard dev iati on (k g/m2) Correlation (%) Latitude 0° N 2.61 63.4 Latitude 15° N 7.57 93.06 Latitude 30° N 4.6 92.05 5. C ONCLU SION In this paper, a focus was m ade on t he abi lity of deep le ar ning to pr edi ct the T CWV by us ing geo p hy sical parame t e rs a s Me an s ea l eve l pr e ssur e , Surface pr e ssure, S e a surface temperatur e , 100 me t r e U wind c om p onen t, 100 me t re V wind componen t, 10 me tr e U wind c omponen t, 10 me tr e V wind c om p onen t, 2 me tr e dewpoin t temperatur e , 2 me tr e t em p e ra ture. We analyze the retrieved TC WV a nd c om par e its r e sults wi t h Gome2 observ ati on s . The re a re hi gh precision w ith a m e a n glo bal bi as eq ual to 0.10 k m/m 2 and the MA E is 3.41 k g/m 2 . The ann ua l prediction average of TC WV fo r three tr ansec ts a t 0°N, 15°N a n d 30°N compared t o r e al me a sureme nt show good re sult about the ef f ective of the dee p ne ur al reg r e s sion model. Ack now ledgements Europe a n Cen tr e for Medium-Range We ather Forecasts. 2017, update d mon t hly. ERA5 Re a n alys i s. Re s e ar ch Data A r chi ve at the Nation al C en t e r for Atmosphe r ic R ese ar ch , Com putat i onal and In f o r m a tion Syste ms La bo ra to ry. https://doi.o rg/10.5065/D6X34W69. A cc e ss ed 05 Fe b. 2019. I nternational Jo urna l of Data Mining & Knowl edge Manag ement P ro cess (I JDKP) Vol. 9, No.6 , No vem ber 2019 21 R EFEREN CES [1] IPCC, 2007: Climate Cha n ge 2007: The P h y sical Science Basis Cont r ibutio n of Working Group I to the Fo urth Asses sment Re port of th e Intergov er nme n tal Panel on C limate Change [ S .Solomo n, D . Qin, M. Manning, Z . Chen, M. Marquis, K.B. Av ery t, M.Tigno r and H .L. Mille r (ed s.),] , Cambridge U n ive r sity Press, C ambridge, U n ited K ingdom and New York, NY, U SA. https://w ww .i pcc .ch/r epo r t/ar4/sy r /, 2007 [2] S. B. Mo ckler, 1995: Spec ia l r epo rt : Wa ter vapo r in the climate s y stem. Amer. Geo ph y s. Union. [Av ail able online at w ww.eso . org/ge n -fac/pubs /astclim/espa s/pwv/mo ckler.html.] [3] Fo r sy th e, J., S. Kidde r, S. Kuss elso n , A .S. Jo nes,T.H . Vo nder Haar, 20 09: I n creasing the landcov er age of b lended m ultise n so r to ta l prec ipitablew at er p roducts fo r w eathe r analy sis. 16thConfe r e n ce o n Satel lite Me teorolo gy andOceanog r ap h y , Phoe n ix, A rizo n a. http://a ms.confe x.com/ams/89a nnual/tec hprogram/p aper _ 149348. htm [4] J. Shi, C. Xu, J. Guo, and Y. Gao, “R eal -t i me GPS prec ise poin tpo sit ioni ng -base d prec ipitable w at er vapo r estimatio n fo rra infal l monito ring and fo r ec asting,”IEEE Tra n sac tions o n Geo science an d Re m o te Sensing, vo l. 53, no. 6, pp. 34 52 – 3459,2015. [5] Hinton, G.; Osinde ro, S .; Teh, Y.W. A fast lea rning algorithm f or dee p be lief n ets.Neu r al Comput.2006 , 18 , 1527 – 155 4. [6] N.K. M anasw i ( 2018) Re gr es sion to MLP in Keras. I n: Dee p L earning w i th Applicat ions Using Py th on. Ap r es s, Be r keley , CA [7] Y.Bengio, Lea rning dee p arc hitectures fo r AI.Fo un d at. Tre nds Mac h . Le arn. 2 009,2, 1 – 1 27. [8] D. P. Kingm a and J. Ba, “Ad am: A Met h o d fo r Sto cha st ic Optimizat ion” in Inte rnatio n al Confe r e nce on Lea rn ing R eprese nta tio ns, 2015 [9] Y. A. Lec un , L. B otto u, Y. Be n gio and P. Haf fn er, Gradie n t-base d lea rning applied to doc ument reco gn itio n, in P r oc eedings of th e I EEE, vo l . 86, n o. 11 , pp. 2278-2324, No v 1998 .
Original Paper
Loading high-quality paper...
Comments & Academic Discussion
Loading comments...
Leave a Comment