Data-Driven Optimization of Public Transit Schedule
Bus transit systems are the backbone of public transportation in the United States. An important indicator of the quality of service in such infrastructures is on-time performance at stops, with published transit schedules playing an integral role go…
Authors: Sanchita Basak, Fangzhou Sun, Saptarshi Sengupta
Data-Driv en Optimization of Public T ransit Sc hedule Sanc hita Basak, F angzhou Sun, Saptarshi Sengupta and Abhishek Dub ey Departmen t of EECS, V anderbilt Universit y , Nash ville, TN, USA { sanchita.basak@vanderbilt.edu, fzsun316@gmail.com, saptarshi.sengupta@vanderbilt.edu, abhishek.dubey@vanderbilt.edu } Abstract. Bus transit systems are the bac kb one of public transporta- tion in the United States. An imp ortan t indicator of the qualit y of service in suc h infrastructures is on-time p erformance at stops, with published transit schedules pla ying an in tegral role gov erning the level of success of the service. How ever there are relatively few optimization architectures lev eraging stochastic searc h that focus on optimizing bus timetables with the ob jective of maximizing probabilit y of bus arriv als at timepoints with dela ys within desired on-time ranges. In addition to this, there is a lack of substan tial researc h considering mon thly and seasonal v ariations of dela y patterns in tegrated with such optimization strategies. T o address these, this pap er mak es the following contributions to the corpus of studies on transit on-time p erformance optimization: (a) an unsup ervised cluster- ing mec hanism is presen ted whic h groups months with similar seasonal dela y patterns, (b) the problem is form ulated as a single-ob jectiv e op- timization task and a greedy algorithm, a genetic algorithm (GA) as w ell as a particle swarm optimization (PSO) algorithm are employ ed to solv e it, (c) a detailed discussion on empirical results comparing the al- gorithms are pro vided and sensitivity analysis on hyper-parameters of the heuristics are presented along with execution times, which will help practitioners lo oking at similar problems. The analyses conducted are insigh tful in the local context of improving public transit sc heduling in the Nashville metro region as well as informativ e from a global p ersp ec- tiv e as an elab orate case study which builds up on the growing corpus of empirical studies using nature-inspired approac hes to transit schedule optimization. Keyw ords: timetable optimization · genetic algorithm · particle swarm optimization · sensitivity analysis · scheduling 1 In tro duction Bus systems are the bac kb one of public transp ortation in the US, carrying o ver 47% of all public passenger trips and 19,380 million passenger miles in the US [18] . F or the ma jority of cities in the US which do not hav e enough urban forms or budget to build exp ensive transit infrastructures lik e subw ays, the reliance is on buses as the most imp ortant transit system since bus systems hav e adv antages 2 Basak, Sun, Sengupta and Dub ey of relatively low cost and large capacit y . Nonetheless, the bus system is also one of the most unpredictable transit mo des. Our study found that the av erage on- time p erformance across all routes of Nash ville bus system was only 57.79% (see Section 6.1). The unpredictability of dela y has b een selected as the top reason wh y p eople av oid bus systems in many cities [2]. Pro viding reliable transit service is a critical but difficult task for all metrop o- lis in the world. T o ev aluate service reliabilit y , transit agencies hav e dev elop ed v arious indicators to quantify public transit systems through several key p erfor- mance measuremen ts from differen t p ersp ectives [4]. In the past, a num b er of tec hnological and so ciological solutions hav e help ed to ev aluate and reduce bus dela y . Common indicators of public transit system ev aluation include sc hedule adherence, on-time p erformance, total trip trav el time, etc. In order to trac k the transit service status, transit agencies hav e installed A VL on buses to track their real-time lo cations. How ever, the accuracy of A VL in urban areas is quite limited due to the low sampling rate (every minute) and the impact of high buildings on GPS devices. T o hav e some basic controls during bus op eration, public transit agencies often use time p oint strategies, where sp ecial timing bus stops (time p oints are sp ecial public transit stops where transit vehicles try to reac h at scheduled times) are deploy ed in the middle of bus routes to provide b etter arriv al and departure time synchronizations. An effective approach for improving bus on-time p erformance is creating timetables that maximize the probability of on-time arriv als by examining the actual dela y patterns. When designing schedules for real-world transp ort sys- tems (e.g. buses, trains, container ships or airlines), transport planners typi- cally adopt a tactical-planning approach [10]. Con ven tionally , metro transit en- gineers analyze the historical data and adjust the scheduled time from past exp erience, whic h is time consuming and error prone. A n umber of studies hav e b een conducted to improv e bus on-time performance by reliable and automatic timetabling. Since the timetable scheduling problem is recognized to b e an NP- hard problem [28] , man y researc hers ha ve emplo yed heuristic algorithms to solv e the problem. The most p opular solutions include ad-hoc heuristic searching algo- rithms (e.g. greedy algorithms), neighborho o d search (e.g. simulated annealing (SA) and tabu searc h (TS)), evolutionary search (e.g. genetic algorithm) and h ybrid searc h [24]. Ho wev er, there are few sto chastic optimization mo dels that fo cus on opti- mizing bus timetables with the ob jective of maximizing the probabilit y of bus arriv als at timep oin t with dela y within a desired on-time range (e.g. one minute early and fiv e min utes late), which is widely used as a k ey indicator of bus service qualit y in the US [1]. A timep oint is a bus stop that is designed to accurately record the timestamps when buses arrive and leav e the stop. Bus drivers use timep oin ts to synchronize with the sc heduled time. F or example, to quantify bus on-time arriv al p erformance, many regional transit agencies use the range of [- 1,+5] minutes compared to the sc heduled bus stop time as the on-time standard to ev aluate bus p erformance using historical data [1]. The actual op eration of bus systems is vulnerable to man y internal and external factors. The external Data-Driv en Optimization of Public T ransit Schedule 3 Fig. 1. The proposed to olb o x for bus on-time p erformance optimization. City planners use bus schedule, historical trip information and desired on-time range and lay ov er time, and get outputs of optimized timetable as well as estimated on-time p erformance. factors include urban ev ents (e.g., concerts, sp orting ev ents, etc.), sev ere w eather conditions, road construction, passenger and bicycle loading/offloading, etc. One of the most common internal factors is the dela y b etw een tw o consecutive bus trips, where the arriv al dela y of previous trips causes departure delay of the next trip. F urthermore, there are monthly and seasonal v ariation in the actual dela y patterns, but most transit agencies publish a uniform timetable for the next several mon ths despite the v ariations. Ho w to cluster the patterns and op- timize timetables separately remains an op en problem. F urthermore, heuristic optimization techniques hav e attracted considerable attention, but finding the optimal v alues of hyper-parameters are difficult, since they dep end on nature of problem and the sp ecific implemen tation of the heuristic algorithms, and are generally problem sp ecific. Researc h Con tributions: In this pap er, the monthly and seasonal delay patterns are studied and outlier analysis and clustering analysis on bus trav el times to group months with similar patterns together are carried out. The fea- ture vectors are aggregated by routes, trips, directions, timep oint segmen ts and mon ths encompassing mean, median and standard deviation of the historical tra vel times. This work significantly extends prior work on the problem as in [23]. Along with a greedy algorithm and a Genetic Algorithm (GA), swarm based optimization algorithm has b een introduced in this w ork, where the semi- autonomous agen ts in the swarm can update their status guided b y the full kno wledge of the entire p opulation state. Thus, Particle Swarm Optimization (PSO) [14] algorithm is employ ed in this work to generate new timetables for mon th clusters that share similar delay patterns with the goal of testing b oth ev olutionary computing and sw arm in telligence approaches. It is observed that the optimized on-time p erformance av eraged across all bus routes has increased b y emplo ying PSO as compared to that b y GA. Also the execution times of PSO are muc h less than GA and are more stable indicating lesser v ariability of results ov er different runs. Sensitivit y analysis on choosing the optimal hyper- parameters for the prop osed heuristic optimization algorithms are also presented. A stabilit y analysis of the resp ective algorithms hav e b een put forw ard b y study- 4 Basak, Sun, Sengupta and Dub ey ing the on-time p erformance and execution time ov er several runs. The ov erall w orkflow of the prop osed optimization mechanisms is illustrated in Figure 1. The rest of the pap er is organized as follo ws: Section 2 compares our work with related w ork on transit timetabling; Section 3 presents the problem for- m ulation; Section 4 presents the details of the transit data stores; Section 5 discusses the timetable optimization mec hanisms used; Section 6 ev aluates the p erformance of the optimization mechanisms and presents sensitivity analysis results; Section 7 presents concluding remarks and future work. 2 Related W ork and Challenges This section compares our system with related work on transit timetable schedul- ing. A num b er of studies hav e b een conducted to pro vide timetabling strategies for v arious ob jectives: (1) minimizing av erage waiting time [27] (2) minimizing transfer time and cost [7][12][24], (3) minimizing total trav el time [17], (4) max- imizing num b er of simultaneous bus arriv als [9], [13], (5) minimizing the cost of transit op eration [26], (6) minimizing a mix of cost (b oth the user’s and the op erator’s) [6]. The design of timetable with maximal synchronizations of bus routes without bus bunching has been researched b y Ibarra-Ro jas et al. [13]. The bus sync hro- nization strategy has been discussed from the p ersp ective of taking waiting time in to account in the transfer stops in the work of Eranki et al. [9]. An impro ved GA in minimizing passenger transfer time considering traffic demands has b een explored b y Y ang et al. [12]. T raffic and comm uter demand has also b een consid- ered in the work b y W ang et al. [27]. Other than emplo ying optimization algo- rithms several deep learning techniques [22] hav e b een applied in bus scheduling problems [15]. Na yeem et al. [17] set up the optimization problem o ver sev eral criteria, suc h as minimizing trav el time and num b er of transfers and maximizing passenger satisfaction. A route design and neighborho o d search through genetic algorithm minimizing num b er of transfers has b een discussed by Szeto et al. [24]. Zhong et al. [29] used improv ed Particle Sw arm Optimization for recognizing bus rapid transit routes optimized in order to serv e maxim um n umber of passengers. 2.1 Researc h Challenges (a) Clustering Monthly and Seasonal V ariations in Historical Ar- riv al Data: Studying the historical trav el time at segmen ts can b e an effective w ay to set bus timetables. How ever, existing work do esn’t consider the monthly and seasonal v ariation in historical monthly data, and the v ariation can be uti- lized for b etter scheduling. Generating one timetable for all months ma y not b e the b est solution. As traffic and dela y patterns are prone to c hanges o v er seasonal v ariations and v arious times, we generate clusters grouping months with unsuper- vised algorithm and dev elop optimization strategies for the generated clusters. Data-Driv en Optimization of Public T ransit Schedule 5 T able 1. The sc heduled time and recorded actual arriv al and departure time of tw o sequen tial trips that use the same bus of route 4 on Aug. 8, 2016. The arriv al delay at the last timep oint of the first trip accum ulates at the first timep oint of the second trip. Timep oin ts MCC4 14 SY19 PR GD GRFST A TO T rip 1 Sc heduled Time 10:50 AM 11:02 AM 11:09 AM 11:18 AM Actual Arriv al Time 10:36 AM 11:10 AM 11:18 AM 11:27 AM Actual D eparture Time 10:50 AM 11:10 AM 11:18 AM 11:30 AM T rip 2 Sc heduled Time 11:57 AM 11:40 AM 11:25 AM 11:20 AM Actual Arriv al Time 12:11 PM 11:51 AM 11:34 AM 11:27 AM Actual D eparture Time 12:11 PM 11:51 AM 11:34 AM 11:30 AM W e ev aluate the prop osed mechanism via simulation. The cluster-sp ecific sched- ule is shown to further increase the on-time p erformance compared to generating one uniform timetable. (b) Computing Efficien tly and Accurately in the Solution Space: T ransit p erformance optimization techniques rely on historical dela y data to set up new timetables. How ever, the large amoun t of historical data makes it a c hal- lenge to compute efficiently . F or example, Nashville MT A updates the bus sched- ule every 6 mon ths but eac h time there are about 160,000 historical record entries to use. Moreov er, the solution space has typically very large under constrain ts (e.g., sufficient dwelling time at bus stops, adequate lay o ver time b et ween trips, etc.). A suitable optimization algorithm is necessary for efficient and ac curate computation. Since this is a discrete-v ariable optimization problem, gradien t- based metho ds cannot b e used and gradien t-free metho ds need to b e considered. A naive algorithm for discrete optimization is exhaustiv e search, i.e., every fea- sible time is ev aluated and the optim um is c hosen. Exhaustiv e searc h w orks for a small finite num b er of choices, and cannot b e used for high-dimensional prob- lems. Genetic algorithm [7][6], as w ell as particle swarm optimization [14] are used commonly in solving heuristic problems . Thus we consider applying ge- netic algorithm and particle sw arm optimization (PSO) in the con text. Section 5 describ es the key steps of how we apply greedy , genetic and PSO algorithms to solv e the timetable optimization problem. 3 Problem F orm ulation T ypically , transit delay are not only affected b y external factors (suc h as traffic, w eather, trav el demand, etc.), but also by some internal factors. F or example, the accum ulated delay o ccurred on previous trips may cause a dela y in consec- utiv e trips by affecting the initial departure time of the next trip. In order to illustrate the problem context with simplicity and without generality , w e take t wo sequen tial bus trips of route 4 in Nashville as an example (the scheduled time and the actual arriv al and departure time recorded on Aug. 8, 2016 are 6 Basak, Sun, Sengupta and Dub ey Fig. 2. (a) A route segment on bus route 3 leaving down town; (b) The v ariance of actual tra vel time and (c) the relative standard deviation of actual trav el times on a bus route segment in time p eriod b etw een Sept. 1, 2016 and F eb. 28, 2017. sho wn in T able 1) to describ e the optimization problem. On each service day , after a v ehicle of the first trip (121359) arrives at the last stop (Timepoint GRF- ST A TO) with scheduled time of 11:18 AM, the second trip is sc heduled to depart using the same v ehicle from the same stop at 11:20 AM. On Aug. 8, 2016, the arriv al time at the last stop (Timepoint GRFST A TO) of the first trip (121359) is exceptionally late for 9 minutes, whic h contributes to the 10-minute depar- ture delay at the beginning of the second trip. Since the scheduled la yo ver time b et ween the tw o trips is only 2 minutes (b etw een 11:18 AM and 11:20 AM), any large delay at the first trip is very lik ely to transfer to the next trip. Therefore, the optimization problem should inv olve a pro cess that considers not only the tra vel delay on segments, but also the improp er lay o ver time b etw een trips. Figure 2 illustrates the large v ariation of bus trav el time distribution. The example sho ws trav el time data collected from bus trips depart at a specific time of the day on route 3 in Nashville. The co efficient of v ariation (also known as relativ e standard deviation) , which is a standardized measure of disp ersion of a probabilit y distribution, is v ery high on all timep oin ts along the route. The complexit y and uncertain ty of trav el times in tro duce great c hallenges to the task of timetable optimization. 3.1 Problem Definition F or a given bus trip sc hedule b , let H = { h 1 , h 2 , ..., h m } b e a set of m his- torical trips with each trip passing n timep oin ts { s 1 , s 2 , ..., s n } . So the on-time p erformanc e of the bus trip sc hedule b can b e defined as a ratio of an indica- tor function I ( h i , s j ) summed ov er all timep oints for all historical trips to the pro duct of the total num b er of historical trips and total num b er of timep oin ts. The indicator function I ( h i , s j ) is 1 if d i,j ∈ [ t earl y , t late ], otherwise 0, where d i,j = t arr iv al h i ,s j − T arr iv al h i ,s j Data-Driv en Optimization of Public T ransit Schedule 7 The ob jective is to design a schedule optimization problem to generate new T departur e h,s , ensuring on-time p erformance maximization. t earl y and t late are tw o time parameters pre-defined by the transit authority as a measure of schedule main tenance and d i,j is the actual delay that arriving in timepoint s j . 4 Data Store 4.1 Data Sources W e established a cloud data store and reliable transmission mechanisms to feed our Nashville Metrop olitan T ransit Authority (MT A) updates the bus sc hedule information every six months and provides the sc hedule to the public via GTFS files. In order to co ordinate and track the actual bus op erations along routes, MT A has deploy ed sensor devices at sp ecially bus stops (called timep oints) to accurately record the arriv al and departure times. In Nash ville, there are ov er 2,700 bus stops all ov er the city and 573 of them are timep oint stops. Cit y planners and MT A engineers analyze the arriv al and departure records regularly to up date the transit sc hedule. The details of the datasets are as follows: – Static GTFS. This dataset defines the static information of bus schedule and asso ciated geographic information, such as routes, trips, stops, depar- ture times, service days, etc. The dataset is pro vided in a standard transit sc hedule format called General T ransit F eed Specification (GTFS). – GTFS-r e altime. This dataset is recorded real-time transit information in GTFS-realtime format, which include bus locations, trip updates and service alerts. The GTFS-realtime feed is collected and stored in one-min ute in terv al. – Timep oints. This dataset provides accurate and detailed historical arriv al and departure records at timep oint stops. The information include route, trip, timep oin t, direction, vehicle ID, op erator, actual arriv al and departure time, etc. The dataset is not a v ailable in real-time but collected manually b y Nash ville MT A at the end of eac h mon th. Ev en though the same timep oin t datasets are utilized in the study , the pro- p osed method is not limited to the timep oin t datasets and can use some surro- gate data sources: (1) automatic passenger counters (APC) data: APC datasets records b oth passenger counts and departure/arriv al times at stops (2) GTFS- realtime feed: the real-time bus locations rep orted b y automatic vehicle lo cator (A VL) installed on buses. Compared with timep oint datasets, APC data also pro vides accurate times at normal stops thus it is the most suitable alternative dataset. Ho wev er, GTFS-realtime suffers from lo w sampling rate and low accu- racy in the city and ma y reduce the performance of the prop osed mechanism. 4.2 Data Cleaning Since raw transit dataset often contains missing, duplicate and erroneous sam- ples, preprocessing is a necessary step to prepare a clean and high-quality dataset. 8 Basak, Sun, Sengupta and Dub ey Missing data issue o ccurs due to hardware or netw ork problems. Generally , there are samples with missing data can b e dropp ed or filled with a sp ecific or a verage v alues. Duplicated data (e.g., a bus trip is recorded more than one time) will o versample certain dela y v alues and mak e the delay dataset biased. W e drop the trips with no historical records and remov e duplicated records. Outliers are v alues that are distan t from most of the observed data in presence of which clustering can b e inappropriate. K-means clustering algorithm is also sensitiv e to outliers presen t in the data. The approach taken here is to calculate Median Absolute Deviation (MAD), a robust measure of statistical disp ersion. The MAD of a data set [ X = ( x 1 , x 2 , ..., x n )] can b e calculated as: M AD = median ( | x i − median ( X ) | ). F or normal distribution the scaled MAD is defined as (MAD/0.6745), appro ximately equal to the standard deviation. x i is considered an outlier if the difference b etw een x i and median is larger than three times of standard deviation (i.e. scaled MAD). 5 Timetable Optimization Mec hanisms 5.1 Mon th Grouping b y Clustering Analysis This section introduces a clustering analysis mechanism that groups months with similar transit delay patterns together and the results will later b e used to generate separate timetables for eac h group. F e atur e Engine ering. W e assume the monthly delay patterns can b e repre- sen ted by the mean, median and standard deviation that derived from historical dela y data. Considering a bus trip consists of n timep oints, there are n − 1 seg- men ts b etw een the timep oints. The mean v alue µ , the median v alue m , and the standard deviation σ of the historical trav el times for eac h timep oint segment in eac h month are integrated to generate feature vectors to represent the historical dela y data distribution: [ µ 1 , m 1 , σ 1 , µ 2 , m 2 , σ 2 , ..., µ n − 1 , m n − 1 , σ n − 1 ] (1) Month Clustering. Clustering is an unsup ervised/sup ervised learning tech- nique for grouping similar data. W e employ k-means algorithms to identify the homogeneous groups where months share similar patterns. The trip data p er mon th is first normalized and then clustered using feature v ectors (in Equa- tion 1) b y K-Means algorithm: arg min S k X i =1 X x ∈ S i k x − µ i k 2 (2) where µ i is the mean of all datap oints in cluster S i . Determining the optimal n umber of clusters in a data set is a fundamental issue in partitioning clustering. F or k-means algorithms, the num b er of clusters is a hyper-parameter that needs to be set manually . An upper b ound is set in adv ance. Elb o w [16], Silhouette [19] and gap statistic [25] metho ds are p opular direct and statistical metho ds to find Data-Driv en Optimization of Public T ransit Schedule 9 Fig. 3. The feature v ectors [mean, standard deviation, median] of the trav el time in 4 mon ths of 2016 for a segment (WE23-MCC5 5) on a bus trip of route 5. the optimal n umber of clusters. Particularly , Silhouette analysis is employ ed in this study to measure how close eac h p oint is to others within one cluster. The silhouette score s ( i ) is defined as: s ( i ) = b ( i ) − a ( i ) max { a ( i ) , b ( i ) } (3) where for each data p oint with index i in the cluster, a i is the av erage distance b et ween data i and the rest of data p oints in the same cluster, b i is the smallest a verage distance b etw een data i and every other cluster. Some other clustering tec hniques that can b e applied to these kind of problem can b e found in [20]. Example. Figure 3 plots the [mean, standard deviation, median] vectors of the monthly trav el time for a segmen t (WE23-MCC5 5) on a bus trip of route 5 (Figure 6(a)). F rom figure 3 the mon thly v ariation of the data is evident and hence tw o clusters ([May , June, July] and [August]) can b e formed from these four months of data to prepare distinct sc hedules for the clusters. 5.2 Estimating On-time Performance of T ransit Sc hedules Historic al Dwel l Time Estimation. T rav el demand at bus stops is imp ortant statistics for setting up proper schedule times. Ho w ever, for bus systems without automatic passenger counters (APCs), historical trav el demand (represented by n umber of comm uters b oarding) is not av ailable in original datasets. T o get demand patterns, we utilize historical arriv al and departure times to estimate the dwell time caused by passengers. Particularly , we consider the following t wo scenarios in historical records: (1) when a bus turns up at a stop, earlier than sc heduled time, the waiting time b etw een the scheduled time and actual departure time is used, (2) on the other hand, when it turns up later than sc heduled time, the waiting time b etw een the actual arriv al time and departure time is used. As shown in T able 1, for the timep oint SY19 on trip 1 w ith scheduled time of 11:02 AM: – F or the case when a bus arrived earlier at 10:58 AM instead of the scheduled time at 11:02 AM and departed at 11:04 AM, as the bus w ould alwa ys w ait 10 Basak, Sun, Sengupta and Dub ey there at least for 4 minutes (the difference b etw een the actual and scheduled arriv al time) irresp ectiv e of presence of passengers, the dwell time caused by passengers is calculated as the additional time tak en for departure after the sc heduled time (11:04 AM - 11:02 AM = 2 min utes). – On the other hand, if the bus arrived later at 11:05 AM and departed at 11:06 AM, then the dw ell time caused by passengers is calculated as the additional time sp en t after the actual arriv al time (11:06 AM - 11:05 AM = 1 minutes). A rrival Time Estimation. The arriv al time of a bus at a stop is impacted by t wo factors: (1) trav el times at segments b efore the stop, and (2) dwell times at the previous stops. W e assume that a bus will w ait un til the sc heduled time if it arriv es earlier than the scheduled time, and the historical trav el time b etw een tw o timep oin ts will remain the same in the simulation. In order to obtain an estimate of the arriv al time, the historical dwell time caused by commuters (which in turn is represen tative of the historical trav el demand), is factored into accoun t b y adding it to the arriv al time at an y timep oint. The simulation will stall for an additional time till the new scheduled time is reac hed in the even t that the previous sum is earlier than the new sc heduled time. By taking in to consideration the simulated departure time st depart h,s j at previous timep oin t s j , the actual trav el time t arr iv e s j +1 − t depart s j b et ween s j and s j +1 , the dwell time t dwell s j +1 , the simulated departure time st depart h,s j +1 at a timep oint s j +1 can b e found out. The new schedule time T depart h,ss j +1 at s j +1 is expressed as: st depart h,s j +1 = max( T depart h,ss j +1 , st depart h,s j + ( t arr iv e s j +1 − t depart s j ) + t dwell s j +1 ) (4) 5.3 Timetable Optimization Using a Greedy Algorithm W e employ ed a greedy algorithm that adjusts the sc heduled arriv al time greed- ily and sequentially for the succeeding segmen ts b etw een timep oints. The main ob jectiv e is to optimize the bus arriv al time for succeeding timep oints such that new optimized schedule is guaranteed to maximize the probability of bus arriv als b et ween any t wo consecutive stops with delay b ounded in the desired range of [ t earl y , t late ]. W e utilized the empirical cumulativ e distribution function (CDF) to ev aluate the percentage of historical delay in desired range instead of assuming that the data is dra wn from any sp ecific distribution (e.g. Gaussian distribution). An empirical CDF is a non-parametric estimator of the CDF of a random v ariable. The empirical CDF of v ariable x is defined as: ˆ F n ( x ) = ˆ P n ( X ≤ x ) = n − 1 n X n =1 I ( x i ≤ x ) (5) where I () is an indicator function: I ( x i ≤ x ) = ( 1 , if x i ≤ x 0 , otherwise (6) Data-Driv en Optimization of Public T ransit Schedule 11 Then the CDF of x in range [ x + t earl y , x + t late ] can b e calculated using the follo wing equation: ˆ F n ( x + t late ) − ˆ F n ( x + t earl y ) = n − 1 n X n =1 I ( x + t earl y ≤ x i ≤ x + t late ) (7) 5.4 Timetable Optimization Using Heuristic Algorithms The p erformance optimization for scheduling transit vehicles is a multidimen- sional problem and as suc h the ob jectiv e function is nonconv ex in nature con- sisting of several troughs and ridges. Hence, to compute the optimally scheduled routing strategy with acceptable time constraints, an approach p ow ered by high qualit y of solution estimation tec hniques such as evolutionary algorithms and metaheuristics can b e considered. Genetic Algorithm Genetic algorithm [11] is a heuristic optimization al- gorithm that derives from biology . The basic steps in volv ed in genetic algo- rithms include initialization, selection, crossov er, mutation, and termination. The timetable for each trip is decided by the scheduled departure time at the first stop as w ell as the scheduled tra vel time betw een any t wo subsequen t timep oin ts along the trip. Since our goal is to up date time tables to make the bus arriv als more on time, we assign the scheduled trav el times betw een timep oints as c hro- mosomes in p opulations, and use the on-time p erformance estimation mechanism prop osed in Section 5.2 as ob jective functions. The chromosome of the individual solutions in the genetic algorithm is a vector of integers representing trav el time b et ween subsequent timepoints. In order to reduce the search space and match the real-world scenarios, the trav el time in each individual is re-sampled to a m ultiple of 60 seconds and restricted to the unit of minutes. The p erformance of this algorithm is gov erned b y differen t h yp erparameters suc h as p opulation size, crosso ver and mutation rate controlling the algorithm’s exploitation and explo- ration capability . The c hoice of such h yp erparameters are explained in detail in section 6. P article Sw arm Optimization Eberhert and Kennedy [14] prop osed parti- cle sw arm optimization (PSO) as a sto chastic p opulation based optimization algorithm which can work with non-differen tiable ob jective function without ex- plicitly assuming its underlying gradient disparate from gradient descent tech- niques. The interested reader is directed to [21] b y Sengupta et al. for a detailed understanding of the algorithm. PSO has b een shown to satisfactorily provide solutions to a wide arra y of complex real-life engineering problems, usually out of scope of deterministic algorithms [8][5][3]. PSO exploits the collective intelli- gence arising out of grouping b ehavior of flo cks of birds or schools of fish.This manifestation of grouping is termed as ’emergence’, a phenomenon in whic h a 12 Basak, Sun, Sengupta and Dub ey cohort of individuals from a so cial net work is aimed to accomplish a task b e- y ond their individual capabilit y . Likewise, eac h particle in the swarm, represents a p otential solution to the multi-dimensional problem to b e optimized. Initialization Each particle has certain p osition which can b e though t of as a collection of co-ordinates representing the particle’s existence in a sp ecific region in the multidimensional h yp erspace. As a particle is a p otential solution to the problem, the particle’s p osition v ector has the same dimensionality as the problem. The velocity asso ciated with each particle is the measure of the step size and the direction it should mo ve in the next iteration. Eac h particle in the swarm maintains an n-dimensional v ector of trav el times. A t first, the p osition for each particle in the population is initialized with the set of trav el time b etw een the timep oints randomly selected b etw een the minim um and maxim um of the aggregated actual historical data. With sw arm size as p , ev- ery particle i (1 < i < p ) maintains a p osition vector x i =( x i 1 , x i 2 , x i 3 ,..., x in ) and a v elo city vector v i =( v i 1 , v i 2 , v i 3 ,..., v in ) and a set of p ersonal b ests p i =( p i 1 , p i 2 , p i 3 ,..., p in ). Optimization At eac h iteration, the p osition of a particle is up dated, and compared with the p ersonal b est ( pb est ) obtained so far. If the fitness due to the p osition obained at curren t iteration is more (as it is a fitness maximization problem) than the pb est obtained upto the previous iteration, then the curren t p osition b ecomes the p ersonal b est or pb est , otherwise pb est remains unchanged. Th us the b est p osition of a particle obtained so far is stored as pb est . The global b est or gb est is up dated when the p opulation’s ov erall current b est, i.e., the b est of the pbsest s is better than that found in the previous iteration. After initializing p ositions and velocities, eac h particle up dates its v elo city based on previous v elo cit y comp onent w eighted b y an inertial factor , along with a comp onent prop ortional to the difference b etw een its curren t p osition and pb est w eighted b y a cognition acceleration co efficient, and another comp onent propor- tional to the difference b et ween its current position and ( gb est ), weigh ted b y a so cial acceleration co efficien t. This is so cio-cognitive mo del of PSO and facili- tates information exchange b etw een members of the swarm. Since all members are free to interact with each other, the flow of information is unrestricted and the PSO algorithm is said to hav e a ’fully-connected’ top ology . While up dating the velocity , a particle’s reliance on its own personal best is dictated by its cog- nitiv e ability , and the reliance on the en tire swarm’s b est solution is dictated b y its so cial interactiv e nature. Hence those factors in the velocity comp onent are weigh ted by the cognition acceleration co efficient c1 and social acceleration co efficien t c2 . The new p ositions of the particles are up dated as the vector sum of the previous p ositions and the current v elo cities. Thus the p ositions of the particles, are updated aiming tow ards intelligen t exploration of the searc h space, and subsequen t exploitation of the promising regions in order to find the optimal solution based on fitness optimization of the stated problem. After eac h iteration is completed, the velocity and p osition of a particle are up dated as follo ws: v i,j ( t + 1) = w .v i,j ( t ) + c 1 .r 1 ( t ) . ( p i,j ( t ) − x i,j ( t )) + c 2 .r 2 ( t ) . ( p g ,j ( t ) − x i,j ( t )) (8) x i,j ( t + 1) = x i,j ( t ) + v i,j ( t + 1) (9) Data-Driv en Optimization of Public T ransit Schedule 13 ALGORITHM 1: Particle Swarm Optimization algorithm for bus on-time p erfor- mance optimization Data: D ← Historical timep oint datasets Input : (1) [ t early , t late ] ← on-time range , (2) maxI ter ← maximum n umber of iterations maxI ter , (3) npop ← num b er of particles in the p opulation size npop , (4) w ← inertia weigh t, (5) c 1 ← cognition acceleration co efficien t, (6) c 2 ← so cial acceleration coefficient, (7) h ← bus trip for optimization, (8) upper Limit ← upp er limit of the num b er of clusters Output: Optimized schedule b at timep oin ts for bus trip h GetAllTimep oin ts( D , h ); GetHistoricalData( D , h ); monthC luster s ← ClusterMonthData( upperLimit ); for monthCluster ∈ monthC l uster s do P ← []; for population size npop do Initialize each particle with random p osition and velocity P ← P ∪ I nitial I ndiv idual (); end while maxI ter is not r e ache d do Ev aluate the fitness function ( J ) for each particle’s p osition ( x ) if J(x) ¿ J(pb est) , then pbest = x g best ← Up date if the p opulation’s o verall current b est is better than that in previous iteration Up date the velocity of each particle according to equation (10) Up date the p osition of eac h particle according to equation (11) end Giv e gb est as the optimal schedule b at timepoints for bus trip h end v i,j and x i,j represen t the v elo city and p osition of the i-th particle in the j-th dimension. Cognition and so cial acceleration co efficien ts are indicated b y c 1 and c 2 , whereas r 1 and r 2 are random num b ers uniformly distributed b etw een 0 to 1. p i,j represen ts a particle 0 s p ersonal b est and p g ,j represen ts the global b est of the p opulation. w acts as an inertial weigh t factor con trolling the exploration and exploitation of new p ositions in the search space and t denotes the n umber of iterations. The problem is formulated as fitness maximization problem in order to bring out optimal trav el times to improv e on-time p erformance. Hence the p ersonal b est of a particle is up dated as follows at the end of each iteration. p i,j ( t + 1) = ( p i,j ( t ) , if f itness ( x i,j ( t + 1)) ≤ f itness ( p i,j ( t )) x i,j ( t + 1) , if f itness ( x i,j ( t + 1)) > f itness ( p i,j ( t )) (10) T ermination The termination condition set for PSO is the predefined max- im um num b er of iterations. Since the optimized on time p erformance is different for each trip, the termination condition is not set as an y predefined upp er limit 14 Basak, Sun, Sengupta and Dub ey T able 2. Comparison of original and optimized on-time p erformance av eraged across all bus routes for GA without and with clustering and PSO with clustering respectively . Original GA w/o. Clustering GA w. Clustering PSO w. Clustering On-time Perf. 57.79% 66.24% 68.34% 68.93% of the fitness v alue. With other hyperparameters fixed PSO can pro duce the optimal solution appro ximately in 30 iterations for this problem. The pseudo co de for PSO is discussed in Algorithm 3. Historical timep oint datasets are used to conduct the particle swarm optimization algorithm for this problem. The input includes on-time range, maximum n umber of iterations, n umber of particles in the p opulation size, inertia factor, cognition and so cial acceleration co efficient, bus trip and upper limit of n umber of month clusters. 6 Ev aluation of the Results 6.1 Ev aluating the Clustering Analysis T o ev aluate the effectiveness of the clustering analysis, w e compared the op- timized on-time p erformance with and without a clustering analysis step: (1) mon ths are not clustered and a single timetable is generated for all months, (2) mon th clustering is conducted at first and the optimization algorithms is applied on different month groups to generate separate timetables. T able 2 shows the original and optimized on-time p erformance on av erage across all bus routes. Using the genetic algorithm without clustering step im- pro ved the original p erformance from 57.79% to 66.24%. By adding the clustering step which groups months with similar patterns the p erformance was improv ed to 68.34%. Fig. 4. The c hart sho ws the simulation results of on-time p erformance and execution times f or GA and PSO to run 10 times. Data-Driv en Optimization of Public T ransit Schedule 15 6.2 Comparing Optimization Performance of Greedy , Genetic and PSO Algorithms The original on-time p erformance, optimized on-time p erformance using greedy algorithm, genetic algorithm and PSO are illustrated in Figure 5. It is observed that while all the algorithms can impro ve the on-time p erformance, the genetic algorithm and PSO outperforms the greedy algorithm because they optimize the schedule for all timep oint segments on each trip all together. The original on-time p erformance of all bus routes is 57.79%. The greedy algorithm impro ved it to 61.42% and the genetic algorithm impro ved it further to 68.34%. The PSO algorithm has a slightly b etter optimized on-time p erformance of 68.93%. Fig- ure 4 sho ws the simulation results of the stabilit y analysis for GA and PSO. Ev en though GA and PSO got similar on-time p erformance, with PSO surpassing the p erformance of GA b y a small extent, the execution times of PSO are m uch less than GA and are more stable. Fig. 5. The original on-time performance and the optimized on-time p erformance using greedy algorithm, genetic algorithm with/without clustering analysis and PSO algo- rithm. 6.3 Sensitivit y Analysis on the Hyp er-parameters of the Genetic algorithm W e designed three sim ulations that choose different hyper-parameters: (1) p op- ulation sizes that range from 10 to 110, (2) crossov er rates that range from 0.1 to 1.0, (3) mutation rates that range from 0.1 to 1.0. Real-world data is col- lected from Route 5, which is one of ma jor bus routes that connects down town Nash ville and the southw est comm unities in Nashville. The route contains 6 16 Basak, Sun, Sengupta and Dub ey timep oin t stops and 5 segments b etw een the 6 timep oint stops. The bus trips with direction from Do wnto wn are selected. The goal is to maximize the on-time p erformance for these trips by optimizing the schedule time at the 6 timep oint stops. Figure 6(b) shows the simulation results of choosing differen t p opulation sizes. Increasing the p opulation size from 10 to 90 results a b etter on-time p erfor- mance, ho w ever, increasing the size ever further do esn’t help making the on-time p erformance any b etter. On the other hand, the total time increases linearly as the p opulation size gro ws. So a p opulation size around 90 is the optimal size to use. Figure 6(c) illustrates results of using differen t crosso ver rates. The optimized on-time p erformance remains almost the same for the crossov er range, but there is a significant difference in terms of the total execution time. The crossov er rate impacts the exploitation ability . A prop er crossov er rate in the middle of the range can faster the pro cess to concen trate on an optimal p oint. Figure 6(d) show the simulation results when using differen t mutation rates. The total execution time is small when the mutation rate is either very small or v ery large. Mutation rates con trols the exploration ability . During the optimiza- tion, a small m utation rate will make sure the b est individuals in a p opulation do not v ary too muc h in the next iteration and th us is faster to get stable around the optimal p oints. So we suggest setting a v ery small m utation rates when running the prop osed algorithm. 6.4 Sensitivit y Analysis on the Hyp er-parameters of P article Sw arm Optimization W e designed four sim ulation setups that choose different hyper-parameters: (1) The inertial weigh t factor, w that range from 1 to 8, (2) So cial acceleration co ef- ficien t c1 that range from 1 to 8, (3) Cognition acceleration coefficient c2 that range from 1 to 8, and (4) Number of particles that range from 2 to 36. Real- w orld data regarding bus timings is collected from Route 8, which is one of the ma jor bus routes that connects Music City Cen tral Nashville and the Lipscomb Univ ersity in Nashville. The route contains 5 timep oint stops and 4 segments b et ween the 5 timep oint stops. The goal is to maximize the on-time p erformance for these trips by optimizing the schedule time at the 5 timep oin t stops. Figure 6(e) sho ws the simul ation result while optimizing for the inertial w eight w by v arying it. It is observed that the optimized on-time p erformance is at its p eak when w is nearly equal to 5 with less execution time. Performance deteriorates along with an increase in execution time as the selection is mov ed a wa y from 5. So, an optimal v alue to choose for w, will be somewhere around 5. Figure 6(f ) shows the simulation result for optimizing the cognition accelera- tion co efficient c1 b y v arying it. The particle has a v elo city comp onent to wards its own b est p osition weigh ted by c1 , hence the term ’cognitive’. It is observed that the optimized on-time p erformance is improv ed when c1 increases from 3 to 5 with less execution time. After that the p erformance deteriorates along with Data-Driv en Optimization of Public T ransit Schedule 17 Fig. 6. (a) Timep oints on bus route 5 in Nash ville [23], (b) The the on-time p erfor- mance and o verall execution time for differen t p opulation sizes for GA, (c) The on-time p erformance and ov erall execution time for different crosso ver rates, whic h controls the exploitation abilit y of the GA, (d) The on-time performance and o verall execution time for differen t mutation rates, which controls the exploration ability of the GA, (e) The on-time p erformance and ov erall execution time for different inertia weigh ts, exploring new regions of searc h space in PSO, (f ) The on-time performance and o verall execution time for different cognition acceleration co efficien ts c1, in PSO, (g) The on-time per- formance and ov erall execution time for different so cial acceleration co efficients c2, in PSO, (h) The on-time p erformance and ov erall execution time for v arious p opulation size, in PSO 18 Basak, Sun, Sengupta and Dub ey increase in execution time. So, an optimal v alue to c ho ose for c1 , will b e within the range sp ecified. Figure 6(g) shows the sim ulation result for optimizing for the so cial accelera- tion co efficient c2 b y v arying it. The particle has a v elo city comp onent to wards the global b est position weigh ted by c2 , hence the term social. It is observed that the optimized on-time p erformance is improv ed when c2 is equal to 5 with less execution time. Also, c2 b eing 4 pro duces go o d results, but there is an increase in execution time at that v alue. But the ov erall effect of parameter c2 affects the on-time p erformance only within a range of tw o p ercent. Sometimes, PSO is able to pro duce optimal or near optimal p erformance, when all other hyper- parameters are fixed, and thus is not sensitiv e to a particular h yp erparameter, whic h is the case considered here. So an optimal v alue to choose for c2 , may be close to 5, maintaining approximately a ratio near to 1:1:1 among w , c1 and c2 . Figure 6(h) shows the simulation result for optimizing the n umber of parti- cles by v arying the p opulation size. It is observed that the optimized on-time p erformance is maximized when the num b er of particles reaches 30. The execu- tion time increases with the n umber of particles, so it is b etter to choose such n umber of particles that pro duces the b est pair in the accuracy-execution time tradeoff. So, the p opulation size can be chosen as 30 in this case as it yields equally efficient results with a relativ ely small execution time. Although a go o d insight ab out c hoice of hyperparameters can b e obtained from this sensitivity analysis, v ariations of the hyperparameters may pro duce b etter results in sp ecific routes. 7 Conclusion In this pap er, w e presen ted researc h findings within a bus on-time performance optimization framew ork that significan tly extends our prior w ork [23] by prop os- ing a sto chastic optimization to olchain and presen ting sensitivity analyses on c ho osing optimal hyper-parameters. Particularly , we describ e an unsup ervised analysis mec hanism to find out how months with similar dela y patterns can b e clustered to generate new timetables. A classical, fully-connected PSO is b ench- mark ed against a greedy algorithm as well as a genetic algorithm in order to optimize the schedule time to maximize the probability of bus trips that reach the desired on-time range. It is observ ed that the PSO implementation improv es the bus on-time p erformance compared to other heuristics while requiring lesser execution time across all routes. Simulations of optimization performance as w ell as sensitivity analyses on the hyper-parameters of the GA and PSO algorithms are conducted. The results indicate different strategies for choosing betw een the genetic algorithm and PSO, and selecting optimal h yp er-parameters guided by the problem sp ecificity and resource av ailability . With the knowledge of this extensiv e study on applying guided random search tec hniques for bus on-time p erformance optimization and the selection of hyperparameters that generate promising results, a p ossible extension of this generalizable architecture to other real-w orld optimization problems is worth lo oking at as future work. Data-Driv en Optimization of Public T ransit Schedule 19 Ac kno wledgments This w ork is supp orted by The National Science F oundation under the aw ard n umbers CNS-1528799 and CNS-1647015 and 1818901 and a TIPS grant from V anderbilt Univ ersit y . W e ackno wledge the supp ort pro vided by our partners from Nashville Metrop olitan T ransp ort Authorit y . References 1. Arhin, S.A., No el, E.C., Dairo, O.: Bus stop on-time arriv al p erformance and cri- teria in a dense urban area. International Journal of T raffic and T ransp ortation Engineering 3 (6), 233–238 (2014) 2. Asso ciation, A.P .T.: Ridership rep ort archiv es (2017) 3. Banks, A., Vincen t, J., Any akoha, C.: A review of particle sw arm opti- mization. part ii: hybridisation, com binatorial, multicriteria and constrained optimization, and indicative applications. Natural Computing 7 (1), 109–124 (Mar 2008). h ttps://doi.org/10.1007/s11047-007-9050-z, https://doi.org/10. 1007/s11047- 007- 9050- z 4. Benn, H.: Bus route ev aluation standards, transit co op erative researc h program, syn thesis of transit practice 10. T ransp ortation Research Board, W ashington, DC (1995) 5. Bouy er, A., Hatamlou, A.: An efficient hybrid clustering metho d based on improv ed cuck o o optimization and mo dified particle swarm opti- mization algorithms. Applied Soft Computing 67 , 172 – 182 (2018). h ttps://doi.org/https://doi.org/10.1016/j.asoc.2018.03.011, http://www. sciencedirect.com/science/article/pii/S1568494618301273 6. Chakrob ort y , P .: Genetic algorithms for optimal urban transit netw ork design. Computer-Aided Civil and Infrastructure Engineering 18 (3), 184–200 (2003) 7. Chakrob ort y , P ., Deb, K., Subrahmany am, P .: Optimal scheduling of urban transit systems using genetic algorithms. Journal of transp ortation Engineering 121 (6), 544–553 (1995) 8. Dhabal, S., Sengupta, S.: Efficient design of high pass fir filter using quantum- b eha ved particle swarm optimization with weigh ted mean best position. In: Pro ceedings of the 2015 Third International Conference on Computer, Com- m unication, Control and Information T ec hnology (C3IT). pp. 1–6 (F eb 2015). h ttps://doi.org/10.1109/C3IT.2015.7060145 9. Eranki, A.: A model to create bus timetables to attain maximum synchronization considering waiting times at transfer stops (2004) 10. F an, W., Machemehl, R.B.: Optimal transit route netw ork design problem with v ariable transit demand: genetic algorithm approach. Journal of transp ortation engineering 132 (1), 40–51 (2006) 11. Goldb erg, D.E.: Genetic Algorithms in Search, Optimization and Mac hine Learn- ing. Addison-W esley Longman Publishing Co., Inc., Boston, MA, USA, 1st edn. (1989) 12. Hairong, Y., Day ong, L.: Optimal regional bus timetables using improv ed genetic algorithm. In: Intelligen t Computation T echnology and Automation, 2009. ICI- CT A’09. Second International Conference on. v ol. 3, pp. 213–216. IEEE (2009) 13. Ibarra-Ro jas, O.J., Rios-Solis, Y.A.: Synchronization of bus timetabling. T rans- p ortation Research Part B: Metho dological 46 (5), 599–614 (2012) 20 Basak, Sun, Sengupta and Dub ey 14. Kennedy , J., Eb erhart, R.: P article sw arm optimization. In: Neural Netw orks, 1995. Pro ceedings., IEEE International Conference on. vol. 4, pp. 1942–1948 vol.4 (Nov 1995). h ttps://doi.org/10.1109/ICNN.1995.488968 15. Khiari, J., Moreira-Matias, L., Cerqueira, V., Cats, O.: Automated setting of bus sc hedule cov erage using unsup ervised machine learning. In: Bailey , J., Khan, L., W ashio, T., Dobbie, G., Huang, J.Z., W ang, R. (eds.) Adv ances in Knowledge Disco very and Data Mining. pp. 552–564. Springer In ternational Publishing, Cham (2016) 16. Ko dinariy a, T.M., Makwana, P .R.: Review on determining num b er of cluster in k-means clustering. International Journal 1 (6), 90–95 (2013) 17. Na yeem, M.A., Rahman, M.K., Rahman, M.S.: T ransit net work design b y genetic algorithm with elitism. T ransp ortation Research Part C: Emerging T echnologies 46 , 30–45 (2014) 18. Neff, J., Dick ens, M.: 2016 public transp ortation fact bo ok (2017) 19. Rousseeu w, P .J.: Silhouettes: a graphical aid to the interpretation and v alidation of cluster analysis. Journal of computational and applied mathematics 20 , 53–65 (1987) 20. Sengupta, S., Basak, S., P eters, R.A.: Data clustering using a hybrid of fuzzy c-means and quantum-behav ed particle swarm optimization. In: 2018 IEEE 8th Ann ual Computing and Communication W orkshop and Conference (CCWC). pp. 137–142 (Jan 2018). https://doi.org/10.1109/CCW C.2018.8301693 21. Sengupta, S., Basak, S., P eters, R.A.: Particle swarm optimization: A survey of historical and recen t developmen ts with h ybridization p ersp ectives. Mac hine Learning and Kno wledge Extraction 1 (1), 157–191 (2018), http://www.mdpi.com/ 2504- 4990/1/1/10 22. Sengupta, S., Basak, S., Saikia, P ., P aul, S., Tsalav outis, V., Atiah, F., Ra vi, V., P eters, R.A.: A review of deep learning with special emphasis on architectures, applications and recent trends. CoRR abs/1905.13294 (2019), http://arxiv. org/abs/1905.13294 23. Sun, F., Samal, C., White, J., Dubey , A.: Unsupervised mechanisms for optimiz- ing on-time p erformance of fixed schedule transit vehicles. In: Smart Computing (SMAR TCOMP), 2017 IEEE International Conference on. pp. 1–8. IEEE (2017) 24. Szeto, W.Y., W u, Y.: A simultaneous bus route design and frequency setting prob- lem for tin shui wai, hong k ong. European Journal of Operational Researc h 209 (2), 141–155 (2011) 25. Tibshirani, R., W alther, G., Hastie, T.: Estimating the num b er of clusters in a data set via the gap statistic. Journal of the Ro yal Statistical So ciet y: Series B (Statistical Metho dology) 63 (2), 411–423 (2001) 26. Ting, C.J., Schonfeld, P .: Schedule coordination in a multiple h ub transit netw ork. Journal of urban planning and dev elopment 131 (2), 112–124 (2005) 27. W ang, Y., Zhang, D., Hu, L., Y ang, Y., Lee, L.H.: A data-driven and optimal bus sc heduling mo del with time-dep enden t traffic and demand. IEEE T ransactions on In telligent T ransp ortation Systems 18 (9), 2443–2452 (2017) 28. W u, Y., Y ang, H., T ang, J., Y u, Y.: Multi-ob jective re-sync hronizing of bus timetable: Mo del, complexity and solution. T ransportation Research Part C: Emerging T echnologies 67 , 149–168 (2016) 29. Zhong, S., Zhou, L., Ma, S., Jia, N., Zhang, L., Y ao, B.: The op- timization of bus rapid transit route based on an impro ved parti- cle swarm optimization. T ransp ortation Letters 10 (5), 257–268 (2018). h ttps://doi.org/10.1080/19427867.2016.1258972, https://doi.org/10.1080/ 19427867.2016.1258972
Original Paper
Loading high-quality paper...
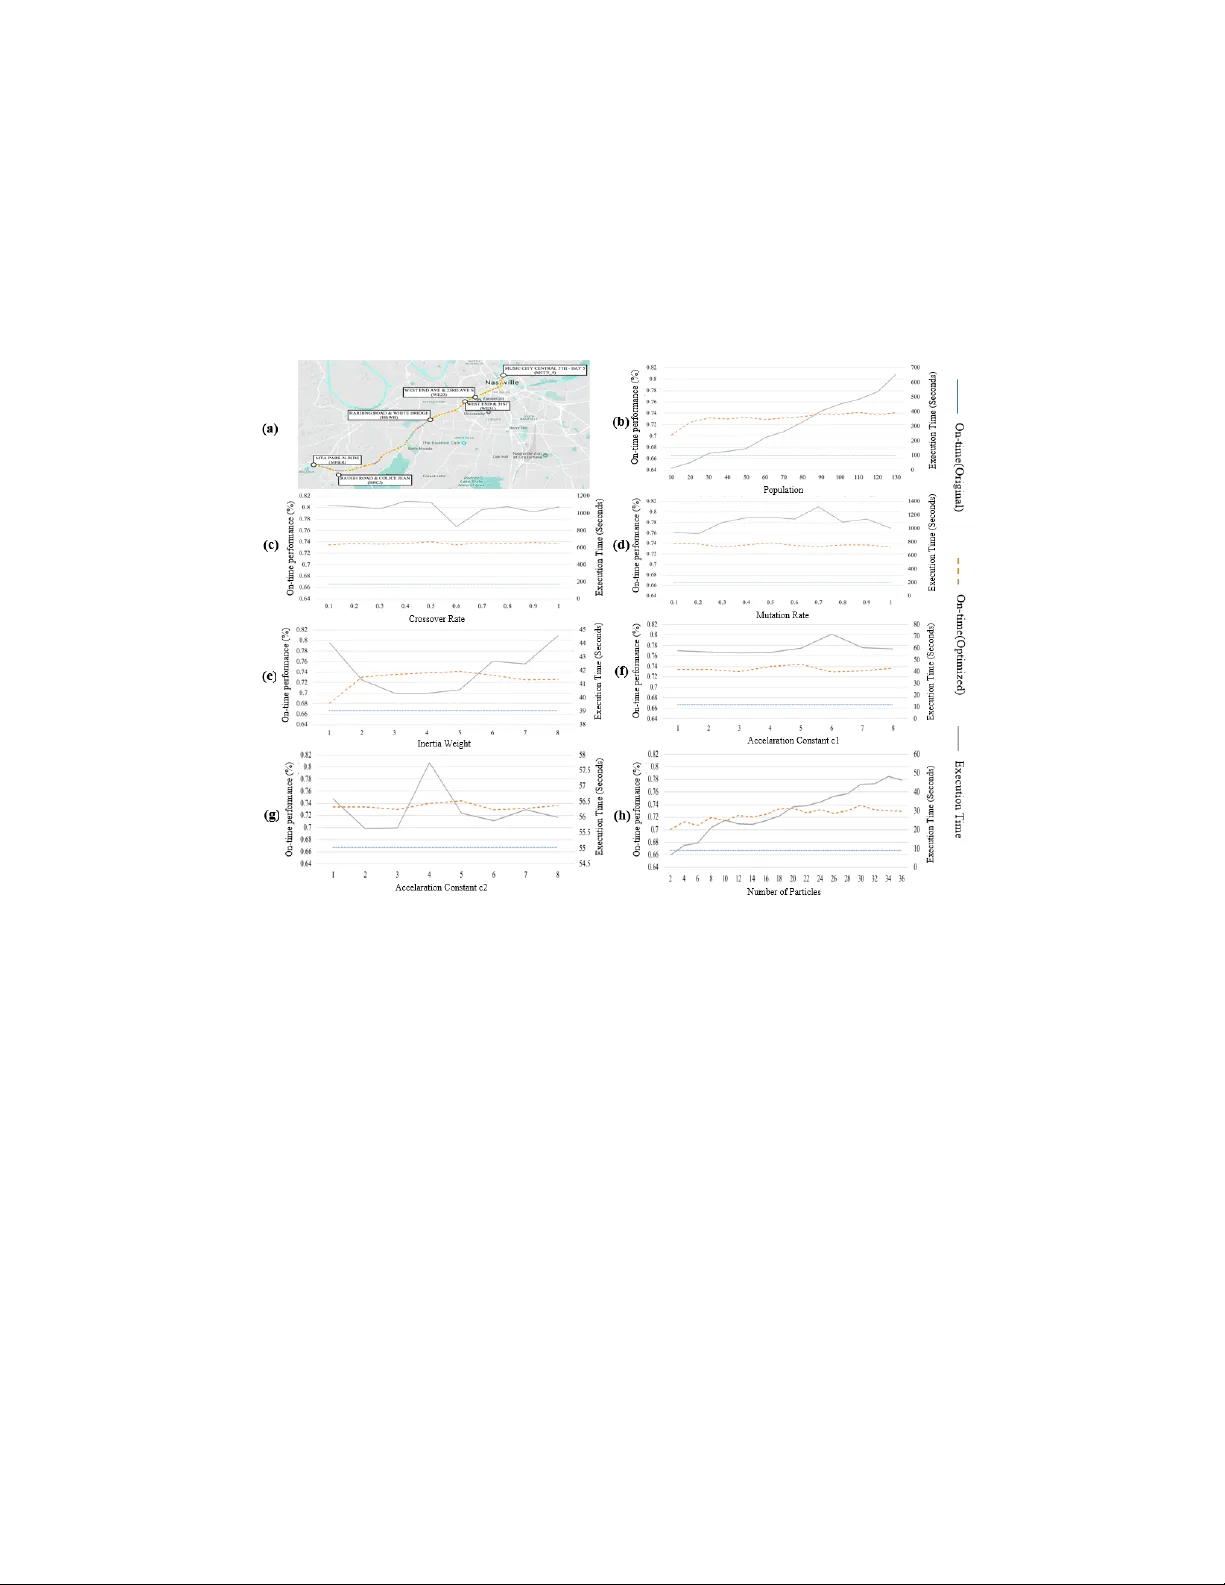
Comments & Academic Discussion
Loading comments...
Leave a Comment