Explanation vs Attention: A Two-Player Game to Obtain Attention for VQA
In this paper, we aim to obtain improved attention for a visual question answering (VQA) task. It is challenging to provide supervision for attention. An observation we make is that visual explanations as obtained through class activation mappings (s…
Authors: Badri N. Patro, Anupriy, Vinay P. Namboodiri
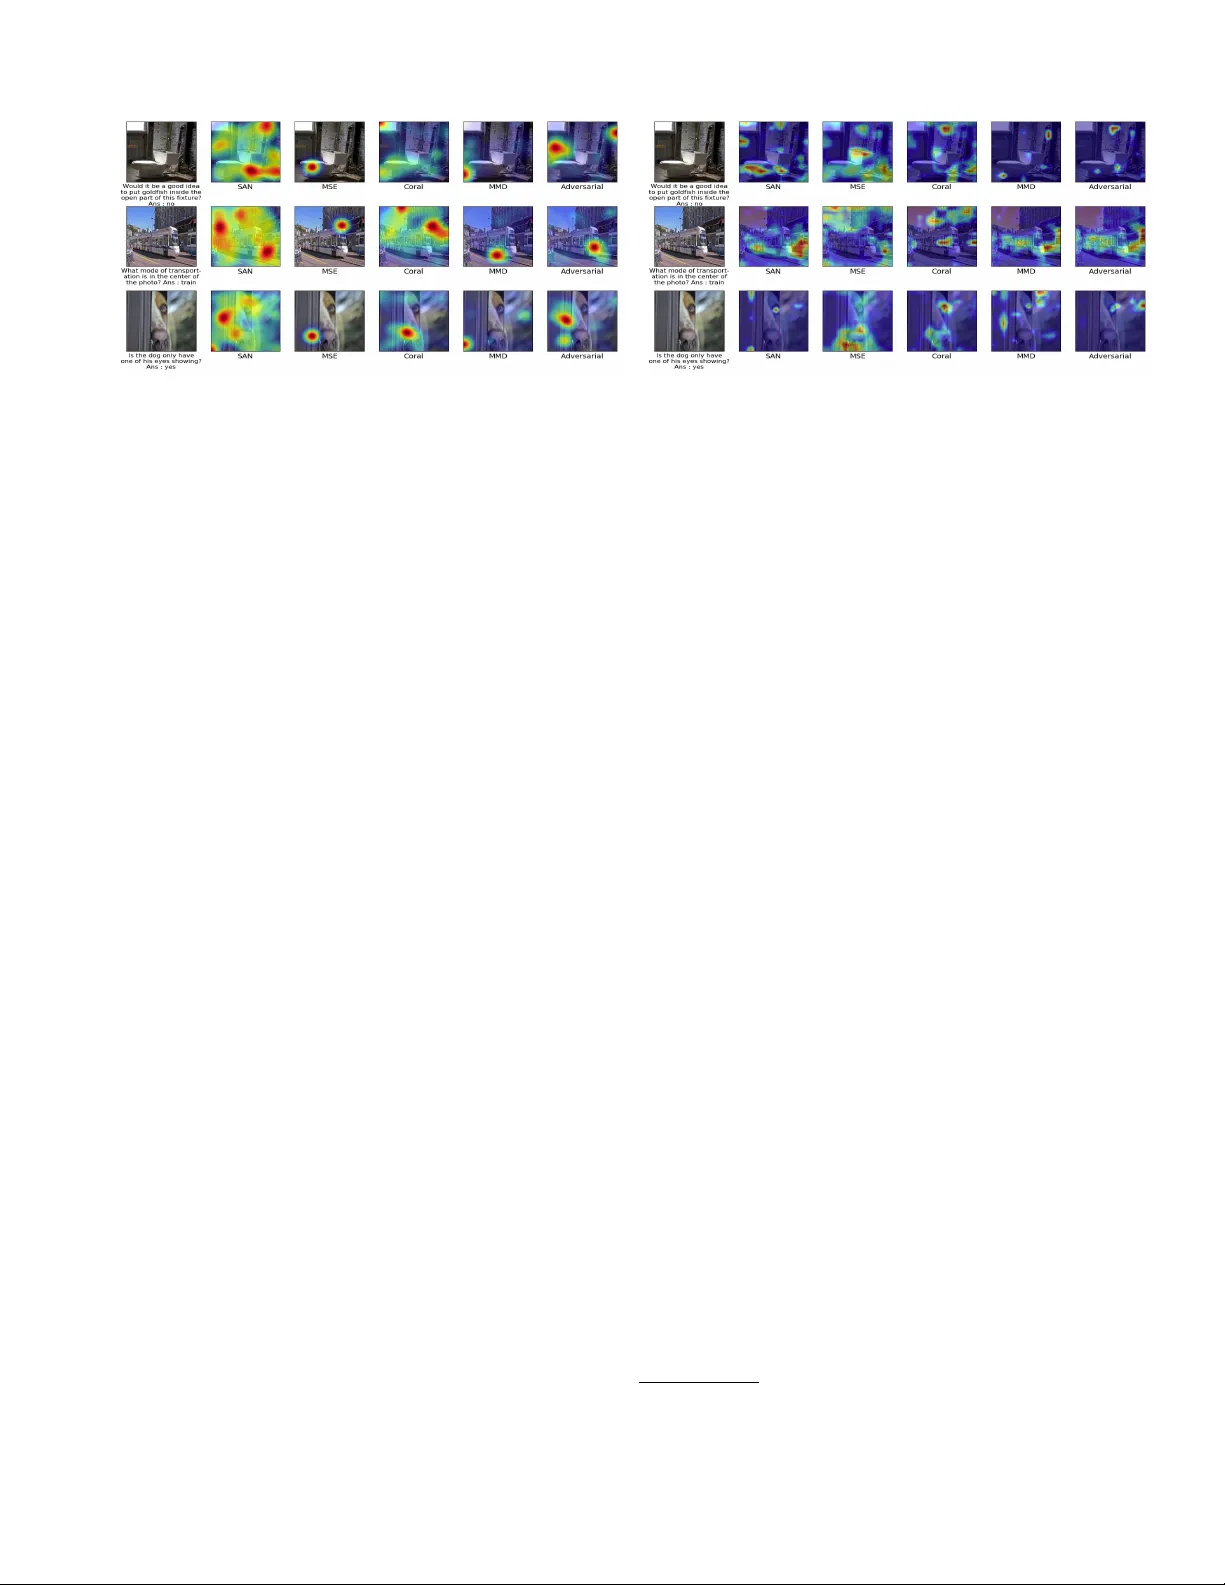
Explanation vs Attention: A T wo-Play er Game to Obtain Attention f or VQA Badri N. Patr o, Anupriy , V inay P . Namboodiri Indian Institute of T echnology , Kanpur { badri,anupriy ,vinaypn } @iitk.ac.in Abstract In this paper , we aim to obtain improv ed attention for a visual question answering (VQA) task. It is challenging to provide supervision for attention. An observation we make is that vi- sual explanations as obtained through class activ ation map- pings (specifically Grad-CAM) that are meant to e xplain the performance of v arious networks could form a means of su- pervision. Ho we ver , as the distributions of attention maps and that of Grad-CAMs dif fer , it would not be suitable to directly use these as a form of supervision. Rather, we propose the use of a discriminator that aims to distinguish samples of vi- sual explanation and attention maps. The use of adversarial training of the attention regions as a two-player game be- tween attention and explanation serves to bring the distribu- tions of attention maps and visual explanations closer . Signifi- cantly , we observe that pro viding such a means of supervision also results in attention maps that are more closely related to human attention resulting in a substantial impro vement o ver baseline stacked attention network (SAN) models. It also re- sults in a good improv ement in rank correlation metric on the VQA task. This method can also be combined with recent MCB based methods and results in consistent impro vement. W e also provide comparisons with other means for learning distributions such as based on Correlation Alignment (Coral), Maximum Mean Discrepancy (MMD) and Mean Square Er- ror (MSE) losses and observe that the adversarial loss out- performs the other forms of learning the attention maps. V i- sualization of the results also confirms our hypothesis that attention maps improv e using this form of supervision. 1 Introduction When asked a question based on an image, a human in v ari- ably focuses on the part of the image that aids in answer- ing the question. This is a commonly known fact in cog- nitiv e science. An extreme example that depicts perceptual blindness was demonstrated by (Simons and Chabris, 1999), where two groups of participants are passing balls. When asked to count the balls, vie wers ignore a gorilla in the video as it is not pertinent to the task of counting. Ho wev er , the deep netw orks that solve semantic tasks such as visual ques- tion answering do not hav e such attentive mechanisms. The fact that the existing deep networks do not attend to the areas Copyright c 2020, Association for the Advancement of Artificial Intelligence (www .aaai.org). All rights reserved. that humans do w as shown by the work of (Das et al., 2016). While there hav e been some works that aim to improve the attended regions, it is challenging as obtaining supervision for attention is tedious and may not always be possible for all the semantic tasks that we would like to use deep net- works. In this paper, we propose a simple method to obtain self-supervision to guide attention. The main idea is that giv en the task of solving visual ques- tion answering (VQA), there exist methods based on obtain- ing visual e xplanations such as Grad-CAM (Selvaraju et al., 2017) that obtain class activ ation mappings from gradients that allow us to understand the areas that a network focuses while solving the task for the correct class label. As dur- ing training, class labels are av ailable for the VQA task; it is easy to obtain such supervision. Using this, it is possi- ble to obtain surrogate supervision for supervising attention. One can obtain the visual explanation using the ground-truth label for a deep network that solves the visual question an- swering task. As the network is pro vided the actual label, the corresponding activ ation maps do aid in solving the task. Therefore, we hypothesize that this supervision can aid in obtaining better attention maps, and this is evident from the results that we obtain. The next challenge is to consider how the surrogate su- pervision obtained from Grad-CAM can be used to obtain better attention regions. Directly using these as supervision is not optimal as the distributions for the visual explanation differs from that of the attention maps as the attention maps are also supervised by the task loss. W e sho w that just using the mean-square error loss for the two maps is sub-optimal. In this paper , we show that a very simple way of using a two-player game between a discriminator that tries to dis- criminate between Grad-CAM results & attention maps and a generator that generates attention maps serves to provide substantially improved attention maps. W e show that this method performs much better and also provides state of the art results in terms of attention maps that correlates well with human attention maps. T o summarize, through this paper , we provide the follo wing contrib utions : • W e propose a means for obtaining surrogate supervision for obtaining better attention maps based on the visual ex- planation in the form of Grad-CAM results. This method performs better as compared to other forms of surrogate supervision such as using RISE (Petsiuk et al., 2018). • W e show that this surrogate supervision can be best used through a variant of adversarial learning to obtain atten- tion maps that correlate well with the visual explanation. Further , we observe that this performs better as against other means of supervision, such as MMD (Tzeng et al., 2014) or Coral (Sun and Saenko, 2016) losses. • W e provide various comparisons and results to show that we obtain better attention maps that correlate well with human attention maps and outperform other techniques for VQA. Further , we sho w that obtaining better attention maps also aids in obtaining better accuracies while solv- ing for VQA. A detailed empirical analysis for the same is provided. 1.1 Motivation In VQA, gi ven an image & a query , the attention model aims to learn the regions in an image pertinent to the answer . (Das et al., 2016) has proposed Human Attention (HA T) dataset for VQA task where human annotators have annotated the regions attended in the image to mark the answer based on the question. The regions pointed by humans for answering the visual question are more accurate as compared to those obtained by other techniques. This can be concluded through an experiment on HA T dataset where we replace human at- tention with attention obtained using stacked attention net- work with one stack. W e observe that the prediction accu- racy increases with ground truth human attention map for the stacked attention network (Y ang et al., 2016). W e be- liev e that human attention cannot be directly used as super- vision, as there are not enough e xamples of human attention (58K/215K). Further , such a method would not generalize well to no vel tasks. Ho wever , we are motiv ated by this result and have therefore de v eloped in this paper a self-supervision based method to improv e attention. W e formulate a game between Attention vs. Explanation using adversarial mech- anism. Through this game, we observe that we obtain im- prov ed attention regions, which lead to improv ed prediction and therefore, also results in better regions obtained through visual explanation as shown in the figure- 3. Thus, improv- ing attention using Grad-CAM results in an impro vement in Grad-CAM too. T o ensure whether our approach is prudent, we ev aluate whether using grad-CAM as self-supervision is beneficial. W e do this by an experiment that replaces atten- tion mask with Grad-CAM mask, and we observed that the classification accuracy of the VQA (SAN) model increases by 4% on the v alidation set. This pro vides a strong intuition to consider using Grad-CAM as self-supervision for the at- tention module. 2 Related work V isual question answering (VQA) was first proposed by (Malinowski and Fritz, 2014). Subsequently , (Geman et al., 2015) proposed a ”V isual T uring test” where a binary ques- tion is generated from a given test image. This is in contrast to modern approaches in which the model is trying to an- swer free-form open-ended questions. A seminal contribu- tion here has been standardizing the dataset used for V isual Question Answering (Antol et al., 2015). The methods for VQA can be categorized into joint embedding approaches and attention based approaches. Joint embedding based ap- proaches have been proposed by (Antol et al., 2015; Ren et al., 2015; Goyal et al., 2017; Noh et al., 2016) where vi- sual features are combined with question features to predict the answer . Attention based approaches are the other cate- gory of methods for solving VQA. It comprises of image based, question based and some that are both image and question based attention. (Shih et al., 2016) has proposed an image based attention approach, the aim is to use the ques- tion in order to focus attention ov er specific regions in an image. (Y ang et al., 2016) has proposed a method to repeat- edly obtain attention by using stacked attention over an im- age based on the question. Our work uses this as one of the baselines. (Li and Jia, 2016) has proposed a region based attention model over images. Similarly , (Zhu et al., 2016; Xu and Saenko, 2016; Bao et al., 2018) have proposed in- teresting method for question based attention. A work that explores joint image and question includes that is based on hierarchical co-attention is (Lu et al., 2016). There has been interesting work by (Fukui et al., 2016; Kim et al., 2017, 2018; Patro et al., 2018) that advocates multimodal pooling and obtains close to state of the art results in VQA. The task of VQA is well studied in the vision and lan- guage community , b ut it has been relati v ely less explored for providing explanation (Selvaraju et al., 2017; Goyal et al., 2017) for answer prediction. W e start with image caption- ing (Socher et al., 2014; V inyals et al., 2015; Karpathy and Fei-Fei, 2015; Xu et al., 2015; Fang et al., 2015; Chen and Lawrence Zitnick, 2015; Johnson et al., 2016; Y an et al., 2016) to provide a basic explanation for an image. The next lev el of challenging task is to provide an explanation for the visual question answering system. The attention-based model provides some short of basic explanation for VQA. This is observed that models (Das et al., 2016) are not look- ing at the same regions as humans are looking. So we need to improv ed model attention and as well as an explanation for our answer prediction. Recently , Uncertainty based ex- planation method (Patro et al., 2019) is proposed to impro ve the attention mask for VQA. (Jain and W allace, 2019) has proposed a method to ev aluate how attention weights can provide a correct explanation in language prediction task. There are very interesting methods to provide visual expla- nations such as Grad-CAM (Selvaraju et al., 2017), RISE (Petsiuk et al., 2018), U-CAM (Patro et al., 2019). In con- trast to the above-mentioned approaches, we focus on im- proving image-based attention using an adversarial game be- tween Grad-CAM and attention mask and show that it cor- relates better with human attention. Our approach allows the use of visual explanation as a means for obtaining surrog ate supervision for attention. 3 Method The main focus in our approach for solving visual question answering (VQA) is to use supervision obtained from vi- sual e xplanation methods such as Grad-CAM to improve at- tention. As mentioned earlier , using Grad-CAM as attention What mode of transportation is in the center of the photo? Loss Query Question Input Image Predicted Actual Attention Network Gradient Output LSTM LSTM LSTM What mode photo GradCam 1 1 9 6 0/1 ∈ 1 9 6 × 5 1 2 ∈ 1 9 6 × 5 1 2 Classifier Adversarial Loss Discriminator CNN Figure 1: Illustration of model P AAN and its attention mask. Image feature and question feature are obtained using CNN and LSTM respec- tiv ely . Attention mask is then obtained using these features and classification of the answer is done based on the attended feature. W e have improv ed the attention mask with the visual explanation approaches based on Grad-CAM shows improved performance in comparison to just using at- tention alone. Therefore, we believ e that Grad-CAM, or any other visual explanation method can be used in this setting. Further , by learning both the visual explanation and attention jointly in an adversarial setting, we observe improv ements in both as shown empirically . The ke y dif ferences in our architecture as compared to an existing VQA architecture is the use of visual explanation and attention blocks in an adversarial setting. This is illus- trated in figure 1. The other aspects of VQA are retained as is. In particular, we adopt a classification based approach for solving VQA where an image embedding is combined with the ques tion embedding to solve for the answer . This is done using a softmax function in a multiple choice setting: ˆ A = ar g max A ∈ Ω P ( A | I , Q, θ ) , where Ω is a set of all possible answers, and θ represents the parameters in the network. 3.1 Our A pproach The three main components of our approach, as illustrated in figure 1 are 1) Attention representation, 2)Explanation rep- resentation, 3) Adversarial Game. The details of our method are provided in the follo wing sub-sections: Attention Representation Initially , we obtain an embed- ding g i for an image X i using a conv olution neural net- work (CNN). Similarly , we obtain a question feature embed- ding g q for the query question X Q using an LSTM network. These are input to an attention network that combines the image and question embeddings using a weighted softmax function and produces a weighted output attention v ector g f . There are various ways of modeling the attention network. In this paper , we have ev aluated the network proposed in SAN (Y ang et al., 2016) and MCB (Fukui et al., 2016). Explanation Representation One of the ways for under- standing a result obtained by a deep network is to use visual- ization strategies. One such strategy that has gained accep- tance in the community is based on Grad-CAM (Selv araju et al., 2017). Grad-CAM uses the gradient information of the last con v olutional layer to visualize the contribution of each pixel in predicting the results. Note that Grad-CAM uses ground-truth class information and finds the gradient of the score for a class c in a con volution layer . It averages the gradient values to find the av eraged µ values for each of the channels of the layer . W e follow this approach, and further details are provided in (Selvaraju et al., 2017). W e hav e also ev aluated with another such approach termed as RISE (Petsiuk et al., 2018). W e observ ed better results using Grad-CAM. Adversarial Game A zero-sum adversarial game between two players (P1, P2) is used with one set of players being a Generator network and the other being a discriminator net- work. The y choose a decision from their respecti ve decision sets K 1 and K 2 . In our case, the attention network is the generator network, and the ‘real’ distribution is the output of Grad-CAM network. W e term the resultant network as ‘ Adversarial Attention Network’ (AAN). A game objectiv e L ( G, D ) : K 1 × K 2 ∈ R , sets the utilities of the players. Concretely , by choosing a proper strategy ( G, D ) ∈ K 1 × K 2 the utility of P1 is −L ( G, D ) , while the utility of P2 is L ( G, D ) . The goal of either P1/P2 is to maximize their worst case utilities; thus, min G ∈K 1 max D ∈K 2 L ( G, D ) (Goal of P1) , max D ∈K 2 min G ∈K 1 L ( G, D ) (Goal of P2) (1) The above formulation raises the question of whether there exists a solution ( G ∗ , D ∗ ) to which both players may jointly con v erge. The solution to this question is to obtain a Nash equilibrium where the Discriminator is unable to distinguish the generations of the Generator network from the ‘real’ dis- tribution i.e . [max D ∈K 2 L ( G ∗ , D ) = min G ∈K 1 L ( G, D ∗ )] . Since pure equilibrium does not always exist Nash et al. (1950), there e xists an approximate solution for this issue as a Mixed Nash Equilibrium,i.e. max D ∈K 2 E G ∼ D 1 L ( G, D ) = min G ∈K 1 E D ∼ D 2 L ( G, D ) (2) Where D 1 is the distribution ov er K 1 , and D 2 is the distribu- tion over K 2 . In zero-sum adversarial game, the sum of the generators loss and the discriminators loss is always zero, i.e. the generators loss is: L G = −L D . The solution for a zero-sum game is called a minimax solution, where the goal is to minimize the maximum loss. W e can summarize the entire game by stating that the loss function is L G (which is the discriminators payoff), so that the minimax objecti ve is min G max D L 1 ( G, D ) = E g g i ∼ G g ( x i ) [log D ( g g i /x i )]+ E g f i ∼ G f ( x i ) [log(1 − D ( G ( g f i /x i )))] For simplicity , we remov e subscript i . Here g g is the out- put of Grad-cam network G g for a sample, x i and g f is the output of the attention network. The discriminator wants to maximize the objective (i.e., its payoff) such that D ( g g /x ) is close to 1 and D ( G ( g f /x )) is close to zero. The generator wants to minimize the objective (i.e., its loss) so that D(G(z)) is close to 1. Specifically , the discriminator is a set of CNN layers followed by a linear layer that uses a binary cross en- tropy loss function. In case we have access to ground-truth attention obtained from humans, we can directly use this in our frame work. Here, we assume that we do not have access to such ground-truth as it is challenging to obtain this and is being used only for ev aluation. The final cost function for the network combines the loss obtained through an adversarial loss for the attention net- work along with the cross-entropy loss while solving for VQA. The final cost function used for obtaining the param- eters θ f of the attention network, θ y of the classification net- work, and θ d for the discriminator is as follows: C ( θ f , θ y , θ d ) = 1 n n X j =1 ( L j c ( θ f , θ y ) + η L j ( θ f , θ d )) (3) Where n is the number of examples, and η = 10 is the hyper- parameter , fine-tuned using v alidation set and L c is standard cross entropy loss. W e train the model with this cost function till it con v erges so that the parameters ( ˆ θ f , ˆ θ y , ˆ θ d ) deliv er a saddle point function. ( ˆ θ f , ˆ θ y ) = arg max θ f ,θ y ( C ( θ f , θ y , ˆ θ d )) ( ˆ θ d ) = arg min θ d ( C ( ˆ θ f , ˆ θ y , θ d )) (4) Pixel-wise Adversarial Attention Network (P AAN) : A variation of the adversarial attention network is to obtain a local pixel-wise discriminator for obtaining an improv ed at- tention network. The idea of pixel-wise discriminators has been studied for generati v e adversarial networks (GANs) and is termed patch-GAN. W e show here, that doing pixel- wise (with multiple channels per pixel) attention network results in an improved attention network. W e term this net- work a Pixel-wise Adversarial Attention Network (P AAN). Though this network uses more local discrimination, it does not increase the parameters of the network as compared to AAN. The ef fect of local discrimination results in impro ved attention as well as explanation. The algorithm for training the same is provided in Algorithm 1. The result ant min-max loss function is obtained as follows: min G max D k L k 1 ( G, D k ) = E g g i ∼ G g ( x i ) [log D k ( g g i /x i )]+ E g f i ∼ G f ( x i ) [log(1 − D k ( G ( g g i /x i )))] Finally , the actual cost function for training the pix el-wise discriminator , attention network and Grad-CAM is gi v en by: C ( θ f , θ y , θ k d | K k =1 ) = 1 n n X j =1 L j c ( θ f , θ y ) + η K X k =1 L j,k ( θ f , θ k d ) The main problem we face is the model conv er gence issue where the model parameter oscillates and does not con ver ge using gradient descent in a minimax game. T o handle con- ver gence issue, we add JS-di ver gence Fuglede and T opsoe (2004) to the cost function, which penalizes a poor gener- ated mask badly as compared to a good one, which is dif fer - ent from KL-diver gence (Kullback and Leibler, 1951). The second issue faced is “v anishing gradient”, when discrimina- tor is successful (which can well distinguish between gener- ated and discriminator sample), then the generator gradient vanishes and learns nothing. T o handle this issue, we add Pearson- χ 2 div er gence (Mao et al., 2017) to the GAN cost function. Algorithm 1 T raining P AAN Input: Image X I , Question X Q Output: Answer X A repeat Attention features G f ( G i ( X I ) , G q ( X Q )) ← g a Classification score G y ( g a ) ← ˆ y Answer cross entropy L y ← loss ( ˆ y, y ) Compute Gradient, L f = ∂ L y ∂ θ y , L i = ∂ L f ∂ θ f update θ c ← θ c - ∂ L c ∂ θ c Explanation features f t ( θ f , X t ) ← X t repeat Sample fake mini batch(Attention): α 1 . . . α 196 Sample real mini batch(Gradient): µ 1 . . . µ 196 Discriminator: D r k ( µ k ) ← d r k , D f k ( α k ) ← d f k Update the discriminator by ascending its stochastic gradient ∇ θ d 1 m P m i =1 [log D ( µ k ) + log(1 − D ( α k ))] until k = 1 : K Sample fake mini batch(Attention): α 1 . . . α 196 Update the Generator by descending its stochastic gr adient: ∇ θ g 1 m P m i =1 log(1 − D ( α )) until Number of Iteration 3.2 V ariations of Proposed Method While we advocate the use of Adversarial explanation method for improving the attention mask, we also ev aluate sev eral other explanation methods for this architecture. Our intuition is that, if we learn an attention mask that minimizes the distance between attention probability distribution and the gradient class acti v ation map, then we are more easily able to train our VQA classifier module to provide correct answer . T o minimize these distances we have used various methods. Maximum Mean Discrepancy (MMD) Net : In this v ari- ant, we minimize this distance using MMD (Tzeng et al., Model RC( ↑ ) EMD( ↓ ) SAN (Das et al., 2016) 0.2432 0.4013 CoAtt-W (Lu et al., 2016) 0.246 – CoAtt-P (Lu et al., 2016) 0.256 – CoAtt-Q (Lu et al., 2016) 0.264 – MMD RISE 0.2591 0.3992 Coral RISE 0.2609 0.3978 MSE RISE 0.2622 0.3921 AAN RISE 0.2683 0.3900 P AAN RISE 0.2754 0.3894 MMD (ours) 0.2573 0.3895 Coral (ours) 0.2563 0.3851 MSE (ours) 0.2681 0.3814 AAN (ours) 0.2896 0.3721 P AAN (ours) 0.3071 0.3701 P AAN Ran 07 0.1213 0.6700 P AAN Ran 20 0.1746 0.5872 Human Das et al. (2016) 0.623 – T able 1: Attention mask comparison for SO T A & Ablation Methods Models All Y es/No Num Oth Baseline-A TT 56.7 78.9 35.2 36.4 MMD SAN RISE 56.9 79.1 35.8 38.1 Coral SAN RISE 57.4 79.8 36.0 39.6 MSE SAN RISE 58.2 80.1 36.4 40.2 AAN SAN RISE 59.3 80.4 36.9 42.5 P AAN SAN RISE 60.1 80.8 37.3 44.2 MMD SAN GCAM 58.9 80.3 37.0 43.7 Coral SAN GCAM 59.4 80.8 36.5 45.1 MSE SAN GCAM 60.8 80.0 36.8 47.1 AAN SAN GCAM 62.3 80.4 37.2 49.8 P AAN SAN GCAM 63.6 81.1 36.9 50.9 AAN MCB GCAM 66.4 84.6 37.8 54.7 P AAN MCB GCAM 67.1 85.0 38.4 55.9 P AAN SAN Ran 07 55.2 77.2 35.1 36.2 P AAN SAN Ran 20 57.3 78.7 35.6 39.7 T able 2: Ablation analysis for Open-Ended VQA1.0 accuracy on test-de v 2014) based standard distribution distance metric. W e hav e computed this distance with respect to a representation ψ ( . ) . In our case, we obtain representation feature ψ ( α ) for atten- tion & ψ ( µ ) for Grad-CAM map. CORAL Net : In this variant, we minimize distance be- tween second-order statistics (co-variances) of attention and Grad-CAM mask using CORAL loss (Sun and Saenko, 2016) based standard distribution distance metric. Here, both ( µ ) and ( α ) are the d-dimensional deep layer activ a- tion feature for attention and Grad-CAM maps. W e have computed feature co-variance matrix of attention feature and Grad-cam feature represented by C ( α ) and C ( µ ) respec- tiv ely . W e trained our v ariants MMD and CORAL directly with- out adversarial loss to bring Grad-CAM based pseudo dis- tribution close to attention distribution. Finally we replace MMD and CORAL with adversarial loss. 4 Experiment W e e v aluate the proposed method i.e. P AAN in a number of ways which includes both quantitativ e analysis and qualita- tiv e analysis. Quantitati ve analysis includes ablation analy- sis with other variants that we tried using metrics such as Rank correlation (RC) score (Das et al., 2016), Earth Mover Distance (EMD) (Arjovsky et al., 2017), and VQA accurac y etc. as sho wn in table 1 and 2 respectable. W e also compare our proposed method with v arious state of the art models, as provided in table 3 and 4. Qualitative analysis includes vi- sualization of improv ement in attention maps for some im- ages as we move from our base model to the P AAN model. W e also provide visualization of Grad-CAM maps for all the models. 4.1 Ablation analysis on model parameter W e provide comparisons of our proposed model P AAN and other variants along with base model using various metrics in the table 1 and table 2. Rank correlation and EMD score are calculated for each model against human attention map (Das et al., 2016). Each model’ s generated attention map is used for this purpose. The rank correlation has an increas- ing trend. Increase in rank correlation indicates the depen- dency of the attention maps that are compared. As rank cor - relation increases, attention map generated from the model and human attention map becomes more dependent. In other words, higher rank correlation sho ws similarity between the maps. EMD also improves for P AAN. T o verify our intu- ition, that we can learn better attention mask by minimising the distance between attention mask and explanation mask, we start with MMD and observe that both rank correlation and answer accuracy increase by 1.42 and 1.2 % from base- line respectiv ely . Also, we observe that with CORAL and MSE based distance minimisation technique, both RC and EMD improves as shown in the table- 1. Instead of the pre- defined distance minimisation technique, we adapt an ad- versarial learning method. The proposed AAN method im- prov es attention globally with respect to Grad-CAM. AAN improv es 3.9% in-terms of RC and 9.5% on VQA accuracy . Finally ,our proposed P AAN, which considers local pixel- wise discriminator impro ves 6.4% in RC and 10.4% in VQA accuracy as mentioned in the table 1 and table 2. Since, hu- man attention map (Das et al., 2016) is only available for VQA-v1 dataset, for VQA accurac y we perform ablation for VQA-v1 only . Howe v er , we provide state of the art results for both datasets (VQA-v1 and VQA-v2). 4.2 Ablation on Explanation: Why do we select Grad-CAM? While calculating Grad-CAM one uses the “true class la- bels in obtaining activ ation maps. When observing attention, one just infers these for a sample without using the ground- truth label. At test time, Grad-CAM results cannot be used as true class labels would not be av ailable. By using Grad- CAM as supervision, the aim is to obtain dense supervision for the attention module that will guide the attention meth- ods as against the sparse rewards that are available based on the correct classification prediction. T o validate this we conduct an experiment with another kind of visual expla- nation, i.e., RISE (Petsiuk et al., 2018) in a similar way to Grad-CAM(Selvaraju et al., 2017). In RISE, we use the true Models All Y/N Num Oth Baseline-A TT 56.7 78.9 35.2 36.4 DPPnet (Noh et al., 2016) 57.2 80.7 37.2 41.7 SMem (Xu and Saenko) 58.0 80.9 37.3 43.1 SAN (Y ang et al., 2016) 58.7 79.3 36.6 46.1 DMN (Xiong et al., 2016) 60.3 80.5 36.8 48.3 QR U(2) (Li and Jia, 2016) 60.7 82.3 37.0 47.7 HieCoAtt (Lu et al., 2016) 61.8 79.7 38.9 51.7 MCB (Fukui et al., 2016) 64.2 82.2 37.7 54.8 MLB (Kim et al., 2017) 65.0 84.0 37.9 54.7 D VQA (P atro et al., 2018) 65.4 83.8 38.1 55.2 AAN + SAN (ours) 62.3 80.4 37.2 49.8 P AAN + SAN(ours) 63.6 81.1 36.9 50.9 AAN + MCB (ours) 66.4 84.6 37.8 54.7 P AAN + MCB (ours) 67.1 85.0 38.4 55.9 T able 3: SO T A: Open-Ended VQA1.0 accuracy on test Models All Y/N Num Oth SAN-2 (Y ang et al., 2016) 54.9 74.1 35.5 44.5 MCB (Fukui et al., 2016) 64.0 78.8 38.3 53.3 D VQA (P atro et al., 2018) 65.9 82.4 43.2 56.8 MUT AN (Ben et al., 2017) 66.0 82.8 44.5 56.5 MLB (Kim et al., 2017) 66.3 83.6 44.9 56.3 D A-NTN (Bai et al., 2018) 67.5 84.3 47.1 57.9 Counter (Zhang et al., 2018) 68.0 83.1 51.6 58.9 GCA (Patro et al., 2019) 69.2 85.4 50.1 59.4 B AN (Kim et al., 2018) 69.5 85.3 50.9 60.2 BU (Anderson et al., 2018) 70.34 86.6 48.64 61.15 AAN + SAN (ours) 60.1 76.4 35.2 51.8 P AAN + SAN (ours) 61.3 78.0 38.6 52.9 AAN + MCB (ours) 67.6 84.8 47.5 57.7 P AAN +MCB (ours) 68.4 85.1 48.4 59.1 T able 4: SO T A: Open-Ended VQA2.0 accuracy on test label t o obtain RISE based activ ation maps, instead of Grad- CAM, that corresponds to the true prediction. This, as surro- gate supervision, is observed by us to provide better results as compared to using only attention without supervision. W e ev aluate the rank correlation of the attention mask for RISE supervision and observe that it is much lower than Grad- CAM supervision, as shown in table-1. This method results in an improvement of 3.22% in terms of rank correlation ov er the baseline SAN (Das et al., 2016) method while we obtain an improv ement of 6.39% using Grad-CAM supervi- sion. Similarly , we observe that the Earth Mov er Distance of RISE based model is higher than the Grad-CAM based model. W e belie ve that the suggested framework can always be improv ed by any other surrogate supervision technique that can be dev eloped. Figure 2: V isualisation of attention map after epoch-10, epoch-50, epoch-100, epoch-200. 4.3 Why adversarial learning rather than supervised learning? Attention and Grad-CAM distributions differ as has been pointed out. Howe v er , the Grad-CAM results are based on the true labels. Therefore, if the distributions are close, then it would serve the purpose. This is because, the attention maps need not exactly correspond to the gradient of the class activ ations. By using adversarial learning and trying to fool the discriminator , we are able to serve our purpose. This is ensured also by providing comparisons against ex- plicitly using Grad-CAM as supervision with MSE loss re- sults in lower performance. Therefore, adversarial learning is a good method for solving this problem (better even than other distribution matching techniques such as MMD or CORAL). T o validate this, we conduct an experiment on distribution matching between the generated attention mask and the ground truth explanation mask. One of the sim- plest ways to measure the overlapping distributions is the W asserstein (Arjovsky and Bottou, 2017) distance between them. W e observe that for a perfect adversarial game, the model achie ves pure or Mixed Nash Equilibrium, the joint distribution between p (explanation) distribution and q (at- tention) distribution should be diagonal, that is p & q dis- tribution are highly overlapped. And the EMD should be very small. So, using Grad-CAM supervision for attention mask helps to achiev e more close tow ards Mixed Nash Equi- librium in two player game as compared to random and RISE based supervision. W e also observe that if the ov er- lapping region between p-distribution and q-distribution is very lo w , then KL-div ergence in our adversarial game com- pletely fails and JS-diver gence works well. In this experi- ment, we consider three types of explanations mask, Grad- CAM (Selvaraju et al., 2017), RISE (Petsiuk et al., 2018) and a random mask. W e start to observe that with a ran- dom explanation mask the accuracy is not improving; rather it is decreasing, when the o verlap of the distribution in- creases, the performance in terms of rank correlation and accuracy is also increasing. W e sho w the experiment result for P AAN S AN Ran 07 whose distribution overlapping is 7% and P AAN S AN Ran 20 distribution ov erlapping is 20% as shown in table-2 and second last ro w of table -1. W e conduct another type of experiment to analyze the contrib ution of the adversarial loss function used in equation- 3 & 3.1. In this experiment we vary the value of η in order of magnitude range from 0, 0.1, 0.01, 1, 10, and 100. W e observ e that for lo w v alue η , the gradient of the discriminator v anishes rapidly and generator learns nothing. For η = 10 , we get the best result in-terms of VQA accurac y result and rank correlation. As Grad-Cam and attention mask may not match at the beginning, it may create instability in the training. T o av oid this issue we have used pre-trained SAN and MCB model for warm-start model. W e then use an adversarial loss based on the attention and Grad-CAM. W e follow the same training procedure for SAN and MCB models. The figure- 2 shows attention mask entropy as epoch increases. Initially the en- tropy is too high and as time goes the entropy decreases. The entropy difference between epoch-10 and epoch-100 is too high as compared to epoch-100 & epoch 200. Figure 3: Examples with different approaches in each column for improving attention using explanation in a self supervised manner . The first column indicates the giv en target image and its question and answer . Starting from second column, it indicates the Attention map (left) / Grad-CAM map (right) for Stack Attention Network, MSE based approach, Coral based approach, MMD based approach, Adv ersarial based approach respectiv ely . 4.4 Comparison with baseline and state-of-the-art W e obtain the initial comparison with the baselines on the rank correlation on human attention (HA T) dataset (Das et al., 2016) that provides human attention while solving for VQA. Between humans the rank correlation is 62.3%. The comparison of various state-of-the-art methods and base- lines are provided in table 1. W e use variant of SANY ang et al. (2016) model as our baseline method. W e obtain an im- prov ement of around 3.7% using AAN network and 6.39% using P AAN network in terms of rank correlation with hu- man attention. W e also compare with the baselines on the answer accuracy on VQA-v1(Antol et al., 2015) and VQA- v2(Goyal et al., 2017) dataset as shown in table 3 and ta- ble 4 respectiv ely . W e obtain an improvement of around 5.8% over the comparable baseline. Further incorporating MCB improves the results for both AAN and P AAN result- ing in an improvement of 7.1% over dynamic memory net- work and 3% improvement over MCB method on VQA-v1 and 4.2% on VQA-v2. Howe v er , as noted by (Das et al., 2016), using a saliency based method (Judd et al., 2009) that is trained on eye tracking data to obtain a measure of where people look in a task independent manner results in more correlation with human attention (0.49). Howe ver , this is explicitly trained using human attention and is not task dependent. In our approach, we aim to obtain a method that can simulate human cogniti v e abilities for solving tasks. The method is not limited to classification alone though all the methods proposed for VQA-1 and VQA-2 datasets follow this. The proposed framework can easily be extended to gen- erativ e frameworks that generate answers in terms of sen- tences. W e use visual dialog task(Das et al., 2017) for gen- erativ e framew ork, where we visualised improved attention map with respect to generated answer . W e observ e impro ve- ment of ov erall performance in terms of NDGC values by 1.2% and MRR values by 0.78% over the baseline dialog model (Das et al., 2017). W e have provided more results of AAN and P AAN for VQA and V isual dialog, attention map visualization, dataset, and e v aluation methods in our project page- 1. 4.5 Qualitative Result W e provide attention map visualization for all models as shown in Figure 3. W e can vividly see how attention is im- proving as we go from our baseline model (SAN) to the pro- posed adversarial model (P AAN). For example, in the sec- ond row , SAN is not able to focus on any specific portion of the image but as we go towards right, it is able to fo- cus near the bus. Same can be seen for other images also. W e have also visualized Grad-CAM maps for the same im- ages to corroborate our hypothesis that Grad-CAM is a bet- ter way of visualization of network learning as it can focus on the right portions of the image e ven in our base line model (SAN). Therefore, it can be used as a tutor to improve at- tention maps. Our P AAN model helps to learn the attention distribution in an adversarial manner from Grad-CAM dis- tribution as compared to SAN and others. Also, Grad-CAM is simultaneously improved according to our assumption and can also be seen in the Figure 3. For example, in SAN the focus of Grad-CAM is spread over the image. In our pro- posed model, visualization is improved to focus only on the required portion. In the project website 1 , we show variance in attention map for the same question to the image and its composite image in VQA2.0 dataset. 5 Conclusion In this paper we have proposed a method to obtain surro- gate supervision for obtaining improved attention using vi- sual explanation. Specifically , we consider the use of Grad- CAM. Howev er , other such modules could also be consid- ered. W e show that the use of adversarial method to use the surrogate supervision performs best with the pixel-wise ad- versarial method (P AAN) performing better against other methods of using this supervision. The proposed method shows that the improved attention indeed results in improved results for the semantic task such as VQA or V isual dialog. Our method provides an initial means for obtaining surro- gate supervision for attention and in future we would like to further in vestig ate other means for obtaining improved at- tention. References Anderson, P ., He, X., Buehler, C., T eney , D., Johnson, M., Gould, S., and Zhang, L. (2018). Bottom-up and top-do wn attention for image captioning and visual question answering. In CVPR . 1 https://delta- lab- iitk.github .io/T woPlayer/ Antol, S., Agrawal, A., Lu, J., Mitchell, M., Batra, D., Zitnick, C. L., and Parikh, D. (2015). VQA: V isual Question Answer- ing. In ICCV . Arjovsk y , M. and Bottou, L. (2017). T o wards principled methods for training generativ e adversarial netw orks. stat , 1050:17. Arjovsk y , M., Chintala, S., and Bottou, L. (2017). W asserstein g an. stat , 1050:26. Bai, Y ., Fu, J., Zhao, T ., and Mei, T . (2018). Deep attention neural tensor network for visual question answering. In ECCV . Bao, Y ., Chang, S., Y u, M., and Barzilay , R. (2018). Deri ving ma- chine attention from human rationales. In EMNLP . Ben, younes, H., Cadene, R., Cord, M., and Thome, N. (2017). Mutan: Multimodal tucker fusion for visual question answering. In ICCV . Chen, X. and Lawrence Zitnick, C. (2015). Mind’ s eye: A recurrent visual representation for image caption generation. In CVPR . Das, A., Agrawal, H., Zitnick, C. L., Parikh, D., and Batra, D. (2016). Human Attention in V isual Question Answering: Do Humans and Deep Networks Look at the Same Regions? In EMNLP . Das, A., K ottur , S., Moura, J. M., Lee, S., and Batra, D. (2017). Learning cooperativ e visual dialog agents with deep reinforce- ment learning. In ICCV . Fang, H., Gupta, S., Iandola, F ., Sriv astav a, R., Deng, L., Doll ´ ar , P ., Gao, J., He, X., Mitchell, M., Platt, J., et al. (2015). From captions to visual concepts and back. In CVPR . Fuglede, B. and T opsoe, F . (2004). Jensen-shannon di v ergence and hilbert space embedding. In International Symposium onInfor- mation Theory , 2004. ISIT 2004. Pr oceedings. , page 31. IEEE. Fukui, A., Park, D. H., Y ang, D., Rohrbach, A., Darrell, T ., and Rohrbach, M. (2016). Multimodal compact bilinear pooling for visual question answering and visual grounding. In EMNLP . Geman, D., Geman, S., Hallonquist, N., and Y ounes, L. (2015). V i- sual turing test for computer vision systems. Pr oceedings of the National Academy of Sciences of the United States of America , 112(12):3618–3623. Goyal, Y ., Khot, T ., Summers-Stay , D., Batra, D., and Parikh, D. (2017). Making the v in vqa matter: Elev ating the role of image understanding in visual question answering. In CVPR . Jain, S. and W allace, B. C. (2019). Attention is not e xplanation. In NAA CL , pages 3543–3556. Johnson, J., Karpathy , A., and Fei-Fei, L. (2016). Densecap: Fully con v olutional localization networks for dense captioning. In CVPR , pages 4565–4574. Judd, T ., Ehinger , K., Durand, F ., and T orralba, A. (2009). Learning to predict where humans look. In ICCV , pages 2106–2113. Karpathy , A. and Fei-Fei, L. (2015). Deep visual-semantic align- ments for generating image descriptions. In CVPR , pages 3–7. Kim, J.-H., Jun, J., and Zhang, B.-T . (2018). Bilinear attention networks. In NIPS , pages 1571–1581. Kim, J.-H., On, K. W ., Lim, W ., Kim, J., Ha, J.-W ., and Zhang, B.- T . (2017). Hadamard Product for Lo w-rank Bilinear Pooling. In ICLR . Kullback, S. and Leibler, R. A. (1951). On information and suffi- ciency . The annals of mathematical statistics , 22(1):79–86. Li, R. and Jia, J. (2016). V isual question answering with question representation update (qru). In NIPS , pages 4655–4663. Lu, J., Y ang, J., Batra, D., and Parikh, D. (2016). Hierarchical question-image co-attention for visual question answering. In NIPS , pages 289–297. Malinowski, M. and Fritz, M. (2014). A multi-world approach to question answering about real-world scenes based on uncertain input. In NIPS . Mao, X., Li, Q., Xie, H., Lau, R. Y ., W ang, Z., and P aul Smolley , S. (2017). Least squares generativ e adversarial networks. In ICCV . Nash, J. F . et al. (1950). Equilibrium points in n-person games. Noh, H., Hongsuck Seo, P ., and Han, B. (2016). Image question answering using conv olutional neural network with dynamic pa- rameter prediction. In CVPR , pages 30–38. Patro, Badri, Namboodiri, and P , V . (2018). Dif ferential attention for visual question answering. In CVPR , pages 7680–7688. Patro, B. N., Lunayach, M., Patel, S., and Namboodiri, V . P . (2019). U-cam: V isual explanation using uncertainty based class acti v a- tion maps. In The IEEE International Confer ence on Computer V ision (ICCV) . Petsiuk, V ., Das, A., and Saenko, K. (2018). Rise: Randomized input sampling for explanation of black-box models. Ren, M., Kiros, R., and Zemel, R. (2015). Exploring models and data for image question answering. In NIPS , pages 2953–2961. Selvaraju, R. R., Cogswell, M., Das, A., V edantam, R., Parikh, D., and Batra, D. (2017). Grad-cam: V isual e xplanations from deep networks via gradient-based localization. In ICCV . Shih, K. J., Singh, S., and Hoiem, D. (2016). Where to look: F ocus regions for visual question answering. In CVPR . Simons, D. J. and Chabris, C. F . (1999). Gorillas in our midst: Sus- tained inattentional blindness for dynamic ev ents. per ception , 28(9):1059–1074. Socher , R., Karpathy , A., Le, Q. V ., Manning, C. D., and Ng, A. Y . (2014). Grounded compositional semantics for finding and de- scribing images with sentences. TA CL , 2(1):207–218. Sun, B. and Saenko, K. (2016). Deep coral: Correlation alignment for deep domain adaptation. In ECCV , pages 443–450. Springer . Tzeng, E., Hoffman, J., Zhang, N., Saenko, K., and Darrell, T . (2014). Deep domain confusion: Maximizing for domain in- variance. arXiv pr eprint arXiv:1412.3474 . V inyals, O., T oshev , A., Bengio, S., and Erhan, D. (2015). Show and tell: A neural image caption generator . In CVPR . Xiong, C., Merity , S., and Socher, R. (2016). Dynamic memory networks for visual and textual question answering. In ICML . Xu, H. and Saenko, K. (2016). Ask, attend and answer: Exploring question-guided spatial attention for visual question answering. In ECCV , pages 451–466. Springer . Xu, K., Ba, J., Kiros, R., Cho, K., Courville, A., Salakhudinov , R., Zemel, R., and Bengio, Y . (2015). Show , attend and tell: Neural image caption generation with visual attention. In ICML . Y an, X., Y ang, J., Sohn, K., and Lee, H. (2016). Attribute2image: Conditional image generation from visual attributes. In ECCV . Y ang, Z., He, X., Gao, J., Deng, L., and Smola, A. (2016). Stacked attention networks for image question answering. In CVPR . Zhang, Y ., Hare, J., and Pr ¨ ugel-Bennett, A. (2018). Learning to count objects in natural images for visual question answering. Zhu, Y ., Groth, O., Bernstein, M., and Fei-Fei, L. (2016). V isual7w: Grounded question answering in images. In CVPR .
Original Paper
Loading high-quality paper...
Comments & Academic Discussion
Loading comments...
Leave a Comment