Continuous Emotion Recognition during Music Listening Using EEG Signals: A Fuzzy Parallel Cascades Model
A controversial issue in artificial intelligence is human emotion recognition. This paper presents a fuzzy parallel cascades (FPC) model for predicting the continuous subjective appraisal of the emotional content of music by time-varying spectral con…
Authors: Fatemeh Hasanzadeh, Mohsen Annabestani, Sahar Moghimi
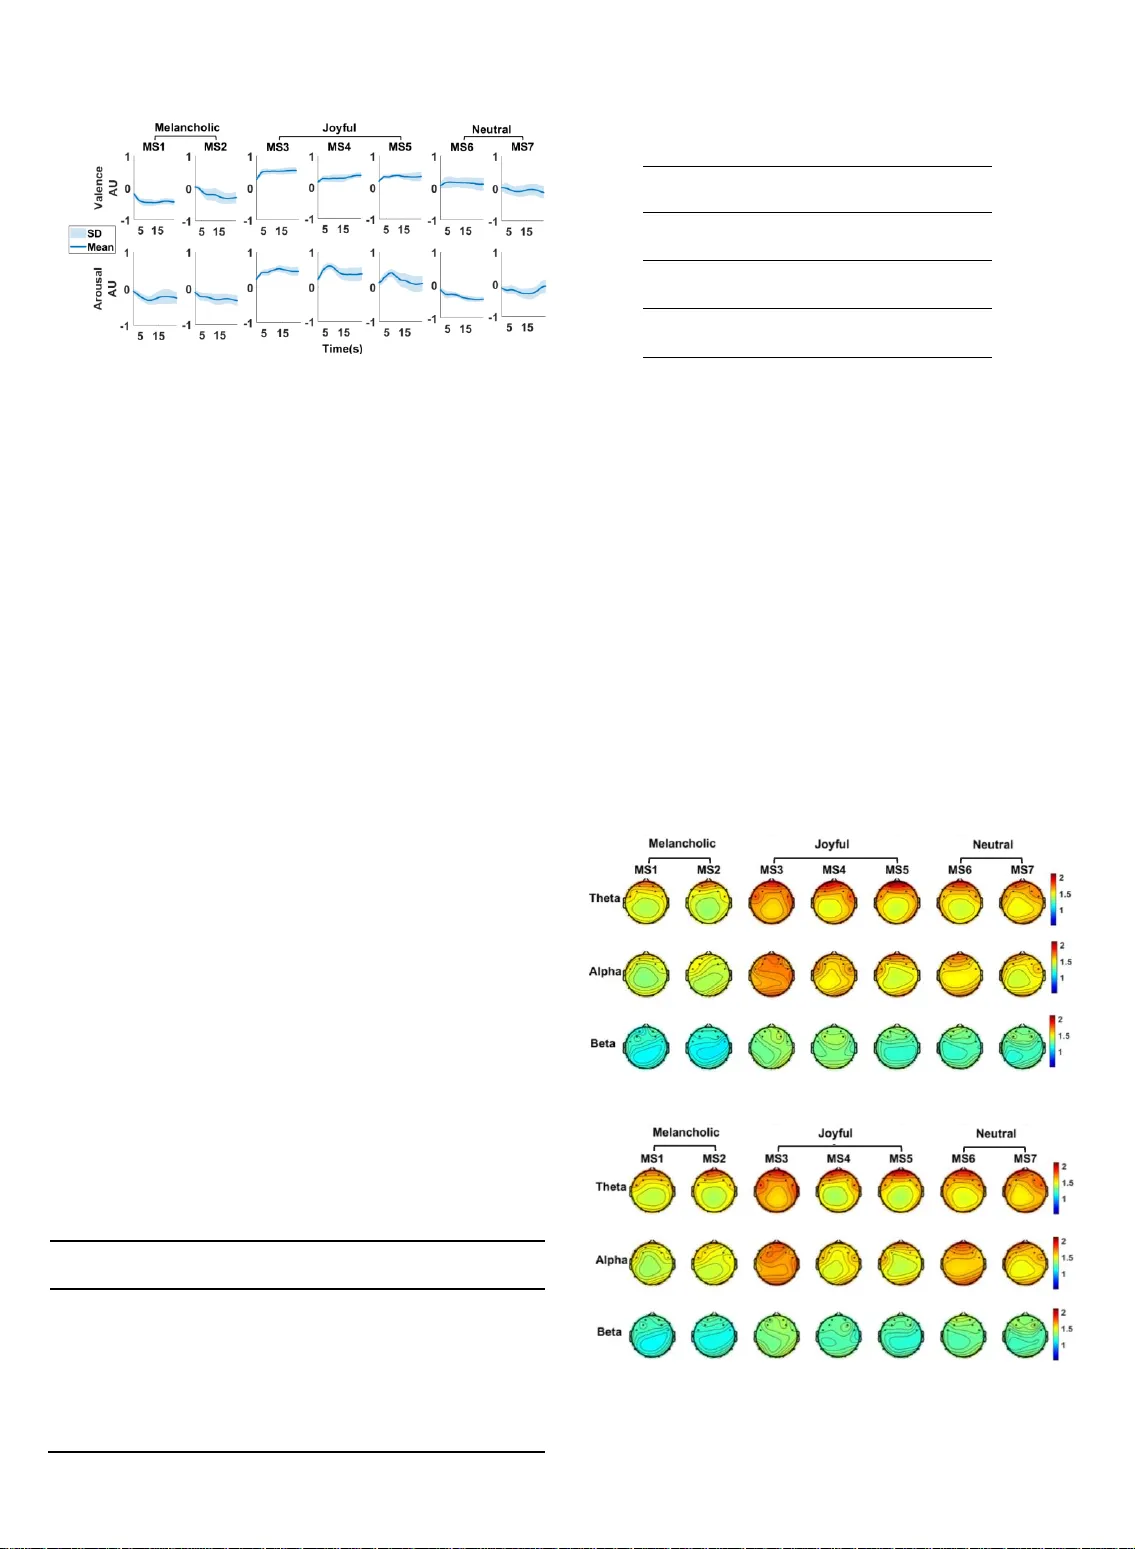
C o nt i n u ou s E m o t i o n R e c o g n it i on du r i n g M u s i c L i st e n i n g U s i n g E E G S i gn a ls : A F u zz y P a r a l l e l C as c ad e s M o d e l Fa t e m eh H as a n za d eh , Mo h s en Ann a b es t a n i, S a ha r Mo g h im i A bstract — A controversial issue in artificial intelligence is human e motion recogn ition. This pa per present s a fuzzy par allel cascades (FPC) model for predi cting the continuo us subjectiv e appra isal of the emotiona l content o f music by ti me -varying spectral content of EEG signal s. The EEG, along w ith an emotional appraisal of 15 subjects, was re corded during listening to seven musical ex cerpts. The emot ional appraise ment was recorde d along the valen ce and arou sal emotional ax es as a continuous signa l. The FPC model w as composed o f parallel ca scades with each cascade containin g a fuzzy log ic -based system. The FPC model performan ce was evaluated by comparing with linear reg ression (LR), suppor t vector re gression (SVR) and Long-Shor t-T erm-Me mory recurr ent neural netw ork (LSTM-RNN) models. The RM SE of the FPC was low er than other models for estimat ion of both vale nce and arousa l of all musi cal excerpts. The low est RMSE wa s 0.089 wh ich was obtained in estimation of valen ce of MS4 by FPC model . The ana lysis of MI of frontal EEG with the valen ce confirms the role of frontal channels in theta frequency band in emotion recognition . Considerin g the dyna mic variations of mus ical feature s during songs, employing modeling ap proach to predict dyna mic variations of the emotional app raisal can be a plausi ble substitute for classification of musical ex cerpts into pre defined labels. Index T erms — Continuou s emotion recog nition, EEG, fuzzy inference system, musical e motions, parallel cascade identification. —————————— —————————— 1 I NTRODUCTION motions play a fundamenta l role in human life. If the machine can recognize human emotions, they can work more efficiently beca use they will be more intelli- gent in dealing wit h human beings. Considering the im- portance of emotion recognition, this issue ha s drawn the attention of many researchers . To create machines tha t can recognize emotions, a grea t body of research has been dedicated to investigating the neural correlates of emo- tions. In these efforts, emotions have bee n elicited by dif- ferent pictorial [1], musical [2 - 4] and video [5 - 7] stimuli. Music listening comprises a va riety of psychological pro- cesses, e.g. perception and multimodal integration, atten- tion, syntactic processing and processing of meaning in- formation, emotion, and social cognition [8]. Music ca n create powerful emotions[9 ]. Emotional processing in- volves different structures of human brain a nd induces changes in their activ ity [8]. It a lso causes some othe r physiological responses wh ich are secondary effect of brain activity, e.g. change in hea rt rate [10], skin conduct- ance [11 ], and body temperature [11]. Different modalities including PET [12], fMRI [13], NI RS [14] and EEG [15 ] have been used by researchers to study neural correlates of emotions . High tempora l res olution, portability, and relatively low cost of data recording ha s made EEG a suitable candidate for investiga ting the neural correlates of various cognitive functions, including emotion. During the past two decades EEG p ower spectra in different fre- quency bands nam ely theta (4 – 8 Hz), alpha (8 – 13 Hz), beta (13 – 30 Hz) and gamma (30 – 49 Hz) have b een inves- tigated in many studies to identify changes due to emo- tional processing [10]. Balconi et al. used EEG frequency bands along with hemodynamic m easurements, to inves- tigate affective responses in t he brain [16]. Sammler et al. demonstrated that listening to pleasant m usic results in an increase in the theta power of EEG signals in t he frontal midline region [10]. H igher frontal midline theta band energy for liked music was a lso observ ed by Bal- asubramanian et a l. They have analyz ed EEG componen t energy obtained by wavele t packet decomposition while listening t o liked and dislike d mu sic [4]. Zheng used EEG spectral power as a feature for EEG cha nnel selection and emotion recognition through spar se canonical correlation analysis [17]. Ozel et al. applied multivariate syn- chrosqueezing t ransform to extract EEG features for cla s- sifying emotional states. They reported 93% cla ssification accuracy for one of the emotional sta tes [18] . Hasanzadeh et al. used nonlinear autoregressive exogenous model a nd genetic algorithm to predict emotional state during listen- ing to music by EEG powe r spectrum[19]. Some s tudies applied E EG band power alongside with facial ex pressions to compare their ability in emotion recognition [7, 20]. However Koelstra et al. reported more accurate emotion recognition by combination of EEG an d face modalities [20] but Soleymani et al. founded superior —————————— —————— Fatemeh Hasan zadeh is with the Departmen t of Electrical En gineering, K.N. Toosi Uni versity of Techn ology, Tehran , Iran . E -mail: f.hasanzadeh22@ yahoo.com. Mohsen Annabestani is w ith the Department of El ectrical Engineer ing, Sharif Universit y of Technolog y, Tehran, Iran . E -mail : annabestany@ gmail.com Sahar Mo ghimi is with the De partment of Elect rical Engineerin g, Ferdowsi University of Mas hhad and with Ray an Center for Neurosc ience and Be- havior, Ferdows i University o f Mashhad, Mas hhad, Iran . E -mail: s.moghimi@um.ac .ir. E results by only facial expressions [ 7] . In addition to the spectral power of EEG signals, connec- tivity indices ext racted from EEG networks during an emotional assessment of mu sical stimuli ha ve been stud- ied. Hasanzadeh et al. investigated connectivity of brain networks during listening to joyful, neutra l a nd mela n- cholic music using partial directed coherence . The results demonstrated that listening to joyful music increases in- tra-region effective connectivity in the frontal lobe [21] . Directed trans fer functio n was anothe r connectivit y measure tha t was employed to study the effect of listen- ing to emotional music on EEG network s [22]. Li et al. have analyzed EEG networks constructed by phase - locking v alue while watching music videos. They ha ve investigated power spectral features, features based on network topology and the ir combina tion for em otion classification [23]. In most of the studie s on e motion recognition, em otio ns have been described by a discrete emotion model includ - ing some specific adjectives or descriptors fo r ba sic emo- tions [1 - 3] . In these studies, emotion recognition was re- duced to a classification pro blem. K-nearest neighbor [1, 2, 1 8] , Support vector ma chine(SVM) [2, 3, 18, 23] , classifi- er ba sed on quadratic discriminant ana lysis(QDA) [1 ] , and neu ral net works (NN) [2, 3, 24] are some of the clas- sification techniques applied to date for the specific pur- pose of emotion classification. Choosing a limited set of emotion labels is not plausible for describing the emo- tional content of m usic sinc e the intended adjective may not exist in the emotion descriptor set defined by the ex- aminer [9]. The dimensional emotion model was em- ployed to solve this problem. This model consists of emo - tional dimensions tha t enco mpass va rious emotion s [9] . Russel proposed a two dimensions m odel for emotion - based on pleasure and activation which is referred to a s valence and arousal [25]. A different dimensional model with two separate a rousal dimension s namely energetic and tension a rousal has been proposed b y Thayer [26] . The dimensional model is not necessarily limited to two dimensions [9]. Some of t he studies whi ch applied di- mensional model discretized the continuous space of emotion [4, 20], however it is repo rted that music can in- duce more than one emotion and using a discrete label may not reflect the emotional richness of music [9]. There- fore, a time -varying measure can be beneficiary for a more realistic quan tification of emotional appraisal. Only a few studies applied continuous affect recognition which is done by using regression or neural network m odels. The models t hat a re mostly used are linear regression (LR) [5, 7, 27], support vec tor regression (SVR) [7, 28] , Long-Short-Term-Memory recurrent neural network (LSTM-RNN) [7, 28, 29]. Regress ion models are paramet- ric models which have some pitfalls such a s requiring prior knowle dge of t he system and low robustness t o noise [30]. Neural net works ha ve some defects, including massive computation, lack of interpretability for amend- ing a specific beha vior and difficulty in learning parame- ter setting [31 ]. In t he other hand fuzzy systems are capa- ble of describing system behav iors with simple condi- tional I F-THEN rules a nd are more interpretable systems [31]. Considering the advantages of fuzzy systems, it is applied in va rious applications such as image processing[32] , blind sour ce separation[33 ], descriptive educational eva luation[34], m odeling of smart materia l be hviour[35]. In the current study, we have proposed a model based o n fuzzy systems for continuous emotions recognition . W e are aimed to predict the time-varying em otions experi- enced b y individuals during listening to mu sic by EEG features. To investigate the dynamic nature of emotions a ti me -varying two-dimensiona l emotional rating paradigm was employed. Wavelet a nalysis was used to extract th e time-varying power spectrum of EEG signals in thet a, alpha, and beta frequency bands. To choo se EEG features that are highly related to e motion, mutua l infor mation (MI) was applied. Our proposed model whi ch is fuz zy - based exploits the extracted EEG featu res to predict the time course of the em otions ex pressed by individua ls. This model enables u s to go beyond the predefined label s and provides predictions of the time-varying em otional appraisal based on the neu ral correlates of the stimuli. In addition to the proposed model, LR, SVR and LSTM - RNN models are employed for continu ous emotion recognition. The m ain contributions of this work are as follows. First, we have proposed a novel model for emotion recogniti on for the fi rst time. The superior performa nce of t he pro - posed m odel is confirmed by comparing the model error with other m odels, includin g LR, SVR, and LSTM-RNN . Second, we have applied emotion in our analysis as a con- tinuous signal, not fixed labels. Third as far as we know this the first study that inv estigated t he MI of EEG fea - tures with emotion dimensions. 2 M A TERIALS AND METHODS 2.1 Subjects We recruited fifteen volunteers for this study. P articipants were non-musicians (age: 2 1±3 yrs, 3 males) with a similar educational background (undergraduate or MSc students). All subjects were right -handed, had normal hearing, and no history of any neurological and psychological disorders. They also reported tha t they had normal nocturnal sleep (7 to 9 hours starting 10-12pm) one week b efore the experiment. The participants reported no use of caffeine, nicotine, and energy drinks 24 hours before the experiment, and had not excessive physical activ ity 24 hours before the recording session. The study protocol was approved by the Ethics Committee at the Ferdowsi University of Mashhad. 2.2 Stimuli Stimuli were selected a ccording to a previous study [36] to cover bot h positive an d negative musical emotions. They comprised the first 60 seconds of the seven compositions shown in Table 1. Altogether, these seven pieces were used to induce emotions with different levels of valence and arousal. T ABLE 1 M USICAL EXCERPTS USED DUR ING THE STUD Y . No. Name Composer 1 Neynava (Neynava ) Alizadeh 2 concierto de aranjuez (Adagio) Rodrigo 3 Shabe vasl (Rang Shahr Ashoub) Darvish khan 4 Eine kleine nacht music(Rondo Allegro ) Mozart 5 Le Quattro stagio ni (La primavera) Vivaldi 6 Nocturne Op. 9 (No. 2) Chopin 7 Peer Gynt's Suite no .2(Solveigs song) Grieg 2.3 Experimental protocol To ensure that all participants were equally familiar with the musical stimuli, two to four days before the experiment the subjects wer e presented with the stimuli and were instructed to listen to each piece in a calm environment on ly once. Par- ticipants sat in a comfortable chair in dim light. The stimuli were presented via suitable headphones at a comfortable volume which was the same across all subjects. During EEG recordings, the stimuli were played for the par ticipants, a nd they were instructed to pay attention t o the comp ositions. Right after EEG recordings the musical excerpts were once again played for the participants and while listening to each excerpt, they ex pressed their continuous emotiona l apprais- als by moving the cursor on a 2 -dimensional a rousal-valence (A -V) plane. FEELTRACE [37] was used for recording the time- varying participants’ ra tings of A -V. For further pro- cessing, the sampling r ate of the recorded A -V data was re- duced to 128 Hz. EEG recording of the scalp was carried out using Emotiv EPOC 14-channel EEG wireless recording headset (Emotiv Systems, Inc., San Francisco, CA). This de- vice obtains EEG data with an internal sa mpling frequency of 2048. The output data was later downsa mpled to 128 Hz. Electrode pla cement was according to the 10 – 20 sy stem (Electro Cap International Inc., Ea ton, USA), including posi- tions AF3, F 7, F3, FC5 , T7, P7, O1, O2, P8, T8, FC6,F4, F8, and AF4 as illustrated in Figure 1.a. During the preparation steps we were cautious a bout the correct placement of the headset on ea ch subject’s h ead. Common mode reference was used. The portability and easy - to -wear charact eristics of the re- cording device ma kes it a good candidate for BCI applica- tions [3 8]. During each recording session participants com- pleted six consecutive trials, with each trial consisting of two 5 s silence intervals, two 5 s white n oise intervals and one 60 s stimulus. One trial sequence is depicted in Figure 1.b. 2.4 EEG proces sing After data acquisition, EEG signa ls were band-pass fil- tered with a lower cut off frequency of 2 Hz and upper cut off frequency of 42 Hz to reduce EMG and power line artifacts. Nex t, independent component analysis (ICA) was performed on the EEG signals. To reject the I CA components a multiple artifa ct rejection algorithm (MA- RA) was employed using EEGLAB plug-in MARA [39] . The EEG signa ls were later transferred to a common av - erage montage. EE G s ignals were visua lly ins pected to remove the remaining artifacts. EEGLAB toolbox [40 ] wa s used for EEG data preprocessing. Fig. 1. (a) Channel location s. (b) One trial during the ex perimental protocol. Since the emotiona l appraisal signals, which were consid- ered as behavioral responses, did not contain high - frequency components [41] and also to remove noise s corresponding to ha ndshakes during cu rsor navigations, a moving avera ge window was used to smo oth t he ap- praisal da ta. Figure 2 shows valence and arousal signals corresponding to musical selection (MS) n o. 2 (Table 1), evaluated by one of the subjects, along with the ir smoothed versions. To estima te emotions from EEG signals, the propo sed model was used to find the rela tion between inputs (time - varying power spectra of EEG signals) and outputs (indi- vidual em otion appraisal signals) of the system. To calcu - late time-varying EEG power spectra Morlet wavelet transform was used . The applied real-valu ed Morlet wavelet is defined as [42 ]: 2 ( ) ex p( ) cos( 5 ) 2 t tt ( 1) The continuous wavelet transform of a signal () xt , ( , ) x W t s , will be obtained by convolution of the signal with shifted and scaled versions of the mentioned real Morlet wavelet: 1 ( , ) ( ) ( ) x tt W t s x t ss (2) where t and s indicate the shift a nd scale p arameter, re- spectively. The continuous wavelet transform was computed for all frequency bands. The scale parameter was calculated based on t he frequency range of theta (4-8 Hz), alpha (8- 13Hz) and b eta (13-31Hz) frequency band s to obtain time- varying power spectra of each band. Then the pow er spectra in every band w ere averaged over the frequency range in corresponding band to obtain one time-varying signal for every frequency bands . Th is procedure was repeated for every channel; thus for all channels we produced 42 input candidates (4 frequency bands×14 channels). 2.5 Fuzz y Parallel Cascades One of the commonly used pa radigms in nonlinear system identification is the parallel cascade structure [43]. In the current study, we used this struc ture and combined its con- cept with a fuzzy inference system to introduce a novel ap- proach, called Fuzzy Parallel Cascades (FPC). Figure 3 shows the structure of the proposed model. Fuzzy logic succ ess is due to its c apabil ity i n desc ribi ng syst em dyna mics by sim ple (a) (b) Fig. 2. Ti me-varying emotion appraisal signals and their correspond- ing smoothed ver sion for valence a nd arousal for musical ex cerpt no . 2 (MS2) by one of the subje cts. conditi onal IF-THEN rules. In most applicati ons, this capabi l- ity provides a simple solution which requi res relativel y short comput ation tim e . Also, all in format ion and enginee ring knowled ge re lat ed to the st ructure of the sy stem, as well a s its optimi zatio n, can be employe d directly [31, 44] . In this study, we a pplied a look -up table scheme [4 5] for rule extraction, which will be described in the next section. Overall, the uni- versal approximation capability [4 5], interpretability of fuzzy inference systems, the rule extraction ability of look-up table schemes [45] and structure of the parallel cascades paradigm make our pr oposed method a feasible and transparent iden- tification method for estimating the emotional appraisal re- sponse. The proposed model includes c n cascades with ea ch having a sepa rate set of inputs. If the main in put of the system is () i xn , the inputs of the i- th cascade 12 ( ), ( ),..., ( ) i i i n r x n d x n d x n d are the de layed versions of () i xn where r n is the number of delays. Each of the pre- viously introduced 32 input candidates can be employed in this step. Since we had 32 input candi dates, the maximum number of cascades w as limited to 32 . Each cascade in cludes a fuzzy logic-based model represented by i f which will b e described in the following pa ragraphs. The estimated output of the i- th cascade ˆ () i yn is calculated as 12 ˆ ( ) ( ( ) , ( ),..., ( )) i i i i i n r y n f x n d x n d x n d (3) and the residue of the i- th cascade is ˆ ( ) ( ) ( ) i i i r n y n y n (4) where () i yn is the measur ed or desired output of the i -th cascade. For the first cascade we have the following equation 1 ( ) ( ) y n y n (5) where () yn is the n- th sample of preprocessed time-var ying appraisal signal and for 2 , 3 , ..., c in we have 1 ( ) ( ) ii y n r n (6) where 1 () i rn is the residue of the p re vious cascade. Rough- ly speaking, this means that by add ing a n ew cascade to the model we intended to estimate the nonlinear dynamics of the system which could not be determined using the already developed cascades. Fig. 3. The proposed model structur e. In the i -th cascade, xi ,y i are input and outputs, respecti vely. d represents the delay of input, and f i is the fuzzy logic-based model developed f or the i -th cascade. This procedure is repeated for c n cascades. Finally, the es - timated output of model, ˆ () yn , is obtained by 1 ˆˆ ( ) ( ) n c i i y n y n (7) To a void over fitting, we imposed a residue criterion ( cr r ) to limit the number of cascades. 1 1 1 ˆ ˆ c i i cr c i i r yy yy (8) This criterion represents the error reduction ratio due to add- ing the c -th cascade to the model. The c -th casca de is added if cr r for the validation da ta is less than on e, i.e., a ppending cascades is continued only until the overall system error ke eps a decreasing manner. This procedure determine s the number of cascades. Therefore our model consisted of c n cascades w ith each h av- ing a multi-input/single-output (MISO) fuzzy system w ith n r inputs and one output. To simplify, w e rename () ik x n d as () ik xs where 1 , 2 , ..., s sl with s l being the length of inputs and outpu t data vectors. For each input vect or ik x , m x n fuzzy sets and for each output vector i y , m y n fuzz y sets are defined. Membership functions for the k -th delay of the in put of the i -th cascade, ik x , and output ar e named ( 1 , 2, , ) j m k x j n and ( 1 , 2 , , ) l m y l n , respectively. If we consider three Gaussian membership functions for ik x , the continuous pa rtitioning o f it will be as depicted in Figure 4. By the ordered arrangement of s -th samples of output vector i y and input vectors ik x , 1 , 2 , ..., r kn , an ordered ( 1 r n )- tuples, ( ( ), ( )) , 1 , 2 , , i i s s y s s l , is created where 12 ( ) ( ( ), ( ), , ( )) i i i i n r s x s x s x s (9) We have 11 ( ) , , n r i x x x x n n rr s U a b a b R (10 ) and ( ) , i y y y s V a b R (11) where U a nd V are the universa l sets of inputs a nd output, respectively. ( 1 , 2 , , ) l m y l n and ( 1 , 2 , , ) j m k x j n fuzzy sets are complete in the cor responding intervals. Fir st, for every ( ( ), ( )) , 1 , 2 , , i i s s y s s l , membership values of ( ), 1 , 2 , ... , ik r x s k n in fuzzy sets ( 1 , 2 , , ) j m k x j n and membership v alues of () i ys in fuzzy sets ( 1 , 2 , , ) l m y l n are determined, and na med () j k ik x s and () li ys , respectively. Next, for every input; the fuzzy set in which () ik xs had the largest membership value is determined (and named, e.g. j k ). A similar procedure is carried out for the output which results in l . Final ly, an IF-THEN fuzzy rule fo r the s -th sample is 1 1 ( ) ( ) ( ) jj l i i n n i r r if x is an d a n d x is the n y is s s s (12) Due to the large number of input-output ( 1 r n )-tuples, it is possible to have some antithetical rules with similar “ if ” and different “ then ” parts. To solve this problem , a w eight is as- signed to every produced rule using the following equation: 1 ( ) ( ) n r j l k k i k i DR x y ss (13) The strongest rule among antithetical r ules is chosen , and the remaining rules are remove d [45].By imposing the above fuzzy rules w e create c n fuzzy systems for the realization of the FPC model . Each of thes e fuzzy systems uses the Mamdani product inference engine. This inference engine is equipped with algebraic product T -norm, max s-norm, and Mamdani product implications. Supposing that the rule ex- traction process produced M consistent rules, by using the generalized Modus Ponens rule the membership function of the inference output of the i -th fuzzy sy stem for s -th sample is [45]: ˆˆ 1 1 1 ( ( )) max ( ), , ( ) ( ) ( ) m i i in r p U i n r ik i j l k k y s Sup x s x s x s y s (14) where () ik j k xs and () i l ys are Gaussian mem- bership functions 2 () ( ) exp j ik ik ik j j k ik x s cx xs x (15) and 2 () ( ) exp l ii i l l i y s cy ys y (16) j ik cx and l i cy are cent ers a nd j ik x and l i y are sta ndard deviations (SD) of the k- th input and output membership function of the i -th fu zzy system, respectively. In the las t stage by using the center o f gravity defuzzification we calcu- late the numerical output of the i -th fuzzy system as follows ˆ ˆ ˆ i i i V i ii V y y dy y y dy (17) Different values for r n and the number of membership functions are evaluated using repeated experiments to pro- duce the most accurate estimates. The process above resulted in the following values, 3 , 2 m m r xy n n n . During the identification phase, w e employed the MI for selection of the appropriate input to each cascade from the pool of inputs. To do so, input candidates w ere sorted based on their MI w ith the corresponding output signal. MI shows the amount of information shared between the two variables [46]. For two random variables , xy , MI defined as , ( , ) ( ; ) ( , ) log ( ) ( ) xy p x y I X Y p x y p x p y (18) where ( , ) p x y is the joint probability function of , xy and ( ), ( ) p x p y are marginal probability functions of , xy respec- tively. In the case of independent , xy , MI is zero. Once an input was chosen it was removed from the pool of input candidates a nd hence not considered in the successive steps . As mentioned earlier, adding cascades w as continued until cr r was less than one. 3 R ESUL TS 3.1 Behavioral R esult We recorded the valence and arousal v alues repor ted b y participants on the FEELTRACE screen while listening to 60 s of each musical ex cerpt (Table 1). A part of the mean of continuous r eported valence a nd a rousal of all musical ex- cerpts a re illustrated in Figure 6 . w here the shadow ed r ange indicates standard deviation. The a verage value of reported valence and arousal for every musical excerpt are also demonstrated in Ta ble 2. According to the average values of reported valence, we categori zed MS1, a nd MS2 a s “melan- cholic”, MS3, MS4 , and MS5 as “joyful” and MS6 and MS7 as “neutral”. Only the valence is consi dered for music categori- zation because we ha ve chosen MSs based on the positivity and negativity of emotion which implies valence. Fig. 4 . Three Gau ssian membership functions for part itioning the input s pace of . i and k are the number of cascades and delays, respectiv ely . is the member ship function of the input in the j-th fuzzy se t . Fig. 5. Mean and standard deviation (SD) signals of valence and arousal reported by participants for each musical excerpt in time. Unit of the y-ax is of all plots is AU (arbitrary unit). To investigate whether emotional rating s among these cate- gories are diff erent, a statistical test on the a verage ra tings between the categories was perfor med. Since the distribu- tion of data wasn’t normal, the Kruskal -Wallis test was ap- plied. The results of the statistical test are demonstrated in Table 3. As can be seen from Table 3 valence a nd arousal for all ca tegories of melancholic, joyful, and neutral a re signifi- cantly different (p<0.05). 3.2 Mut ual Information of Em otion and EEG Features During the identification process, MI of EEG signals and emotion appraisal w as used to select model inputs. In this way , the EEG si gnals which ha ve h igher MI with emotion applied as inputs t o estimate emotion. It means that EEG electrodes with h igher MI were those wh o played a m ore critical role in producing the emotiona l appraisal signal . Since MI shows the infor mation sh ared between two signals [46], to find out which EEG electrodes shared more infor- mation w ith emotion signals, mean MI between power spec- tra of different cha nnels in ea ch frequency band (i.e. theta, alpha, and beta) with A-V si gnals for different MSs are shown in Figure 6.a and 6.b for valence and arousal respec- tively. From Figure 6 it seems that MI values of channels located in the frontal region with both valence and a rousal are higher than other channels, especially in theta and alpha frequency band. This observation confirmed repor ts of pre- vious researches in the role of this region in the processing of emotional stimuli [3]. B ased on Davidson’ s frontal brain asym- metry h ypothesis, left frontal activation are related to experiencing emotions with positi ve valence while right frontal activation is associated with negative em otions [47] . TABLE 2 M EAN AND ST ANDARD DEVIA TION (SD) OF V ALENCE AND AROUS AL . TABLE 3 COMP ARISON OF V ALENCE AND AROUSAL BETWEE N CATEGORI ES . Category 1 Category 2 p-value Valence Arousal Melancholic Joyful 9.56E-10 9.56E-10 Neutral 9.56E-10 2.05E-07 Joyful Melancholic 9.56E-10 9.56E-10 Neutral 9.56E-10 9.56E-10 Neutral Melancholic 9.56E-10 2.05E-07 Joyful 9.56E-10 9.56E-10 Considering the contribution of the frontal reg ion in emotion processing [3], w e are going to investigate whether MI of frontal channels with emot ional appraisal signal in mel an- cholic, joyful a nd neutral MSs a re different or n ot. Moreover , to in quire Davidson’ s hypothesis, the MI of EEG electrodes locat- ed in left and right frontal with e motion is compared in musical excerpts categories ( melancholic, joy ful and neutral ). It is nota- ble that since frontal brain asymmetry h ypothesis is stated for va- lence of emotion, we only performed the analysis o n valence sig- nal. In this way as some data did not have a normal distribu- tion, we have used a Fr iedman followed by multiple compar- isons to compare MI of fron tal chan nels with valence signal among melancholic, joyful and neutral MSs in every f re- quency band. Two factors tha t a ffect every MI value are three categorie s (melancholic, j oyful and neutral) a nd EEG electrodes although our focus is on categories differences. Frontal channels include AF3, F7, F3, FC5, FC6, F 4, F8, a nd AF4 wh ile AF3, F7, F3, FC5 are located in right fron tal and the remains are in left frontal region. Fig. 6. Mean of mutual informatio n of powe r spectra of EEG signals with reported valence (a) and arousal (b) for all channel s in theta, alpha and beta frequency bands. No. Name Valence Mean(SD) Arousal Mean(SD) 1 Neynava (Neynava ) -0.43(0.15) -0.25(0.26) 2 concierto de aranjuez (Adagio) -0.21(0.29) -0.3(0.24) 3 Shabe vasl (Rang Shahr Ashoub) 0.51(0.15) 0.46(0.16) 4 Eine kleine nacht music(Rondo Allegro ) 0.3(0.18) 0.43(0.26) 5 Le Quattro stagio ni (La primavera ) 0.34(0.15) 0.2(0.32) 6 Nocturne Op. 9 (No. 2) 0.15(0.19) -0.35(0.13) 7 Peer Gynt's Suite no .2(Solveigs song) -0.061(0.32) -0.19(0.27) (a) (b) Figure 7 displays the me an and standard deviation of MI between right, left, and a ll frontal EEG an d valence of melan- cholic, joyful and n eutral m usic in theta, alph a and beta bands. The result of the statistical test is also depicted in this figure. The asterisks indicate significant differences (p<0.05 and p<0.001). As Figure 7 shows in all frequency ban ds, MI between posi- tive valen ce (j oyful musical excerpts) and EEG of right, left and all frontal channels are significantly hig her tha n MI be- tween negative emotion (melancholic musica l excerpts) and EEG. Furthermore, for melanc holic and neutral categories, valence of neutral MSs has higher MI with EEG than melan- cholic MSs wh ile in most of the analysis there are n’t any sig- nificant diffe rences in MI of studied EEG a nd valence b e- tween joyful and neutral categories. Moreover for every cat- egory of MSs, the hig hest avera ge MI of right, left and all frontal channels with valence are for theta frequency band, and the lowest is for beta frequency band. 3.3 Mod el validation P erformance of the proposed FPC model is assessed by comparing the RMSE of this model with LR, SVR and LSTM- RNN models. LSTM-RNN parameters are selected based on [7] and it has two hidden layers, including an LSTM layer. The learning rate was sele cted 0 .001 with the momentum of 0.9. In the modeling process of all models , fo r all musical e x- cerpts a nd all subjects we divided the corresponding inputs (EEG spectra of different channels) and outp ut (va lence or arousal) data vect ors into tw o parts for identification and validation phases. Therefore for every musical excerpt and subject, the model was identified using the data correspond- ing to the half of each MS and valida ted by the other pa rt of each MS. The procedure mentioned above was investigated for both valence a nd arousal dimensi ons. RMSE was used to evaluate the models' performance. Mean of RMSE of LR, SVR, LSTM-RNN, a nd FPC, calculated over all subjects for both valence and arousal dimensi on , are presented in Ta ble 4. It can be seen that FPC obtains the lowest model error for estimation of bot h valen ce and arousal in all musical ex- cerpts; however the SVR model leads to hig hest RMSE in most of the analysis. Moreover in estimation of valence o f joyful category and a rousal of melancholic categories LR outperformed the LSTM-RNN. The lowest obtained RMSE value is 0.089 which belongs to valen ce es timation of MS4 by FPC model. 4 D ISCUSSION In this study we proposed a fuzzy parallel ca scades model to predict the continuous emotion al content of musical excerpts with different emotional contents by the time -varying spec- tral content of EEG. Time-varying spectral of EEG is comput- ed by wavelet transfor m, a nd the emotional rating w as rec- orded continuously in two dimensions of valence and arous- al. Figure 6 illustrates that the perceived emotion is changing during the time while many previous researchers omit this temporal information by considering the la bels for describ- ing emotion [1 - 3] . The musical excerpts used in the current st udy to induce emotions are categorized to mela ncholic, j oyful and neutral based on their reported valence. The results of statistical test- ing reported in Table 3 indicate that valence and a lso arousal of ea ch categ ory are differ ent which confirms proper catego- ries sele ction. The FPC model is constructed by parallel cas- cades which enables the model to improve the output esti- mation through the cascades. The input of ea ch cascade is electrode in theta, alpha or beta frequency b ands and de- layed versions of it. The MI of time -varying power spectra of EEG with the model output (valence/arousal) has been used to specify the orde r of applying inputs to casca des. Inquiring the obtained MI v alues between EEG of right, left a nd al l frontal channels with valence in three categories of mela n- cholic, joy ful and n eutral MSs indicates h igher MI of EEG with positive valence (joyful MSs) compared to negative va- lence (mela ncholic MSs). This observation disaffirms the frontal brain asymmetry hypothesis . Some of the previous studies also reported lack of this asymmetry [21, 48]. Inspect- ing the difference of obtained MI among studied frequency bands demonstrates that frontal EEG in theta frequency band has more rel ation with va lence than alpha or beta bands. This result is consistent with previous researches which re- ported the involvement of fr ontal reg ion in theta frequency band during emotion processing [10]. The performance of the FPC model is compared with LR, SVR, an d LSTM-RNN model which were utilized for contin- uous affect recognition in previous studies [7, 28, 29]. Fig. 7. Mean and standard deviation of m utual information (MI) between EEG of (a) right, (b) left and (c) all frontal c hannels and valen ce for melancholic, joyful and neutral music in theta, alpha and beta bands. Significant differe nces of MI between categor ies of mus ical excerpts are shown by asterisks (*: p<0.05 and **: p<0.001 ). (a) (b) (c) Mean Mean Mean TABLE 4 RMSE OF MODELS FOR V ALENCE AND AROU SAL ESTIMA TION . LR SVR LSTM-RNN FPC Music V/A Mean(SD) Mean(SD) Mean(SD) Mean(SD) MS1 Valence 0.181(0.13) 0.191(0.13) 0.16(0.11) 0.103(0.088) Arousal 0.219(0.13) 0.234(0.15) 0.22(0.16) 0.11(0.068) MS2 Valence 0.249(0.14) 0.269(0.16) 0.234(0.15) 0.166(0.12) Arousal 0.201(0.13) 0.209(0.14) 0.206(0.14) 0.108(0.059) MS3 Valence 0.139(0.1) 0.154(0.1) 0.14(0.11) 0.106(0.044) Arousal 0.17(0.09) 0.19(0.098) 0.171(0.11) 0.109(0.053) MS4 Valence 0.124(0.06) 0.129(0.07) 0.133(0.075) 0.0895(0.03) Arousal 0.215(0.23) 0.228(0.23) 0.217(0.23) 0.142(0.099) MS5 Valence 0.161(0.15) 0.172(0.16) 0.163(0.14) 0.114(0.088) Arousal 0.236(0.17) 0.234(0.17) 0.254(0.21) 0.171(0.12) MS6 Valence 0.223(0.14) 0.257(0.13) 0.177(0.15) 0.155(0.14) Arousal 0.195(0.08) 0.213(0.12) 0.183(0.081) 0.114(0.065) MS7 Valence 0.171(0.12) 0.182(0.12) 0.173(0.13) 0.097(0.059) Arousal 0.254(0.2) 0.269(0.23) 0.255(0.27) 0.129(0.088) The lower RMSE of the FPC model demonstrates superiority of this model in emotion prediction in comparison to other studied models. This higher performance of FPC model can be related to two main characteristics of it. Firstly the parallel cascade structure w hich is appropriate for iden tification of systems with high-or der nonlinearities [43] such as EEG. Secondly the applied fuzzy -based system which enables us to describe system dyna mics by simple rules and apply ex- pert knowledge to optimize the performance of the system [31, 44]. It is notable that our analysis is based on continuous ap- praisal and the identification and validation of all applied models are by two different parts of the data of an in dividual during l istening to one music al excerpt. Therefore if emo- tional content of these two parts of MS were different, the estimation error will be increased. There are some points in the current study that can be con- sidered in future researches. Evaluation of continuous affect recognition is a n open re- search problem [49]. The most commonly used measures for evaluation of continuous emotion recognition are RMSE and the Pearson correlation coefficient[49]. However by consider- ing the subjective nature of emotional responses, a pplying common er ror based criteria for evaluating the estimated time-varying emotional sig nal is not plausible. Theref ore a new criterion can be dev eloped b ased on this assumption that if the estimated emotion signal was close to measured emotion, the es timator h as acceptable performan ce a nd there is no need for the estimated and measured emotion signals to be precisely the sa me. This definition can be implemen ted by simple fuzzy rules to have a fuzzy measure for evaluating continuous emotion recognition in future studies. Moreover, we have identified and validated the models based on different parts of the data of the same participant. This method of model developing may not satisfied general- ization thoroughly, as it is one of the important characteris- tics required for the models to be applicable in a real -life scenario. Therefore one of the other points that can be stud- ied for further analysis is that for the sa ke of both generality and considering time variable emotional appraisal of music, the model can be identified by one individual and test with others in future works. In this si tuation, it should be consid- ered that the emotional response of different participants can be affected by their personal parameters such as mood, fa- tigue, etc [7]. 5 C ONCLUSION Using proposed fuzzy parallel cascades a pproach, continu- ous emotional appraisal in two valence and arousal dimen- sions was estimated using time-varying EEG power in three frequency bands, namely theta, a lpha, and beta. Comparing the RMSE of pr oposed model w ith LR, SVR and LSTM -RNN models revea ls supremacy of FPC model. The higher MI of time-varying power spectra of frontal EEG in theta band with the valence confirmed the significant role of frontal channels in theta frequency band in emotion recognition reported in fo rmer researches. The analysis of MI of right and left frontal EEG electrodes with valence of melancholic and joyful musical excerpts did not indicate laterality in frontal brain in emotion processing. As the proposed model is subjective to gen eraliz e it and develop a practical tool, the model would be established on a large database, which per- haps includes subjects with different musical preferences and expertise. F UNDING SOURCES This r esearch did not receive an y specific grant from funding agencies in the public, commercial, or not- for -profit sectors. R EFERENCES [1] P . C . Petrantonakis and L. J. Hadjileontiadis, "Emotion recognition from EEG using higher order crossings," Information T echnology in Biome dicine, IEEE T ransactions on, vol. 14, no. 2 , pp. 186-197, 20 10. [2] A. M. Bhatti, M. Majid, S. M. Anwa r , and B. Khan, "Human emotion re cognition and analysis in respon se to audio music using brain signals," Computers in Human Behavior , vol. 65, pp. 267-275 , 2016. [3] Y. -P . Lin et al. , "EEG-based emotion recognition in music listening," Biomedical Engineering, IEEE T ransactions on, vol. 57, no. 7, pp . 1798-1806, 201 0. [4] G. Balasubra manian, A . Kanagasa bai, J. Mohan, and N. G. Seshadri, "Music induced emotion using wav elet packet decomposition — An EEG study , " Biome dical Signal Processing and Control, vol. 42, p p. 1 15-128, 2018. [5] Y . Ding, X. Hu, Z. Xia, Y . -J. Liu, and D. Zhang, "Inter-brain EEG Feature Extraction and Analysis for Continuou s Implicit Emotion T agging during Video Wa tching," IEEE T ransactions on Affecti ve Computin g, 2018. [6] F . Noroozi, M. Marjanov ic, A. Njegu s, S. Escalera, and G. Anbarjafari, "A udio-visual emotion recognition in video clips," IEEE T ransactions on Affective Computing, vol. 10, no. 1, pp. 60-75, 20 17. [7] M. Soleymani, S. Asghari-Esfeden, Y . Fu, and M. Pantic, "Analysis of EEG signals and facial expression s for continuous emotion detection," IEEE T ransactions on Affective Com puting, vol. 7, no. 1, pp. 17-28, 2016. [8] S. Koelsch, Brain an d music . John Wiley & Sons , 2012. [9] T . Eerola and J. K. Vuos koski, "A comparison of the discrete and dimensiona l models of e motion in music.," Psychology of Mus ic., vol. 39, no . 1, pp. 18-49, 201 1. [10] D. S ammler , M. Grigutsch, T . Fritz, and S. Koelsch, " Music and emotion: elec trophysiologi cal correlates of the processing of pleasant and unpleasant music," Psychophysiology , vol. 44, no. 2, pp. 293-304, 2007. [1 1] L. -O. Lundqvist, F . Carlsson, P . Hilmersson, and P . J uslin , "Emotional responses to m usic: experience, expre ssion, and physiology ," Psychology of music, 2008. [12] A . J. Blood and R. J . Zatorre, "Intensely pleasurable responses to music correlate with acti vity in brain regions implicated in reward and emotion," Proceedings of the National Academy of Sciences, vol. 98, no. 20, pp. 1 181 8- 1 1823, 2001. [13] K . Mueller et al. , "Investiga ting the dynamics of the brain response to music: A central role of the ventral striatum/nucleu s accumbens," Neuro Image, vol. 1 1 6, pp. 68 -79, 2015. [14] S . Moghimi, A . Kushki, S. Power , A. M. Guerguerian, and T . Chau, "Automati c detection of a prefrontal c ortical response to emotionally rated music using multi -channel near -infrared spectroscopy ," Journal of neural engineering , vol. 9, no. 2, p . 026022, 2012 . [15] S . M. Alarcao and M. J. Fonseca, "E motions recognition using EEG signals: A survey ," IEEE T ransa ctions on Affective Com puting, 2017. [16] M. Balc oni, E. Grippa, and M. E. V anutelli, "What hemodynamic ( fNIRS), electrop hysiological (EEG) and autonomic integrated measures can tell us about emotional processing ," Brain a nd c ognition, v ol. 95, pp. 67 -76, 2015. [17] W. Zheng, "Multichann el EEG -Ba sed Emotion Recognition via Group S parse Canonical Correlation Analysis," IEEE T ransactions on Cog nitive and Developmental Systems, 2016. [18] P . Ozel, A. Akan, and B. Yilmaz, "Synchrosqueezing transform based feature extraction from EEG signals for emotional state prediction," Biomedical Signal Processing and Control, vol . 52, pp. 152-16 1, 2019. [19] F . Hasanz adeh and S. Moghimi, "Em otion estimatio n during listening to music by EEG signal and applying NARX model and gen etic algor ithm," pre sented at the National Conference of T ec hnolo gy , Energy & Data on Electrical & Co mputer Engineering , 2015. [20] S . Koelstra and I. Patras, "Fusion of facial expre ssions and EEG for implicit affective t agging ," Image and Vision Computing, vol. 31 , no. 2, pp. 164-174, 2013. [21] F . Hasanzadeh, H. Shahabi, S. Moghimi, and A. Moghi mi, "EEG investigation of the effective brain networks for recognizing m usical emotion s," Signa l and Data Processing, Re search vol. 12, no . 2, pp. 41-54, 201 5. [22] H. Shahabi and S. Moghimi, "T oward autom atic detec tion of brain responses to emotional m usic through analysis of EEG e ffectiv e c onnectivity ," Computers in Human Behavior , vol. 58 , pp. 231-239, 20 16. [23] P . Li et al. , "EEG based emotion recognition by combining functional conne ctivity networ k and local activation s," IEEE T ransactions on Biomed ical Enginee ring, 2019. [24] T . Song, W. Zheng, P . Song, and Z. Cui, "EEG emotion recognition using dynamical gra ph convolutiona l neural networ ks," IEEE T ransactions on A ffective Computing, 2018. [25] J . A. Russell, "A circumplex model of affe ct.," Journal of personality and social psycholog y , vol. 39, no. 6, pp. 1 161- 1 178, 1980. [26] R. E. Thayer , "The biophysiology of mood and arousal, " ed: New Y ork: Oxford U niversity Pr ess, 1989. [27] W. Liu, L. Zhang , D. T ao, and J. Cheng , "Reinforcemen t online learning for emotion prediction by using physiological signals," Pattern Recognition Letters, vol. 107, pp. 123-1 30, 2018. [28] M. A. Nicolaou, H . Gunes, and M. Pantic , "Continuou s prediction of s pontane ous affect f rom multiple cues and modalities in valence-arousal space," IEEE T ran sactions on Affective Co mputing, vol. 2, no . 2, pp. 92-105, 201 1. [29] Q. Mao, Q. Zhu, Q. Rao, H. Jia, and S. Luo, "Learning Hierarchical Emotion Context for Continuous Dimensional Emotion Recognition From Video Sequences," IEEE Access, vol. 7, pp . 62894-62903, 2019. [30] V . Z. Marmareli s, Nonlinear dynamic mode ling of physiological sy stems . John Wiley & Sons, 2004 . [31] M. Annabestani and N. Naghavi, "Nonlinear identifi cation of IPMC actuators based on ANFIS – NARX paradigm," Sensors and Actuator s A: P hysica l, vol. 209 , pp. 140 – 148, 2014. [32] M. Annabestani and M. Saadatmand-T arzjan , "A New Threshold Selection Method Based on Fuzzy Expe rt Systems for S eparating T ext from the Background of Document Images," Iranian Journal of Science and T echnology , T ransactions of Electrical Engineering, journal article vol. 43, no. 1, pp. 219-23 1, July 01 2019. [33] F . Hasanz adeh and F . Faradji, "An ICA Algorithm Based on a Fuzzy Non-Gaussianity Measure," presented at the 1s t Conference on New Research Achievements in Electrical and Computer Engineering, 2016 . [34] M. Anna bestani, A. Rowhaniman esh, A. Mizani, and A. Rezaei, "Fuzzy descriptive evalua tion system: real, complete and fair evaluation of students," Soft Computing, journal article M ay 20 2019. [35] M. Annabestani, N. Naghavi, and M . Maymandi-Nejad, "From modeling to implementa tion of a method for restraining back relax ation in ion ic poly mer – metal composite soft actua tors," Journ al of intelligent material systems and structures, vol. 29, no. 15, pp. 3124-3135, 2018. [36] I . Peretz, L. Gagnon , and B. Bouchard, "Music and emotion: perceptual determin ants, immediacy , and isolation after brain damage," Cogn ition, vol. 68, no. 2, pp. 111 -141, 1998. [37] R. Cowie, E. Douglas-Cow ie, S. Savvidou *, E. McMahon, M. Sawey , and M. Schröder , "'FEEL TRACE': An instrument for recor ding per ceived emotion in real time," in ISCA tutorial and research workshop (ITR W) on speech and emotion , 2000. [38] S . K. Hadjidi mitriou and L. J. Hadjileontiadis, "T oward an EEG -ba sed recognition of music liking using time - frequency analysis," Biomedical Engineering , IEEE T ransactions on, vol. 59, no. 12, pp . 3498-3510, 2012. [39] I . W inkler , S. Haufe, and M. T anger mann, "Automatic classification of artifactual ICA-components for artifact removal in EE G signals," Behavioral and Brain Functions, vol. 7, no. 1, p . 30, 201 1. [40] A . D elorme and S. M akeig, " EEGLAB: an open source toolbox for analysis of single-trial EEG dynamics including independen t componen t an alysis," Journal of neuroscience m ethods, vol. 134, no. 1, pp. 9-21, 2004. [41] F . Upha m, " Quan tifying the temporal dynamics of music listening: a critical investigation of analysis techniques for collections of continuous responses to m usic.," McGill University , 201 1. [42] S . Mallat, A wavelet t our of signal processing . Elsevier , 1999. [43] M. J . Korenber g, "Parallel cascade identification and kernel estimation for nonlinear s ystems," Annals of biomedical engine ering, vol. 19, n o. 4, pp. 429 -455, 199 1. [44] M. A nnabestan i and N. Naghavi, "Nonuniform deformation and curvature identification of ionic polymer m etal composite actuator s," Journal of Intelligent Material Systems and Struc tures, pp. 1 – 17, 2014. [45] L. -X. Wang, A course in fuzzy systems . Prentice-Hall press, USA, 199 9. [46] J . Seok an d Y . S. Kang, "Mu tual infor mation betwe en discrete var iables w ith many categor ies using recursive adaptive parti tioning," S cientific reports, vol. 5, p. 10981, 2015. [47] R. J. Davidson, "Cerebral asymmetry and emotion: Conceptual and m ethodological conundrums," Cognition & Emotion, vol. 7, no. 1, pp. 1 15-138, 1993. [48] D. Hagemann, "I ndividual differe nces in anterior E EG asymmetry: methodological problems and solutions," Biological psycholog y , vol. 67, no. 1-2, pp. 157-1 82, 2004. [49] H. Gunes and B. Schuller , "Categorical and dimensional affect analysis in continuous input: Current t rends and future directions," Image and Vision Computing, vol. 31, no. 2, pp. 120-136, 2013.
Original Paper
Loading high-quality paper...
Comments & Academic Discussion
Loading comments...
Leave a Comment