Spatiotemporal Emotion Recognition using Deep CNN Based on EEG during Music Listening
Emotion recognition based on EEG has become an active research area. As one of the machine learning models, CNN has been utilized to solve diverse problems including issues in this domain. In this work, a study of CNN and its spatiotemporal feature e…
Authors: Panayu Keelawat, Nattapong Thammasan, Masayuki Numao
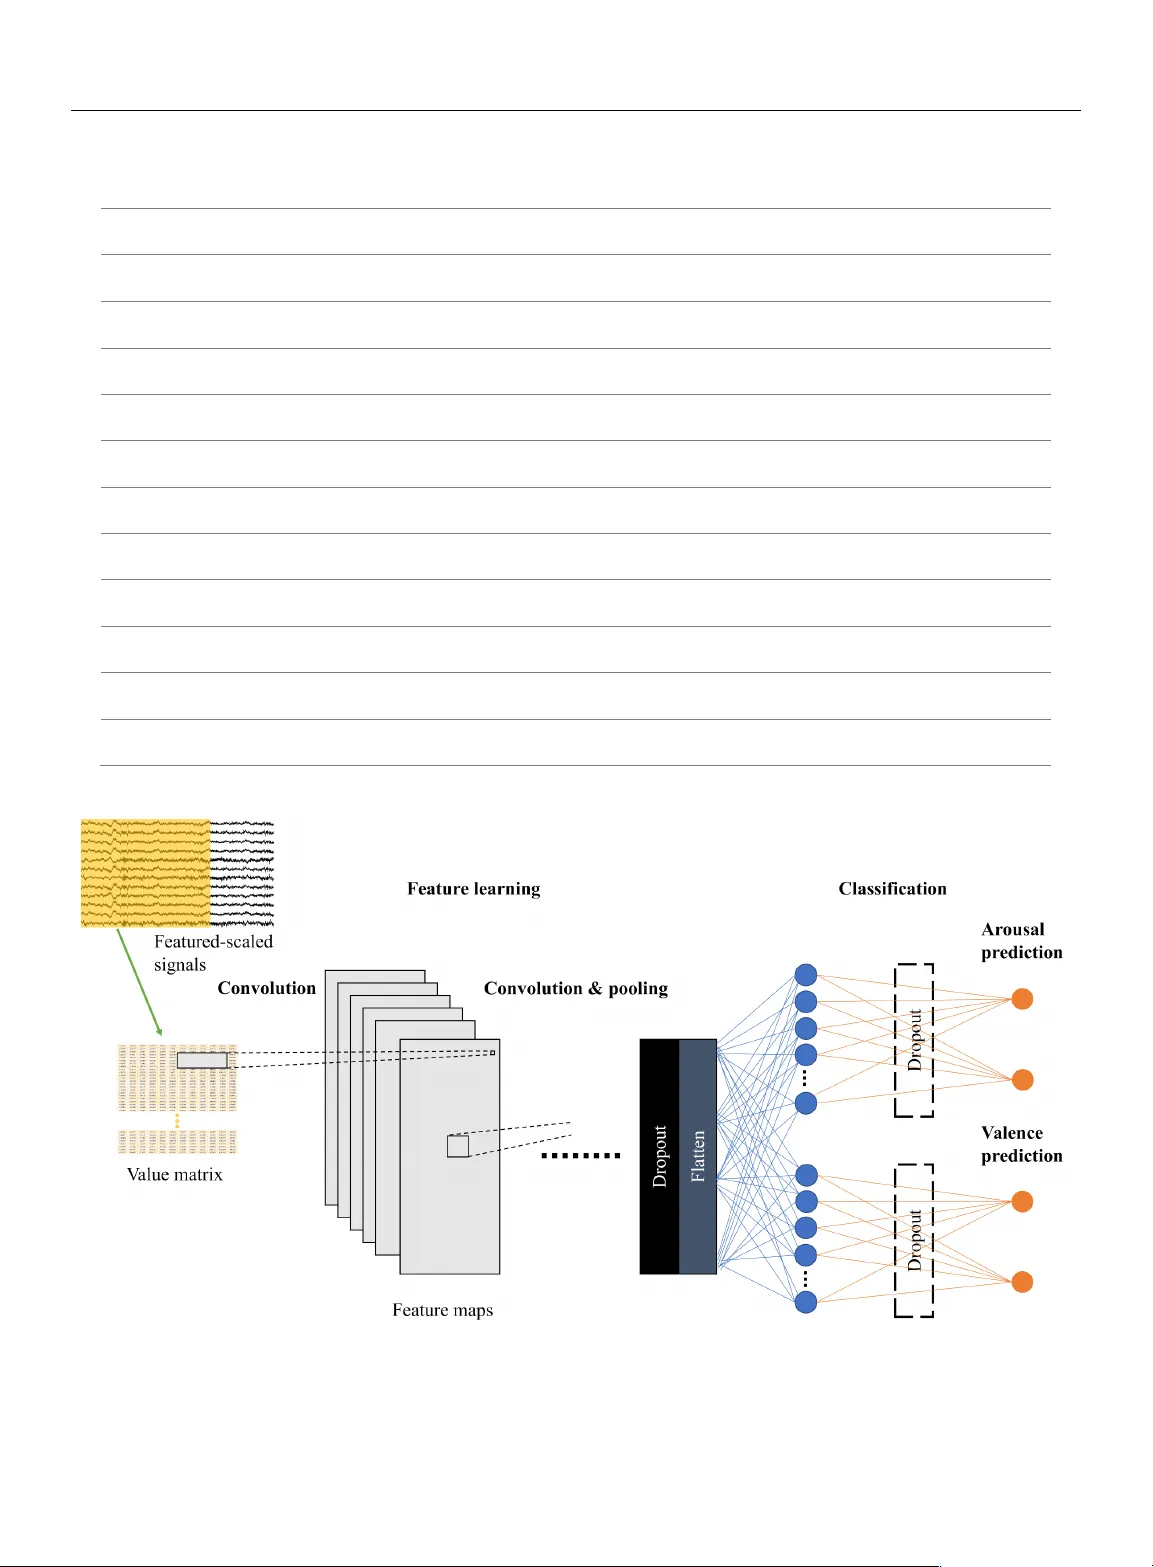
1 Spatiotemporal E motio n R ecognition u sing D eep CNN B ased on EEG during M usic L istening Panayu Keelawat 1 , Nattapong Thammasan 2 , Masayuki Numa o 3 , and Boonserm Kijsiri kul 1 1 Department of Computer Engin eering, Chul alongkorn Uni versity, Ban gkok, Thaila nd 2 Human Media Int eraction, Un iversity of Twente, Ensc hede, Nether lands 3 Institute of Scientific and Industria l Research, Osaka Universi ty, Osaka, Japan Corresponding author : Boonserm Kijsir ikul (e - mail: boonserm.k@chula. ac.th ). ABSTRACT Emotion recognition based on EEG has become an active research area. As one of the machine learning mod els, CNN has been utilized to sol ve diverse problems including issues in this domain. In this work, a study of CNN an d its spatiotemporal feature extraction has been conducted in order to explore the model’s capabilities in varied window sizes and electr od e orders. Our investigation was conducted in subject - independent fashion. Results have shown that temporal information in distinct window sizes significantly affects recognition performance in both 10 - fold and leave - one - subject - out cross validation. Spatia l information from varying electrode order has modicu m effect on classification. SVM classifier depending on spatiotemporal knowledge on the same dataset was previously employed and compared to these empirical results. Even though CNN and SVM have a homolo gous trend in window si ze effect, CNN outperformed SVM using leave - one - subject - out cross validation. This could be caused by different ext racted features in the elicitation process. KEYWORD S emotion recognition , EEG , machine le arning , CNN , spatiotemporal data , brainwave , neuroscience , window size, electrode order I. INTROD UCTION Recently, emotion recognition has become a highly active research area [1] . The reason can be that knowing and understanding emotion is a significan t factor in the field of Human - Computer Interaction ( HCI). By understandi ng sentiment, it could manifest a clearer description of human responses to stimuli. Psychologists have studied emotion and endeavored to repr esent it in a tangible manner. One domina nt theory was proposed by Russell [2] , indic ating that emotion consists of two com ponents, arousal and valence. Arousal designates activation level of emotion, while valence identifies positivity o r negativity. This portrayal systematically describes emotions and i s widely employed as background knowledge of countless studies, including this current work. Physiological signals are pragmatic tools playing as linka ges to emotions, e.g. , electrocardiog ram (ECG), galvanic skin response (GSR) and electroencephalogram (EEG). There have been m any studies to utilize one or m ultiple signals to conduct research on this topic. EEG is one way often employ ed to recognize emotions. As a B rain - Computer Interf ace (BCI), it is a popular tool frequently used in this task. In many studies, there are numerous techniques which are deployed in order to elicit emotions including images [3] , videos [4] , or even HCI games [5] . Music is another interesting technique since it can arouse an eclectic range of emotions [6] . In addition , integrating music to emotion recognition based on EEG can produce several useful applications such as music therapy [7] and music rec ommendation system [8] , etc. In numerous studies, multimodal approach was achieved. Basically, fusion of related information is deployed instead of relying on only a single source. For instance, V erma and Tiwary attempted to identify depression using EEG, GSR , electromyogram (EMG), electrooculogram (EOG), respiratory pattern, blood volume pressure and skin temperature [9] . In addition, b rainwave are proc essed together with features from pupil diameter, gaze distance and eye blinking while watching videos [10] . With respect to music - emotion recognition, there are several studies using 2 multimodal approa ches as well. Lin et al. man ipulated EEG and musical contents for estimating emotion respons es in music listenin g [11] . Additionally, Thammasan et al. addressed time - varying charact eristics of emotion while listening to music combining with amalgamation of EEG and musical f eatures [1 2] . From our literature re view, there are still numerous works we have not mentioned and some research groups that have built multimodal monitoring systems for study convenience [13, 14] . A single - modality approa ch mostly dimini shes emotion recognition performance. Brainwave have extremely low energy and can be susceptible to a great amount of trivial influences. This makes EEG collection oscillate greatly in different experi mental settings. However, focusing only on EEG can guarantee that there is no intervention from other non - BCI sources . The st udy of EEG directly scru tinizes the brain’s cognitive state in human mirrori ng in the collect ed brainwave and annotated emotion classes. Conventionally, the task relies on manual feature extraction from recorded si gnals before feeding in a classifier. Features enginee ring is normally extracted from band power, signal dimension complexity, etc. Signal complexity along with te mporal d imension are so me of the most popu lar features that have been widely used with derivation into fractal dimension [15, 16] . In addition, asymmetry across electrodes has been indicated [11, 17] . It is plausible that spatial and temporal information, or spatiotemp oral data, could form into a specific characteristic which identifies brain states. This could be cumbersome for feature extraction. Moreover, all vital features are not warranted to be addressed which can probably hinder optimized performance. With the rise of machine learnin g, new cl assific a tion models have been introduced to practically produce leveraged operation on several problems. Convolutional Neural Network (CNN) has been recently introduced as m achine learning. In fact, it has been developed from a simple “neocognitron” [18] to a com plex architecture that can solve enigmatic problems nowadays. It has advantages at capturing adjacent spatial inf ormation, which, in this case, is spatiotemporal material from EEG. Being an end - to - end model, it has been straight forwardly integrated into a wide variety of ap plications without m anually extracting features. I n our previous work on testing in subject - independent manner [19] , it showed its potential in generalization to other unseen subjects comparing with another work that operated on Support Vector Machine (SVM) built on Gaussian radical basis kernel using the same dataset [12] . From our review, investigation of CNN gaining advantage from s patiotemporal information is still limited, while there ar e copi ous e xaminations on other cl assifiers. Although some studies h ave probed CNN’ s performan ce, it is still unclear how it achieves recognition depending on related factors such as window size and electrodes sorting. In this paper, we aimed to analyze CNN in emotion recognition task based solely on EEG while listening to music along with its effect from electrode order and window size, playing as spatiot emporal inputs. The investigation consisted of multipl e network architectures in subject - independent evaluation. According to this analysis, we expected to gain more int ellectua l insigh ts on CN N and re lated f actors from inputs which possibly impacts its execution. Thus, this intuition can develop a better understanding that furthers the exploration of BCI, neuroscience, cognitive science and other associated subjects in the future. II . MATERIALS AND METHODS A. DATA COLLECTING AND P REPROCESSING This part i ncludes several steps from the beginning of the study on which all other following parts were derived. 1) SUBJECTS Experimental data were acquired f rom twelve stude nts from Osaka University. All were healt hy men with mean age of 25.59 years, st andard deviation (SD 1.69 years). Music tracks were used as stimulation and none of the particip ants eve r had formal music education training. Music collection consisted of 40 MIDI files. Each song had only dis tinct ins trument and tempo in order to circumvent influence from lyrics. Subjects were directed to select 16 songs ou t of the coll ection. Study participation was voluntary. All subjects were informed about the experimental protoco l. 2) DATA COLLECTING PROCEDURE After sel ecting 16 songs, the subjec ts were instructed to list en to them. Songs were synthesized using Java Sound API’s MIDI package [20] . There was a 16 - second silence interval between songs reducing any effect between songs. While each subject was listening to the selected music track, EEG si gnals were rec orded co ncurrently. Sampling rate was s et at 250 Hz. Signals were collected from twelve electrodes based on a Waveguar d EEG c ap [21] . We employed the 10 - 20 international system with Cz as a reference electrode. Those twelve electrodes were all located near frontal lobe that plays an outstanding role in emotion r egulation [7] , i.e. , Fp1, Fp2, F3, F4, F7, F8, Fz, C3, C4, T3, T4 and Pz. FIGURE 1. The 10 - 20 system of electrode placement showing the selected electrodes. 3 ! " # $ %& ' ( ) * + " & , ( $&' - ,( . /. (1) FIGURE 2. The two - dimensional emotion model Every electrod e was adjust ed to have impedance of less than 20 k W . Sequentially, EEG signals were driven through Polymate API532 amplifier and visualized by APMonitor, both deve loped by TEAC Corporation [22] . A notch filter was set to the amplifier at 60 Hz. This assured that power line artifact would not interfere with t he analysis. Each subject was asked t o close his eyes and stay stil l during the experiment to avoid generation of other unrelated artifacts. When a s ubject fi nished th e mu sic listening to all 16 song s, the next s tep was to annotate emotions. The EEG cap was detached. Subjects had to listen to the same songs again in the same order. They labeled their feelings by continuously clicking on a corresponding spot in arousal - valence space displayed on a screen. According to the system, both arousal and valence were recorded separately. Data coll ection finally finished when da ta from all subjects were recorded. Next, we applied signal preprocessing. 3) EEG PROCESSING The frequency range that correlates wi th this work is 0.5 - 60 Hz. We employed a bandpass filt er to cut off others which were not related . Another tool that was used was EEGLAB [23] . It is an open - source MATLAB environment for EEG processing. We utilized it to r emove contaminated artifacts based on Independent Component Analysis (ICA). Those factors could be noise, eye movement, activity from muscle. When every antecedent step was done, sig nals were assoc iated with emotion annotation via times tamps. Following, mean and SD were calculated from signal samples, hence we were able to perform feature scaling in terms of standardization. This helps in reducing error rates from high varying signal magnitudes [2 4] . Labeled emotion elements were categorized into classe s. Arousal was divided into high and low, whereas valence was grouped into posit ive and negati ve. The emotion model can be v iewed as Fig 2. We conside red emotio n recognition as binary classification task of both components. Data from this proces s were cons idered foundation materials for the rest of the experiment in this paper. Flowchart of data colle ction and preprocessing is shown below as Fig 3 . B. SUBJECT - INDEPE NDENT EXPER IMENT The attempt to create a u niversal emotion classifier based on EEG is a challenging topic. Still, there is no standard methodology that gai ns an unbe atable r ecognizer for ever y subject. In this experiment, we considered CNN complexity, window size and electr ode orderi ng as foll ows. 1) CNN COMPLEXITY CNN is a broad term that id entifies i ts highlight in computation. Literally, it applies convolution as i ts base concept. By defi nition, convolution of discrete function f and g , which is denoted by f * g , can be calculated as the formula The operator can be operated usin g convolutional layers. We designed and examined four deep CNN models with various number of convol utional layers (described as 3Conv to 6Conv). Techniques such as dropout and max pooling were used for model r egularization [25] . After detecting high - level features, every model had fully - connected network for separated arousal and valence prediction at the end. Models can be viewed as Table 1 and Fig 4. FIGURE 3. Data collecti ng and preprocessing pro cedure 4 TABLE I Network A rchitectures Index 3Conv 4Conv 5Conv 6Conv 1 Conv 5x5x32 Conv 5x5x32 Conv 5x5x32 Conv 5x5x32 2 Conv 3x3x32 Conv 3x3x32 Conv 2x2x32 Conv 2x2x32 3 MaxPooli ng 2x2 MaxPooli ng 2x2 Conv 2x2x32 Conv 2x2x32 4 Conv 3x3x64 Conv 2x2x64 MaxPooli ng 2x2 MaxPooli ng 2x2 5 Dropout 0.5 Conv 2x2x64 Conv 2x2x64 Conv 2x2x64 6 FC 128x1 FC 128x1 Dropout 0.5 Conv 2x2x64 Conv 2x2x64 7 Dropout 0.5 Dropout 0.5 FC 128x1 FC 128x1 Dropout 0. 5 Conv 2x1x64 8 FC 2x1 FC 2x1 Dropout 0.5 Dropout 0. 5 FC 128x1 FC 128x1 Dropout 0. 5 9 FC 2x1 FC 2x1 Dropout 0. 5 Dropout 0. 5 FC 128x1 FC 128x1 10 FC 2x1 FC 2x1 Dropout 0. 5 Dropout 0. 5 11 FC 2x1 FC 2x1 FIGURE 4. Model i llustration 5 Accordi ng to abbreviati ons, terms are def ined as the following. Conv i x j x k means convolutional layer with height of i , width of j and k number of kernels . MaxPooling i x j designates max pooling layer with height of i and width of j. Dropout p conveys the meaning of dropo ut layer with probability of p being dropped. FC i x j expresses fully - connected layer that has i entries of height and j entries of width. Weig hts were adjusted by cross - entropy activation function except for the last layer that used s oftmax. Adam optimizer was adopted for speeding up training [26] . Early stopping was deploy ed to avoid overfitting. A comparison between models is shown and discussed in subsequent sectio n. 2) WINDOW SIZE Choosing window s ize is an inevitable part in ti me series d ata which inclu de EEG as wel l. Analyzi ng these a lternative s may be commonplace for traditional machine learning algorithm in this field. Yet, this factor has not been widely ad dressed on deep CNN architecture. From feature - scaled collected EEG signals, they were divided with time frame in range from 1 to 10 seconds, no overlapping time, and stored i n isolated directories. Majority vote was incorporated in this part so that we coul d earn arous al an d vale nce re presentatio n clas ses f or each window. The test consisted of 10 - fold cross validation (10 - fold CV) covering all subjects and leave - on e - subject - out cross validation (LOSO CV). Cross - validation set was randomly selected from training sets of both evaluation methods to avoid overfi tting. Evalu ation metric s ca n be referred in “Performance evaluation” sectio n. 3) ELECTRODE ORDERING The most challenging aspect of the brainwave is generalization to unseen subjects. To maximize correlation between subj ects, ordering of electrodes is important, especially when employing CNN. The network is good at capturing interconnected spatial informa tion and it has a chance to be affected by juxtaposed electrodes. We des igned the order in four types, i.e. , randomized order, 3D physical ordering, max adjacent correl ation and min adjacent correlation. Results from LOSO CV were compared on window size of 4 seconds, overlapping time 1 second. FIGURE 5. Sample plots of signals FIGURE 6. Stacked electrode order regarding physical order on helmet From fe ature - scaled signals, correlation across electrodes could be observed. Some electrodes fetched congruent dynamics which are plott ed as sample figures bel ow (Fig 5 ). Placing electrodes regarding their correlation may perhaps affect the emotion classi fication. Sorting by randomizing elect rode order was intentionally used as a baseline for othe r arrangem ents. We rearranged 20 times and averaged the output pe rformance. In 3D physical ordering, we mimicked electrode placement on t he real device. When ga zing from the top view, electrodes are put in a 2D space. They can be represented as a 2D matrix which is shown by Fig 6. We stacked value s placing in this allo cation in the order of time s teps. N eighbor electrodes may have interrelated correlation possib ly increase classification performance. Classifiers were modified to work with 3D inputs. Next, Pear son Correl ation Coef ficient ( PCC) was calculated from every combination of electrode pairs. PCC is a value that reflects connection between them which can be computed by where 0 1 represents value of signal sampled from electrode 0 ! at time step 2 . Similarly, 3 1 possesses the same definition for electrode 3 . 4 56 ) * 7 !0 1 - 0 %!3 1 - * 3% 8 1 9 : ; 7 !0 1 - 0 % 8 1 9 : ; 7 !3 1 - 3% 8 1 9 : (2) 6 TABLE II Accuracy and MCC from 10 - fold CV Based on Different Window Sizes Windo w si ze ( sec ) 1 2 3 4 5 6 7 8 9 10 Arousal 3Conv 75.512260 (0.510245) 66.707170 (0.334143) 61.569896 (0.231398) 59.686349 (0.193727) 60.782640 (0.215653) 59.510111 (0.190202) 58.388207 (0.167764) 59.715554 (0.194311) 58.031088 (0.160622) 57.986625 (0.159732) 4Conv 77.600002 (0.552000) 65.754998 (0.315100) 62.424051 (0.248481) 61.120324 (0.222406) 59.939152 (0.198783) 59.407722 (0.188154) 59.226454 (0.184529) 59.810440 (0.196209) 58.808290 (0.176166) 58.683963 (0.173679) 5Conv 78.360166 (0.567203) 69.952916 (0.399058) 61.270763 (0.225415) 60.537013 (0.210740) 59.433138 (0.188663) 58.555873 (0.171117) 61.619124 (0.232382) 59.626325 (0.192526) 59.222798 (0.184456) 58.969284 (0.179386) 6Conv 78.354899 (0.567098) 65.865875 (0.317317) 59.449026 (0.188981) 59.371796 (0.187436) 59.909242 (0.198185) 59.816118 (0.196322) 58.906295 (0.178126) 60.446776 (0.208936) 58.290155 (0.165803) 58.451405 (0.169028) Valence 3Conv 81.886288 (0.637726) 75.371624 (0.507432) 73.483398 (0.469668) 73.371355 (0.467427) 73.172258 (0.463445) 73.290033 (0.465801) 73.215299 (0.464306) 73.392191 (0.467844) 73.264249 (0.465285) 73.092150 (0.461843) 4Conv 82.822542 (0.656451) 74.563355 (0.491267) 73.266174 (0.465323) 73.414643 (0.468293) 73.366355 (0.467327) 73.221657 (0.464433) 73.058486 (0.461170) 73.480374 (0.469607) 72.953368 (0.459067) 73.088117 (0.461762) 5Conv 83.676591 (0.673532) 75.205413 (0.504108) 73.099396 (0.461988) 73.438168 (0.468763) 73.000396 (0.460008) 73.391725 (0.467835) 73.174980 (0.463500) 73.753299 (0.475066) 73.264249 (0.465285) 73.088789 (0.461776) 6Conv 82.745467 (0.654909) 74.429703 (0.488594) 73.249591 (0.464992) 73.325508 (0.466510) 73.309780 (0.466196) 73.392074 (0.467841) 73.218327 (0.464367) 73.614847 (0.472297) 73.056995 (0.461140) 72.973854 (0.459477) <== ) * >? * @ * >A - B? * @ * BA ; ! >? C *B? %! >? C BA %! >A C B? % ! >A C BA % (4) t is the total sam ples for electrode 0 and 3 . T hus, 4 56 denotes PCC between 0 and 3 . We utilized this information to rearrange electrodes in two algorithms, maxim ize adjacent pairs [27] and minimize adjacent pairs. Results fr om these four methods were e valuated an d measured us ing LOSO CV wit h fixed wi ndow size of 4 seconds and 1 second of overlapping time. C. Perfor mance evaluat ion So as to gauge and compare results, sensible metrics should be accounted. As mentioned earlier, we performed two cross validation methods, 10 - fold CV and LOSO CV. In both cases, accuracy and Matthews Correlation Coefficient (MCC) [28 ] were as sessed from the separated test set . Accur acy was defined as: DEEFGHE3 ) * >? C >A >? C B? C >A C BA * @ * IJJ (3) while >? , >A , B? and BA were denoted as th e number of true positives, true negatives, false pos itives and false negatives, respectively. Self - reporting emotion state method could lead to produce an imbalance of data. Therefore, we adopted M CC which takes class i mbalance factor into account. It can be calculated as: while all abbreviatio ns are th e same as e quation 3. MCC ranges from - 1 to 1 inferring all wrong to all correct prediction. III . RESULTS AND DISCUSSION By varying win dow sizes, we are able to see their effects on performance for both 10 - fold CV and LOSO CV. As shown in Table 2, increasing window frame could gain a lower performance in 10 - fold CV. This observation applies to every model no matter how compl ex it is. Also, the outputs from all models seem similar. There is potential that enlarging the frame size can possibly decrease resemblance between instances. In fact, testing the performance by 10 - fold CV can produce a test set which has a greater simila rity to training set considering that it randomly selects pieces from every subject. 7 FIGURE 8. Subject - independent valence 10 - fold CV M CC values with distinct architectures and window sizes TABLE III A ccuracy and MCC from LOSO CV Based on Different Window Sizes Windo w si ze ( sec ) 1 2 3 4 5 6 7 8 9 10 Arousal 3Conv 51.973875 (0.039477) 51.198190 (0.023964) 53.297832 (0.065957) 53.829943 (0.076599) 58.307336 (0.166147) 54.264346 (0.085287) 54.697619 (0.093952) 57.571068 (0.151421) 54.389915 (0.087798) 55.961331 (0.119227) 4Conv 52.253759 (0.045075) 54.005930 (0.080119) 56.953875 (0.139078) 56.216050 (0.124321) 55.301173 (0.106023) 56.409596 (0.128192) 57.518202 (0.150364) 57.865969 (0.157319) 57.004601 (0.140092) 56.456915 (0.129138) 5Conv 51.585923 (0.031718) 52.454037 (0.049081) 50.714366 (0.014287) 57.806189 (0.156124) 52.317148 (0.046343) 56.603117 (0.132062) 54.610227 (0.092205) 56.538308 (0.130766) 57.928869 (0.158577) 57.517705 (0.150354) 6Conv 52.545877 (0.050918) 54.952697 (0.099054) 58.476066 (0.169521) 57.349610 (0.146992) 57.289999 (0.145800) 58.364474 (0.167289) 59.384568 (0.187691) 52.765602 (0.055312) 57.219417 (0.144388) 57.447433 (0.148949) Valence 3Conv 71.256462 (0.425129) 70.232125 (0.404643) 71.664168 (0.433283) 73.085791 (0.461716) 73.175037 (0.463501) 72.929536 (0.458591) 72.668358 (0.453367) 73.388377 (0.467768) 72.286893 (0.445738) 72.911275 (0.458225) 4Conv 67.604987 (0.352100) 70.124416 (0.402488) 69.604462 (0.392089) 72.249955 (0.444999) 72.892736 (0.457855) 73.046220 (0.460924) 71.757534 (0.435151) 73.343332 (0.466867) 72.599404 (0.451988) 72.911274 (0.458225) 5Conv 63.117011 (0.262340) 67.872853 (0.357457) 71.758958 (0.435179) 70.747202 (0.414944) 73.094099 (0.461882) 73.149101 (0.462982) 72.995189 (0.459904) 73.299005 (0.465980) 73.019718 (0.460394) 72.855346 (0.457107) 6Conv 65.358923 (0.307178) 71.031241 (0.420625) 72.682953 (0.453659) 73.083914 (0.461678) 72.978358 (0.459567) 73.043616 (0.460872) 72.046344 (0.440927) 73.343332 (0.466867) 73.019718 (0.460394) 72.852173 (0.457043) FIGURE 7. Subject - independent arousal 10 - fold CV MCC values with distinct architectures Thus, training covers examples from the who le set of participants and t hose fragments have higher propensity to be scattered more pervasively throughout the dataset when window size is small . With less parame ters to learn, greater spreading in the dataset and higher amount of training examples, using smaller window sizes could increment t hese factors and generate significantly better results. On t he other hand, evaluat ing models using LOSO CV is likely to cause ad verse outcomes. Even though s mall window siz e could affect number of traini ng insta nces and learning parameters, training and test set were less similar. The re could be immense variations between signals from each subject. Expanding window size might help decrease difference among them. In other words, gazing in a larger span of time could reduce fluctuation among instances from distinct subjects. Hence, wider wi ndow size may gain a better performance by employing LOSO CV. From Figs 9 and 10, the lines are not increasing steadily but an uprising trend can be found in all models. This also suggests that model complexity does not play a big role affecting the out puts. 8 The results have si milar trend s in SV M classifier based on RBF kernel (kernel scale = 3) which had achieved elevation from widening window sizes in LOSO CV. Even though CNN behavior is mostly alike SVM, CNNs are relatively better at recognizing unseen subjects as mirrored from LOSO CV i n both valence and arousal. The possible cause can be from the advant age of CNN that utilizes spatiotemporal information to conduct self - governing feature extraction. In other words, while SVM was fed with manually extracted spatiotemporal features, i.e. , fractal dimension and asymmetry indexes, CNN excerpted features aut onomously. Those extracted attributes may be different from the manually extract ones and may be applicable to various subjects including the unseen ones. Graphs considering results of CNNs together with SVM are illustrated below for patent visualization. Absolute PCC val ues were used to decide el ectrodes sequence using algorithms as described in the previous section. Maximum adjacent PCC was the order of F7, F8, C4, Fz, T4, Pz, T3, C3, Fp2, F3, Fp1 and F4 . Besides, minimum adjacent PCC was placed in t he or der of T4, F3, Pz, Fp1, T3, F4, C3, F7, Fz, F8, C4 and Fp2 . Results f rom elect rode sort ing are shown in Table 4. As d ata suggest, their orders might no t i nduce a sig nificantly high impact on the performance of an unseen subject, although random order never generate s the best accomplishment in any architecture. Sometimes the best one from one m odel is beaten even by the random order scheme in another model. FIGURE 9. Subject - independent arousal LOSO CV MCC values with distinct architectures and window sizes FIGURE 10. Subject - independent valence LOSO CV MCC values with distinct architectures and window sizes FIGURE 11. Subject - independent arousal LOSO CV accuracy of CNN s and SVM FIGURE 12. Subject - independent valence LOSO CV accuracy of CN Ns and SVM 9 Table IV Accuracy and MCC from LOSO CV from M ult iple E lectrodes S orting B ased on F our N etwork A rchitectures Architecture 3Conv 4Conv 5Conv 6Conv Arousal Random order 54.5023705 (0.0900475) 55.7120145 (0.1142405) 56.0077815 (0.1201555) 55.9331215 (0.1186625) 3D physical placement 56.411501 (0.128230) 56.438905 (0.128778) 53.791591 (0.075832) 59.408788 (0.188176) Max adjac ent PCC 56.577301 (0.131546) 56.156246 (0.123125) 55.814186 (0.116284) 55.915050 (0.118301) Min adja cent PCC 56.604240 (0.132085) 55.954750 (0.119095) 57.456453 (0.149129) 57.670596 (0.153412) Valence Random order 71.8832085 (0.437664) 72.0806555 (0.441613) 72.652166 (0.4530435) 72.9508505 (0.459017) 3D physical placement 72.556503 (0.451130) 73.060076 (0.461202) 73.076878 (0.461538) 73.060076 (0.461202) Max adjac ent PCC 71.417263 (0.428345) 71.021820 (0.420436) 71.310650 (0.426213) 73.060076 (0.461202) Min adja cent PCC 73.042715 (0.460854) 72.877022 (0.457540) 72.011532 (0.440231) 73.060076 (0.461202) Evaluation method, 10 - fold CV or LOSO CV, is a crucial part in affecting inclinati on of the obtained results due to its subsequent effects such as instances diffusion and their resemblance to the test set. Instance sizes and number of training examples will induce different effects based on evaluation practice which were r eflected from the tests we conducted described above. If focusing on generali zation performance, then LOSO CV should be more considerable. Nonetheless, if the focus is on univer sal classifi er for known subjects, 10 - fold CV could be more appreciable. By far, CNN has shown it s ability to capture spatiotemporal patterns to recognize emotions in unseen subjects. How ever, results s till have limitations and fully cannot address the real reason that makes such outputs, since we have yet to inve stigate t he exact l earning t he models h ad undergone. Pinpointing classifier at tentive features is an arduous effort. This could be a potential direction for future study. By knowing a deeper understanding of its mechanism, the root cause of its generalization ability can be identified. Also, it may help designing learning networks to be more efficient in this and other similar task s. Moreo ver, s ince C NN has many parameters t o learn comparing t o SVM on RBF kernel, it may not gain its optimal capability with a limited dataset. Finding more participants with diver se characteristics could also help. III . CONCLUSION In this paper, we an alyzed CNN performance in emotion recognition based solely on EEG during music listening combined with other influenti al factors. We inves tigated architecture complexity, window size selection and electrode order. EEG signals were collected f rom twelve sub jects and signal processing techniques were employed to reduce effects from unrelated artifacts. Evaluation of 10 - fold CV and LOSO CV was carried out from the pr eprocessed signals in subject - independent fashion. Results have shown that evaluation method di fferentiates behavior according to related factors. Enlarging window size reduces a ccuracy in 10 - fold CV which could be caused by increased parameters, instance resemblance and sparsity. Contrarily, wide window size may help in LOSO CV because instances could be less fluctuating across subjects. Furthermore, electrode order is insignif icant to the classification. On a wider scope, CNN outperformed SVM if tested on an unseen s ubject. This can be observed from LOSO CV. The possible supporting factor is that CNN is capable of usi ng spatiotemporal information to extract features and could be applicable to wider range of participants. Differently, SVM gets better results on 10 - fold CV. It can be that the manually extracted features that were employed to serve the clas sifier are more appropriate to seen subjects rather than features elicited from CNN. Additionally, SVM has less parameters to learn compared to CNN which could be privileged on a limited dataset. However, there are many issues that are still unclear , namely the exact spatiotemporal features CNN captures in this experiment. Profound analysis on t he test instanc es should be performed as future study in this field. Knowing its mechanism would be easie r for researcher s to construct a guideline in designing the network more effect ively. We coul d gain better results with more explainable CNN insight. ACKNOWLEDGMENT We would l ike to t hank Cha noktho rn Uerpa irojk it for h is artwork presented in this paper. 10 REFERENCES [1] R. A. Calvo and S. D. Mello, "Affect Detection: An Interdisciplinary Review of M odels, Metho ds, and Their Applicatio ns," IEEE Transactions on Affective Computing, vol. 1, no. 1, pp. 18 - 37, 2010. [2] J. A. Russell, "A circumplex model of affect," Journal of Personality and Social Psychology, vol. 39, no. 6, pp. 1161 - 1178, 1980. [3] C. - T. Wu, G. D. Dillon, H. - C. Hsu, S. Huang, E. Barrick, and Y. - H. Liu, "Depression Detection Using Relative EEG Power Induced by Emotionally Po sitive Images and a Conforma l Kerne l Suppo rt Vector Machine," Applied Sciences, vol. 8, no. 8, 2018. [4] M. Soleymani , S. Asghari - Esf eden, Y. Fu, and M . Pantic, "Analysis of EEG Signals and Facial Expressions for Continuous Emotion Detection," IEEE Tr ansactions on Affective Computing, vol. 7, no. 1, pp. 17 - 28, 2016. [5] H. Kandemir and H. Kose, "Effects of Physical Activity Based HCI Games on the Attention, Emotion and Sensory - Motor Coordination, " presented at the Advances in Service and Industrial Robotics, 2019. [6] S. Koelsch, Brain and music . Wiley - Blackwell, 2012. [7] S. Koelsch, "Brain correlates of music - evoked emotions," Nature Reviews Neuroscience, Review Article vol. 15, p. 170, 2014. [8] H. - Y. Chang, S. - C. Huang, an d J. - H. W u, "A personalized music recommendation system based on e lectroencephalography feedback," Multimedia Tools and Applications , vol. 76, no. 19, pp. 19523 - 19542, 2017. [9] G. K. Verma and U. S. Tiwary, "Mult imodal fusi on framework: A multiresolution approach for emotion classificat ion and recognition from physiolog ical signals," NeuroImage, vol. 102, pp. 162 - 172, 2014. [10] M. Sole ymani, M. Pantic, and T. Pun, "Mul timodal Emotion Recognition in Response to Videos," IEEE Transactions on Affective Computing , vol. 3, no. 2, pp. 211 - 223, 2012. [11] Y. - P. Lin, Y . - H. Yang, and T. - P. Jung, "Fusion of electroencephalographic dynamics and musical contents for estimating emotional responses in music listening," Original Research vol. 8, no. 94, 2014. [12] N. Thammasan, K. - i. Fuku i, and M . Numao, "Multimodal Fusion of EEG a nd Musical Features in Music - Emotion Recognition," presented at the 2017 AAAI Conference on Artificia l Intell igence, 2017. [13] T. J. Doty, B. Kellihan, T. - P. Jung, J. K. Zao, and I. Litvan, "The Wearabl e Multimodal Monitor ing System: A Platform to Study Falls and Near - Fall s in the Real - World," presented at the Human Aspects of IT for the Aged Populat ion. Design for Everyday Life, 2015. [14] U. Ha et al. , "A Wearable EEG - HEG - HRV Multimodal System With Simultane ous Monitoring of tES for Mental Health Manag ement," IEEE Tran sactions on Biomedical Circuits and Systems, vol. 9, no. 6, pp. 758 - 766, 2015. [15] O. Sourina, Y. Liu, Q. Wang, and M. K. Nguyen, "EEG - Based Personalized Digital Experience," in Universal Access in Human - Computer Interaction , B erlin, Heid elberg, 2 011, pp. 591 - 599: Springer Berlin Heidelberg. [16] Q. Wang, O. Sourina, and M. K. Nguyen, "EEG - Based "Serious" Games Design for Medical Applicat ions," i n 2010 International Conference on Cyberworlds , 2010, pp. 270 - 276. [17] A. Konar and A. Chakrab orty, Emotion Recognition: A Pattern Analysis Approach . Wiley, 2015. [18] K. Fukushima, "Neocognitron : A self - organizing neural ne twork model for a mechanism of pattern recognition unaffected by s hift in position," Biological Cybernetics, vol. 36, no. 4, pp. 193 - 202, 1980. [19] P. Keelawat, N. Thammasan, B. Kijsirikul, and M. Nu ma o, "Subject - Independent Emotion R ecognition During Music Listening Based on EEG Using Deep Convolut ional Neural Networks," in 2019 IEEE 15th International Colloquium on Signal Processing & Its Applicati ons (CSPA) , 2019, pp. 21 - 26. [20] Oracle. (20 18, 16 Jun.). Java Sound Technology [Internet]. Available: https://docs.oracle.com/javase /7/docs/technotes/guides/sound [21] ANTNeuro. (2019, 16 Jun.). wavegu ard™ EEG caps [Internet]. Available: https://www.ant - neuro.com/products/waveguard_caps [22] TEAC. (2019, 16 Jun.). TEAC CORPORATION: Recording Tomorrow [Internet]. Available: https://www.teac.co.jp/int [23] A. Delorme et al. , "EE GLAB, SIFT , NFT, BCIL AB, and ERICA: New Tools for Advanced EEG Processing %J Computational Intelligence and Neur oscience," vol. 2011, p. 12, 2011, Art. no. 130714. [24] Ç. Gülç ehre a nd Y. Bengio, "Kn owledge matters: Importance of prior information for optimization," The Journal of Machine Learning Research, vol. 17, no. 1, pp. 226 - 257, 2016. [25] N. Srivastava, G. Hinton, A. Krizhevsky, I. Sutskever, and R. Salakhutdinov, "Dropout: a simple way to pre vent neural networks from overfitting," Journal of Machine Learning Research, vol. 15, no. 1, pp. 1929 - 1958, 2014. [26] D. P. Kingma and J. Ba, "Adam: A method for stochastic optimization," presented at the 3rd International Conference for Learning Represe ntati ons (ICLR), 2015. [27] Z. Wen, R. Xu, and J. Du, "A novel convolutional neural networks for emotion recognition based on EEG signal," presented at the 2017 International Conference on Security, Pattern Analysis, and Cybernetics ( SPAC), 2017. [28] B. W. Matthews, "Compariso n of th e predicted and observed secondary structure of T4 phage lysozym e," Biochimica et Biophysica Acta (BBA) - Protein Structure, vol. 405, no. 2, pp. 442 - 451, 1975. PANAYU KEELAWAT has just received B. Computer Eng. degree from Chulalongkorn University , Thailand. In 2018, h e was a research intern at Osaka University, Japan. His research interests include machine learn ing, artificial intelligence, and deep lea rning. NATTAPONG THAMMASAN received the B. Computer Eng . degree in 2012 from Chulalongkorn University , Thailand . He also obtained M . Sc. in 2015 and Ph. D. in 2018 from Osaka University, Japan. He is currently a postdoctoral researcher at Department of Human Media Interacti on (HMI), University of Twente, Netherland s. His research interests include affective computing, artificial intelligence , machine learning , and brain - computer interaction . 11 MASAYUKI NUMAO is a professor at Department of Architecture for Intelligence, Institut e of Scientific and Industrial Research , Osaka University. He receive d B. Eng. in electrical and electronic engineering in 1982 and his Ph. D. in computer science in 1987 from Tokyo Institute of Technology. He worked at Department of Computer Sci ence, Tokyo Institut e of Technology from 1987 to 2003 and w as a visiting scholar at CSLI, Stanford University from 1989 to 1990. His research interests includ e artificial intelligence, machine learning, affective com puting, and empathic computing. He is a member of IPSJ , JSAI, and AAAI . BOONSERM KIJSIRIKUL re ceived B. Eng. in electrical and electronic engineering in 1988, M . Eng. in co mputer engineering in 1990 and D. Eng. in Computer Engineering in 19 93 from T okyo Institute of T echnology, Tokyo, Japan . He is currently working as a professor at Depar tment of Computer Engineering, Chulalon gkorn University , Bangko k, Thailand . His research interests consist of m achine learnin g, artific ial intelligence, natural langua ge processing, etc.
Original Paper
Loading high-quality paper...
Comments & Academic Discussion
Loading comments...
Leave a Comment