Using Supervised Learning to Classify Metadata of Research Data by Discipline of Research
Automated classification of metadata of research data by their discipline(s) of research can be used in scientometric research, by repository service providers, and in the context of research data aggregation services. Openly available metadata of th…
Authors: Tobias Weber, Dieter Kranzlm"uller, Michael Fromm
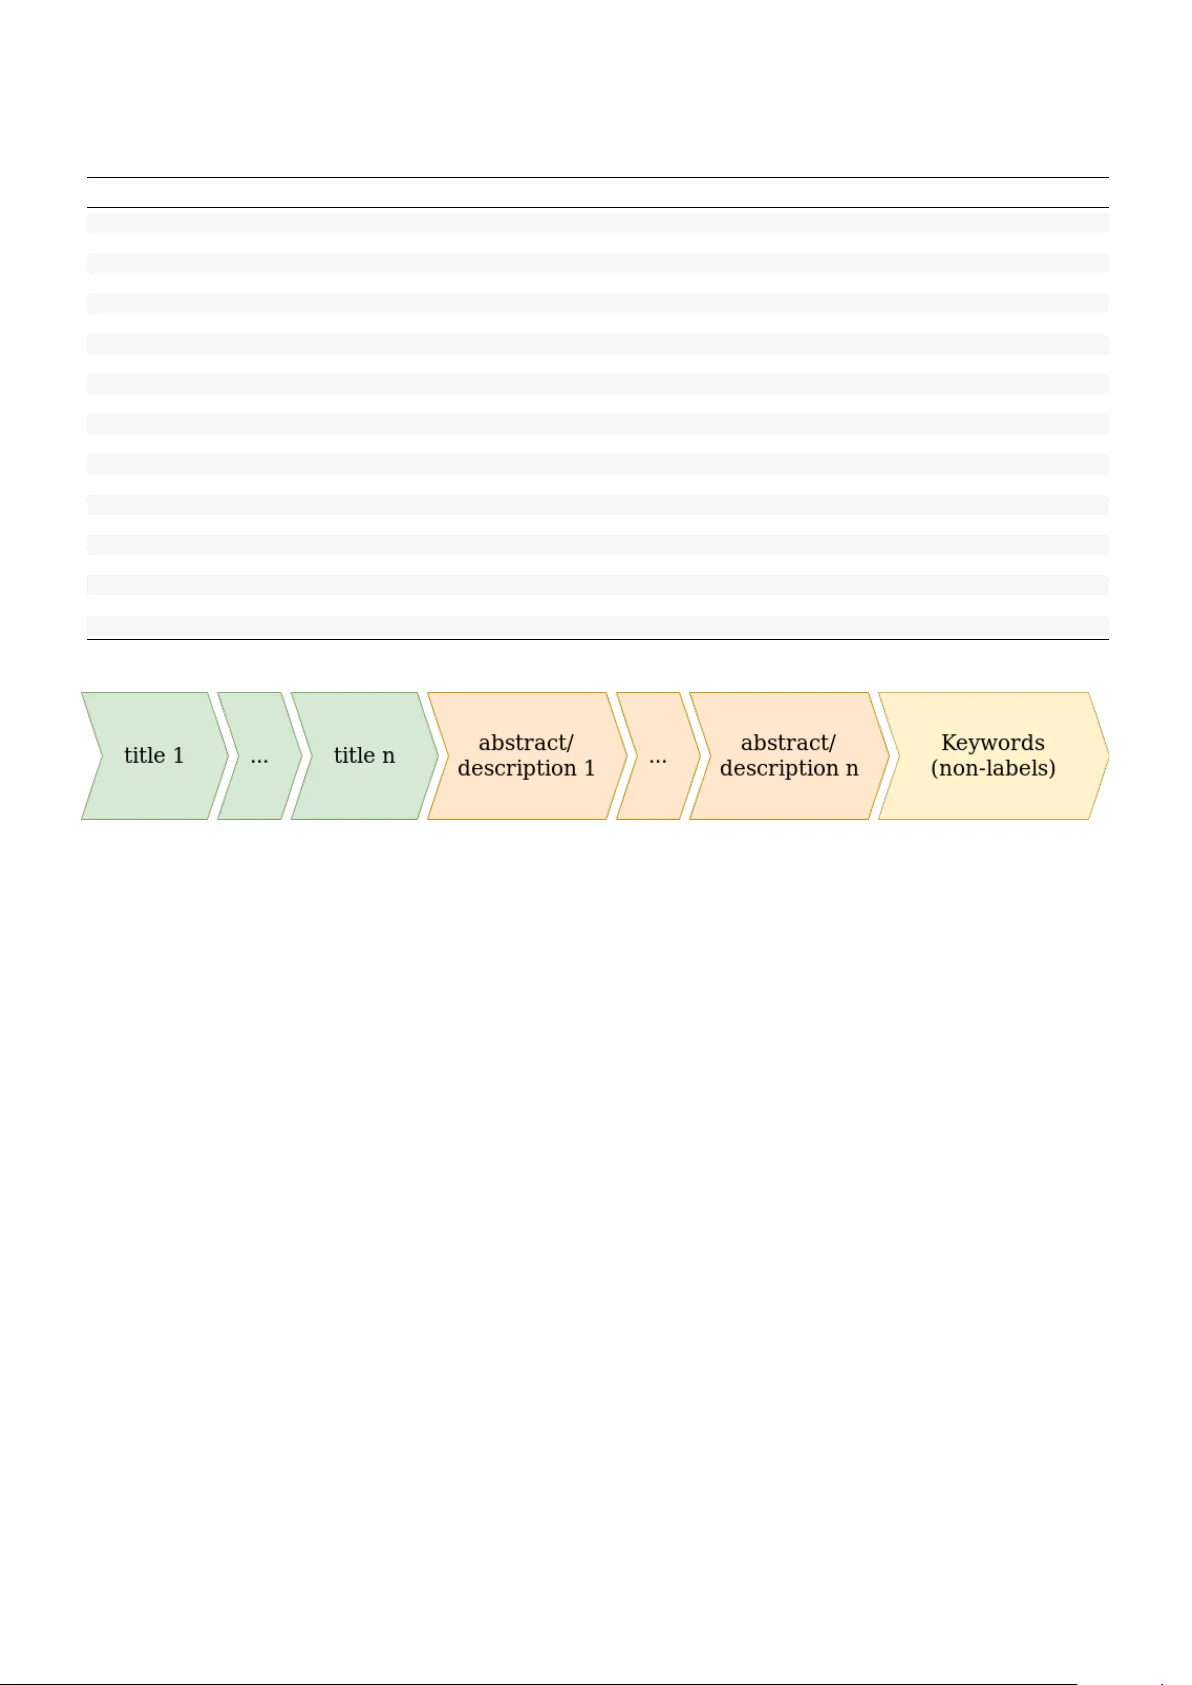
Using Supervised Learning to Classify Metadata of Research Data by Discipline of Research T obias W eber ∗ † , Dieter Kranzlm ¨ uller † , Michael Fromm ‡ , Nelson T a v ares de Sousa § ∗ Corresponding Author , weber@lrz.de, orcid/0000-0003-1815-7041 † Leibniz Super computing Centr e , Garching b . M ¨ unchen (Germany) ‡ Database Systems Gr oup , Ludwig-Maximilians-Universit ¨ at M ¨ unchen (German y) orcid/0000-0002-7244-4191 § Softwar e Engineering Gr oup , Kiel University (Germany) orcid/0000-0003-1866-7156 Abstract Automated classification of metadata of research data by their discipline(s) of research can be used in sciento- metric research, by repository service providers, and in the conte xt of research data aggregation services. Openly av ailable metadata of the DataCite index for research data were used to compile a large training and e valuation set comprised of 609,524 records, which is published alongside this paper . These data allow to reproducibly assess classification approaches, such as tree-based models and neural networks. According to our experiments with 20 base classes (multi-label classification), multi-layer perceptron models perform best with a f 1 -macro score of 0.760 closely follo wed by Long Short-T erm Memory models ( f 1 -macro score of 0.755). A possible application of the trained classification models is the quantitative analysis of trends towards interdisciplinarity of digital scholarly output or the characterization of growth patterns of research data, stratified by discipline of research. Both applications perform at scale with the proposed models which are a vailable for re-use. Index T erms research data, disciplines of research, supervised machine learning, multi-label classification, text processing, data science 1 Using Supervised Learning to Classify Metadata of Research Data by Discipline of Research I . I N T RO D U C T I O N By research data, we understand all digital input or output of those activities of researchers which are necessary to produce or verify knowledge in the context of the sciences and humanities [38]. Metadata about research data provide a common scheme across dif ferent formats, encodings and bit-representations and can be used as a placeholder for the research data in order to classify them. Assigning disciplines of research to metadata of research data is a multi-label classification problem: research data can be mapped to multiple disciplines of research and these disciplines are not exclusi ve (research data can belong to more than one discipline). Since both the amount and the growth of research data is too e xtensi ve to keep up with manual routines, automatic classifiers are needed for many use cases [3], [22]. Three of these use cases illustrate the usefulness of such an automated classifier and help to specify the requirements for the data processing pipelines and the ev aluation procedures presented in this paper: 1) Scientometric Research : During scientometric analyses normalization problems arise; the compar- ison of impact of publications is an example: to compare the values (citations, usage, etc.) across fields, these must be normalized to v alues typical for a specific field or discipline of research. Only automated classification procedures allo w to find estimates over large data sets as a baseline for these normalizations. An automated classifier can also be used to take samples out of said large data sets, which are stratified by the discipline of research. 2) Assistant Systems : Pro viders of research data services can tak e adv antage of automated classification in order to assist submitters to their repositories: Assistant systems can use the classifiers to suggest labels to the submitters based on the metadata submitted. This not only eases the work of the submitters and curators, but improv es the overall quality of av ailable metadata. 3) V alue-adding Ser vices : Research data aggregation services, such as DataCite 1 or B ASE 2 collect metadata across different disciplines of research. Enriching the collected metadata by adding classi- 1 https://datacite.org 2 https://base- search.net 2 fication information enables v alue-adding services such as a faceted search, publication alarms for specific fields, or other discipline-specific services. The requirements deri ved by each of these three use cases dif fer: using the automated classifier in sampling research data, a wrongly assigned label has a greater impact on the application compared to a missed label. Assistant systems on the other hand ideally identify all correct labels; since humans can correct the suggestions in this context, a wrongly assigned label is not as bad as a missed label. The former use case therefore stresses the precision of the classifier , while the latter use case stresses its recall. In the v alue-adding services use case both qualities are equally important. The general idea to realize such a classifier as proposed by this paper , is to retriev e openly a vailable metadata for research data, extract title, description and keyw ords from the metadata, vectorize the texts, and find a machine learning algorithm that can predict the discipline of research. T o achie ve that we used the multi-label-enabled classifiers provided by the scikit-learn framework [20], and neural networks as supported by tensorflo w [1]. The scikit-learn frame work only includes well-established models and algorithms, which will help to improve the comparability and reproducibility of our findings. T ensorflo w of fers hardware support for graphic processing units (GPUs) to speed up the training of neural networks; the resulting neural networks can be inte grated into scikit-learn’ s ev aluation procedure with minimal adjustments. The main contributions of this paper are: • A methodically strict e v aluation of selected classification algorithms for each of the use cases • The publication of the data set used for this e v aluation, which allo ws others to reproduce or supersede our findings • The publication of the complete source code used to clean the data and map them to our base classification scheme • Suggestions on ho w automated classifiers can be used for scientometric research The remainder of this paper is structured as follows: Section II discusses the relations of our approach to a selection of published work. In Section III we summarize ho w the data set was retriev ed and cleaned. The combinations of models and vectorization approaches are presented in Section IV. The methodological approach to e v aluate these combinations is described in Section V. Section VI gi ves an overvie w ov er the results, i.e. the best approaches for the use cases. These findings are discussed in Section VII, which includes a comment on threats to validity . The last section concludes and gi ves an outlook including 3 suggestions for exploiting our findings in order to answer scientometric questions. I I . R E L A T E D W O R K An introduction to multi-label classification can be found in [28] and [29], an overvie w and discussion of metrics is presented in [27]. This section lists the most promising approaches to achie ve an automated classification of research data by discipline of research and their common shortcomings, then discusses the av ailable data to e v aluate the approaches and concludes with the presentation of work discussing technical specifics of multi-label classification of textual data that were of interest for our approach. A. A utomatic Classification by Discipline of Researc h The approach presented in [30] uses a Support V ector Machine (SVM) model to classify according to the De wey Decimal Classification (DDC, in three hierarchy lev els). The problem is described as a multi- label classification task with (partially) hierarchical predictions. The partial nature is due to the sparseness of the used training set, which was compiled out of the data av ailable via the BASE service (Bielefeld Academic Search Engine) 3 at that time: On the first le vel of the DDC hierarchy 5,868 English and 7,473 German metadata records were av ailable, on the second and third le vel 20,813 English and 37,769 German metadata records were av ailable. The English classifier had a f 1 -score of 0.81 (classification over base classes, i.e. 10 labels); for the deeper lev els only partial data are av ailable. It is not specified, whether the score is av eraged over the data set (micro) or the scores of each label (macro). In comparison to [30] our training set is approximately 30 times larger . The authors of [31] also discuss the possibilities to apply machine learning algorithms on bibliographic data labeled with DDC numbers. They e v aluate their approach with a data set comprising of classical publications limited to the DDC classes 500 and 600 (science and technology) with 88,400 mostly single- labeled records. The authors suggest to flatten the hierarchy to reduce the initially high number of labels (18.462). Although the proposed classification approach achie ves an accuracy score of nearly 90%, it is no viable option for our use cases, since it is based on a multi-class approach (classification over multiple labels, which are taken as e xclusiv e) and interactions of humans. As already stated, the approach is limited to a relati vely narrow selection of disciplines of research. Another approach to use SVM models to predict DDC research disciplines is presented in [11]. The authors characterize the problem as multi-class, but their classifier honors the hierarch y of DDC. The 3 https://base- search.net 4 used data set includes 143,838 records from the Swedish National Union Catalogue (joint catalogue of the Swedish academic and research libraries). They report a peak accuracy of 0.818. In general, classifiers targeting DDC ([30], [31], [11]), face the problem that predicting the first DDC le vel is typically not very useful (only 10 classes, one of which is ”Science”), whereas classifiers tar geting DDC’ s second le vel need to provide reliable results for 100 labels; for the latter task to succeed the reported data sets are too small and results are as a consequence partial at best. Our analysis of the DataCite index furthermore indicates that DDC is not necessarily the most used classification scheme for research data, despite its popularity among information specialists and librarians (see T able I). These problems could be circumvented by using a classification scheme that is expressi ve enough in the first le vel, as proposed by us. As a conclusion of the revie w of the literature we furthermore decided to not include hierarchy predictions to our problem. W e understand the classification problem at hand as twofold: Classifying base classes on the one hand and determine the depth in the hierarchy on the other . The latter could itself be understood (recursi vely) as a multi-label classification problem. While we hope to contribute to the former , we do not claim to solve the latter . All approaches that we found in the literature hav e at least one of the following shortcomings: • The classification task is characterized as multi-class, not multi-label. • The reported classification performance is not comparable to other approaches, since important values are missing or reported v alues are too unspecific. • The domain of classification only includes classical publications as opposed to the more general class of research data. • The e v aluation of the approaches is limited to a subset of the possible base classes or labels. • The classification routine includes human interaction. Our approach shares none of the named shortcomings. The literature furthermore concentrates on linear machine learning models (most prominently SVMs), which is why we excluded them from the ev aluation and concentrated on tree-based models and neural networks instead. B. Data Publications to Evaluate Classification Appr oac hes A general problem we found in the course of revie wing the av ailable literature is the in-comparability of the reported results; incomplete or in-commensurable performance metrics are not the only issue: The v alues could have been re-calculated if the data of the publication were av ailable. W ith one exception 5 ([13]), all publications we found do not include enough information to retrie ve the data used to ev aluate the presented approach. Additionally , different data sets might lead to dif ferent results; there is no single, canonical data set which is used to e v aluate the different approaches. In [16] an approach is presented to compile an annotated corpus of metadata based on the O AI-PMH standard, the Dublin Core metadata scheme and the DDC classification scheme. The authors created a manual mapping to determine the DDC label. The resulting data set includes 52,905 English records annotated with one of the 10 top-lev el DDC classes. W e improved their approach by using the DataCite metadata scheme [8] which supports qualified links to classification schemes. This allowed us to compile a larger data set with a finer set of base classes and the possibility to integrate different classification schemes into our approach. W e found the resulting data set in a similar imbalance as the data set presented by [16] (cp. Section III). W e hope to contribute not only with our classification approach but also by providing a large data set that can be used to ev aluate future approaches and reproduce the findings of already proposed approaches. C. Multi-label Classification of T extual Data The authors of [4] propose a multi-label classification approach of social media texts based on a combination of a graph-based method with a semi-supervised approach. The problem of social media multi- label classification is similar to our problem, since both handle classification of short and heterogeneous texts with di verse creators. Ho we ver , approaches to select algorithms to classify , clean and prepare data dif fer . The reason lies in the dif ferent domains of the classification problems: While social media data are linked via hashtags or mentions and texts tend to be written in an informal tone or e ven in a particular slang, both description and linking (citations) in our use cases are more formal. This suggests that a less sophisticated approach than presented in [4] might still provide satisfactory results. A similar line of reasoning applies to [39] which is based on Latent Dirichlet Allocation. Stratified sampling is a necessary step in typical multi-label classification pipelines. In [25] an algorithm to realize a ”relaxed interpretation of stratified sampling for multi-label data” is proposed. The base idea is to distrib ute the data items over n subsets, starting with all data items labeled with the least common label (greedy approach). Since our data includes a substantial part with only one label, we followed another approach which is easier to implement (see Section III for details). [19] voice concerns with regard to stop w ord lists in vectorizing text data (controv ersial words, in- compatible tokenization rules, incompleteness). Additionally , the contextuality of stop word lists are a 6 problem which is not elaborated in depth by these authors: If the context of a set of documents is given, certain words are likely to lose discriminatory potential, although they would not qualify as stop words in a more general context. W e decided to extend an existing stop word list (see Section III for details), to take advantage of the context of data. I I I . D A TA H A N D L I N G A. Data Retrieval The training and ev aluation data ha ve been retriev ed from the DataCite index of metadata of research data 4 via O AI-PMH. 5 DataCite is a service provider that aggreg ated research data ov er more than 1,100 publishers and 750 institutions in 2017 [23]. In September 2019 more than 18.75 million metadata records for research data were a v ailable on DataCite’ s inde x. DataCite is also the name of a metadata schema [8]. All metadata av ailable via O AI-PMH comply to one of the versions of this scheme. The retriev ed data include metadata from June 2011 to May 2019. W e used a customized GeRDI- Harvester 6 to retriev e the metadata in DataCite format and to filter out any non-qualified records; a qualified record is understood as a metadata record with at least one subject field that is qualified either with an URI to a scheme (schemeURI attribute) or a name for a scheme (subjectScheme attribute). In sum, 2,476,959 metadata records are the input of the cleaning step (see following paragraph). The data retrie v al took place in May 2019. The total number of items in the index at this time was approximately 16 million records. 7 Ideas to selectiv ely include additional sources for underrepresented disciplines of research were dis- carded, since these would bias the data to metadata labeled with only one label: all data sources specific to a certain discipline, did not support multi-labeling. B. Data Cleaning 1) A Common Classification Sc heme: Six classification schemes for disciplines of research are fre- quently used throughout the retrie ved metadata, our method supports fiv e of them (cp. T able I). The scheme missing from the table is linsearch, which is a classification scheme that is deri ved from automatic 4 https://datacite.org 5 http://www .openarchiv es.org/O AI/openarchiv esprotocol.html 6 Generic Research Data Infrastructure, https://www .gerdi- project.de 7 The exact number is not av ailable due to the length of the time span the harvesting process took, in which ingests to and deprovisionings from the DataCite index took place. 7 T ABLE I S U P P ORT E D C L A S S I FI C A T I O N S C H E ME S Name Records (after cleaning) Australian and New Zealand Standard Research Classification (ANZSRC) 374,472 De wey Decimal Classification 212,352 Digital Commons Three-T iered T axonomy of Academic Disciplines 11,674 Basisklassifikation 7,032 Narcis Classification Scheme 4,015 Note: n = 609,524; a record can be qualified by more than one scheme classification (see [30],[2]). W e decided to exclude all instances of metadata which we could identify as automatically labeled to a v oid amplifier ef fects; data sets which were classified by machine learning algorithms are necessarily biased towards the algorithm used and what a machine can classify in general. In the course of cleaning the data , a common classification scheme was defined (see T able II), which closely resembles the most common scheme, the Australian and New Zealand Standard Research Classification (ANZSRC). T wo pairs of classes were merged in order to map the other classification scheme to the common classification scheme: • ”Earth Sciences” and ”En vironmental Sciences” are divisions 04 and 05 resp. of the ANZSRC classification scheme and became ”Earth and En vironmental Sciences” in the common classification scheme. • ”Engineering” and ”T echnology” are di visions 09 and 10 resp. of the ANZSRC classification scheme and became ”Engineering and T echnology” in the common classification scheme. These merges enabled a mapping from the other classification schemes to ANZSRC without arbitrary splits or losing records due to miss-matches of the schemes. The resulting classification scheme has been flattened (projection to the base classes) and has therefore no hierarchy . The e xact mappings of the schemes to the common classification scheme is av ailable for analysis and improv ement (cp. Paragraph VII-B3). 2) Cleaning Pr ocedur e: The data were cleaned along this procedure: 1) Mapping from the supported schemes (T able I) to one or more disciplines of research according to the classification scheme of this paper (T able II); after this step 1,233,427 records remained, 1,243,532 records were filtered out as ”not annotatable”, i.e. there was no mapping to a discipline of research av ailable. T ypical reasons for a missing mapping include unclear identification of the source scheme and different domain of the scheme (meaning it does not classify discipline(s) of research). 8 T ABLE II B A S E C L A S S E S A N D O C C U RR E N C E S I N T H E D A TA S E T Class 1 label 2 labels 3+ labels best total % ∅ #labels ∅ wc wc (med.) Mathematical Sciences 9,144 13,635 23,719 45,925 46,498 7.63 2.55 111 59 Physical Sciences 130,593 8,556 13,420 130,593 152,569 25.03 1.27 50 22 Chemical Sciences 16,349 27,090 37,958 57,086 81,397 13.35 2.44 141 105 Earth and Environmental Sciences 13,369 24,754 35,355 57,075 73,478 12.05 2.48 144 97 Biological Sciences 67,884 88,169 71,194 86,325 227,247 37.28 2.11 124 66 Agricultural and V eterinary Sciences 1,876 892 431 3,164 3,199 0.52 1.63 141 76 Information and Computing Sciences 27,723 15,159 27,091 51,472 69,973 11.48 2.17 115 74 Engineering and T echnology 25,104 6,449 2,202 29,850 33,755 5.54 1.35 165 146 Medical and Health Sciences 68,121 46,737 42,678 86,325 157,536 25.85 1.93 134 77 Built En vironment and Design 1,800 1,108 360 3,183 3,268 0.54 1.61 147 86 Education 2,499 1,341 1,262 4,913 5,102 0.84 1.91 124 99 Economics 5,211 1,238 1,119 6,644 7,568 1.24 1.62 151 133 Commerce, Management, T ourism and Services 5,128 1,123 498 6,217 6,749 1.11 1.36 132 116 Studies in Human Society 6,726 4,203 1,294 9,303 12,223 2.01 1.65 137 129 Psychology and Cognitive Sciences 11,458 4,744 1,812 15,400 18,014 2.96 1.52 138 138 Law and Legal Studies 1,048 185 146 1,338 1,379 0.23 1.42 174 155 Studies in Creative Arts and Writing 1,118 290 326 1,519 1,734 0.28 1.58 142 106 Language, Communication and Culture 4,482 979 613 5,442 6,074 1.00 1.41 117 88 History and Archaeology 5,703 645 284 6,166 6,632 1.09 1.19 55 32 Philosophy and Religious Studies 473 731 394 1,584 1,598 0.26 2.02 124 111 total 405,809 124,014 79,701 - 609,524 100.00 1.50 113 58 Note: 2,3,4+ labels do not sum to their total; total/total is the sum of these totals. Fig. 1. Concatenation of the payload parts 2) Filter out duplicates; after this step 716,180 records remained, 517,247 records were filtered out as duplicates. 3) Creation and v alidation of the payload; the payload consists of one ore more titles, zero or more abstracts/descriptions and a subset of the subjects of the research data. This subset consists of all subject tags which hav e not been used for the mapping to the target classification scheme and can be empty . The order of concatenation is depicted in Figure 1. Only those parts are concatenated with each other which consists mostly of English words. 8 If the resulting concatenated string is less than 10 words (separated by white space), it was discarded. After this step 609,524 records remained, 106,656 were filtered out as not fitting for the purpose. T able II provides some statistics for the resulting data set: • 1/2/3+ label(s) : all metadata records with exactly one, two, and three or more labels 8 W e used a python port of the langdetect library [26] to determine the language of the fields: https://pypi.org/project/langdetect 9 • best : all metadata records for which this discipline of research is the best label for stratification (see belo w) • total : all metadata records labeled with this discipline of research (the sum of all these values is bigger than the number of clean records, since a record can hav e more than one label) • % : percentage of metadata records labeled as this discipline of research, rounded to two decimal positions. • ∅ #labels : arithmetical mean of the number of labels per record with that label (rounded to two decimal digits) . • ∅ wc : arithmetical mean of the number of words per record with that label (rounded to an integer). • wc (med.) : median of the number of words per record with that label. The distribution of the different disciplines of research is imbalanced, which is in accordance with the findings in the literature [30], [11], [21], [15]. The imbalance of labels necessitates additional thought on the selection of e v aluation metrics in Section V and on the configuration of the different models. Payloads labeled as ”Physical Sciences” and ”History and Archaeology” are notew orthy outliers, since they hav e fe wer words compared to records from other disciplines of research. The av erage number of labels is highest in ”Mathematical Sciences”, since statistics is part of this category , which is a field that is intertwined with disciplines using quantitativ e methods. W ith one exception all disciplines hav e a distribution of word counts that is ske wed to shorter payloads (median ¡ mean), meaning that there are length-wise outliers. Psychology sho ws the same mean as median. The label cardinality (av erage number of labels per record) is 1.5, the label density (av erage proportion of labels per record) is 0.08. 9 The data set includes 961 dif ferent labelsets this number is relati vely small compared to the 20 20 theoretically possible labelsets. 179 labelsets occur only once which makes a stratified split along the 961 labelsets impossible. T o enable stratified splitting we follo wed a ”best-label” approach: 1) All records with only one label are assigned that label. 2) Iterating o ver the remaining records, the ”best” label out of the labelset is selected, which is the label which is selected the least often at the current state of the loop. These best labels are used in stratified sampling and feature selection (see following paragraph), but not as labels for the training itself. 9 see [29] for a formal definition 10 I V . V E C T O R I Z A T I O N A N D M O D E L S E L E C T I O N The general idea is to ev aluate three dif ferent classes of combinations for the use cases presented in Section I: 1) Classic machine learning models combined with bag of words vectorization; Approaches which hav e already been ev aluated (linear models) or which do not support multi-label classification nati vely hav e been excluded. 2) Classic deep learning models (multi-layer perceptrons), combined with bag of words vectorization 3) A model used in contemporary Natural Language Processing, the Long Short T erm Memory (LSTM) model, combined with word embedding vectorization. This section first describes the two vectorization approaches; the second part presents the machine learning models, which are the e v aluation candidates of Section VI. A. V ectorization Before the vectorization, the data are split into a training (548,571 records) and an ev aluation set (60,953 records) with a ratio of 9:1. The split is stratified, i.e. the distribution of the best labels in test and training set is approximately identical. For the deep learning models the training set is again split by the same approach (493,713 training and 54,858 validation records). Both vectorization methods operate on the same splits to gain comparable results. The split and the vectorization is ex ecuted three times, for a small (s), medium (m) and large (l) vectorized representation of the payloads; the definition of the sizes will be gi ven in the following paragraphs. 1) Bag of W or ds (BoW): One way to vectorize the corpus of all documents, i.e. all payloads of the metadata records, is the ”Bag of n-grams”-approach, i.e. each document is treated as a row in a matrix in which the columns are the terms (1-grams and 2-grams). Some terms were filtered out by a stop word list. A stop word list is designed to filter out non-informati ve parts of the documents. W e chose to create our own stop word list (with 240 entries, see Section II for a rationale). The list of stop words includes: • words that are generally considered unspecific (e.g. ”the”, ”a”, ”is”) 10 • numbers and numerals ≤ 10 • words that are unspecific in the context of data (e.g. ”kb”, ”file”, ”metadata”, ”data”) • words that are unspecific in the academic context (e.g. ”research”, ”publication”, ”finding”) 10 These stop words are a subset of the English stop words list of the nltk software package [5] 11 For each term t in a document, that is for each cell of the matrix of documents and terms, the term frequency-in verted document frequency (tf-idf) was calculated using the default settings of scikit-learn [20] (except for the stop word list). The vectorization resulted in 4,096,093 possible features. The best features were selected in three modes: • s : 1000 features per label, 20,000 features in total • m : 2500 features per label, 50,000 features in total • l : 5000 features per label, 100,000 features in total The selection is based on an ANalysis Of V Ariance (ANO V A) of the features [9]. This allows to identify the features which are best suited to discriminate between the classes. This is the second and last time that the best labels were used. 2) W ord embeddings: Another approach for vectorization is using word representations, like word2vec [17]. Such an approach can utilize either continuous bag-of-words (CBO W) [18] or continuous skip-gram [17]. The CBO W model predicts the current word from a window spanning over context words. The skip-gram model uses the current word to predict the context surrounding the word. In our work we used pre-trained word2vec embeddings 11 which were trained on the Google News data set (about 100 billion words). The embeddings were trained with the CBO W approach and consist of 300-dimensional word vectors representing three million words. Compared to BoW , word embeddings provide a lo w dimensional feature space and encode semantic relationship among words. T o apply the vectorization method, each document needs to be tokenized: • s : up to 500 words of the document are tokenized • m : up to 1,000 words of the document are tokenized • l : up to 2,000 words of the document are tokenized B. Multi-label Models 1) Classic Machine Learning Models: • DecisionT r eeClassifier [7]: This classifier uses a decision tree to find the best-suited classes for each record. The nodes of the tree are used to split the records into tw o sets based on a feature, ev entually resulting in a leaf which ideally represents a certain class or a certain labelset. The training consists in finding the best features to split the data set. Multi-label classification of unseen data works by 11 https://code.google.com/archiv e/p/word2vec/ 12 follo wing the decision path until a leaf is reached. All labels which are present in the majority of the data items in the leaf are returned as the classification result. • RandomF or estClassifier [6]: This classifier is based on the DecisionT reeClassifier , by b uilding an ensemble of multiple decision trees. The general idea is that a bias that trees typically hav e by ov erfitting a training set, is remedied by building multiple decision trees based on dif ferent random subsets of the features. In ideal cases the bias in dif ferent directions corresponds to dif ferent aspects of the data. The training consists in fitting n trees by using a random subset of features and a random subset of the training set. The classification is then achiev ed by a voting procedure among the trees in the ensemble. • ExtraT r eesClassifier [10]: This classifier is similar to the RandomForestClassifier: both are ensembles of trees, but this classifier is based on the ExtraTreeClassifier (note the missing ”s”) which introduces more randomness by selecting the feature to split by totally at random. (DecisionTreeClassifiers in random forests by contrast select the best feature out of a subset sampled at random). 2) Multi-Layer P er ceptr on: A Multi-Layer Perceptron (MLP) [24] is a neural network and consists of one input layer , one output layer and n intermediate layers of perceptrons. The input layer corresponds to the vectorized data (e.g. a vector of 20,000 values in the s-sized BoW approach) the output layer has the shape of the labels (i.e. a vector with 20 elements). Backpropag ation is used to train the the model for the gi ven data; we used the Adam optimizer for this task [14]. By using a sigmoid function as the acti v ation function of the output layer , the MLP can predict the probability for multiple labels (multi-label). 3) Recurr ent Network: Recurrent networks form a class of neural networks which are used to process sequential data of different length. This design furthermore allo ws it to make use of temporal dynamic behavior , e.g. recurrences of terms in a text. The recurrent network architecture we use in our work is an Bidirection Long Short-T erm Memory (BiLSTM) [12] model. W e use word2v ec [17] embeddings as described in Section IV -A2 as input to the model. 12 The embeddings are frozen and not further trained in the classification process. On top of the BiLSTM layer we use a dense layer with a sigmoid activ ation function to classify multi-labels. The BiLSTM layer and the dense layer get trained by an Adam optimizer [14]. 4) W eights and Hyper-par ameter T uning: An important parameter in the training of multi-label clas- sification problems based on imbalanced training sets is the weight giv en to each label. All classes of 12 Any other kind of word embeddings can be used too 13 algorithms we used allo w to put more weight to underrepresented labels. W e calculated the weights based on the label frequencies found in the training set: weight(label) = 1 frequencies(label ) max(frequencies) For each model we ex ecuted semi-automated parameter tuning, follo wing this procedure: 1) List selected hyper -parameters in the order of expected impact to the ev aluation metrics. 2) For each hyper -parameter or combination thereof, execute a grid search to find the best candidate(s). 3) Fix the selected parameters and repeat step 2 with the next parameter or parameter combination. The space of possible solutions is too big to be e xhausti vely searched with reasonable ef ficiency , so it might be, that a dif ferent combination of hyper -parameters improve the scores reported by us. V . E V A L UA T I O N P R O C E D U R E For each use case (cp. Section I) an ev aluation metric has been identified that takes the imbalance of the label distribution into account, as stated in Section III. The use cases differ in the weight they put on recall and precision. Recall for label l is the ratio between true positi ves and positi ves for label l (sum of true positi ves and false negati ves for l ). Precision for label l is the ratio between true positi ves and predicted positi ves (sum of true positiv es and false positiv es for l ). 13 These values alone are easy to game, which is why they should be combined: The f β -score puts them in a relation to each other that allo ws to modify the weight we put to precision and recall respecti vely: f β = (1 + β 2 ) · precision · recall β 2 · precision + recall The v alue of β controls the weight put to recall and precision: • If β < 1 , precision is highlighted; a value of 0.5 has been chosen for the ”scientometric research” use case. • If β > 1 , recall is highlighted; a v alue of 2 has been chosen for the ”assistant system” use case. • If β = 1 , precision and recall are treated equally; this is chosen for the ”v alue-adding services” use case. Precision and recall is calculated for each label, and the arithmetical mean over all labels is taken as the input for the calculation of the f β -score. This macr o -av erage approach takes the imbalance of the 13 formal definitions can be found in [28] 14 base classes (and therefore of the labels) into account. It can be interpreted as the chance of a correct classification when a stratified sample is drawn. This is the basis for the ev aluation of the approaches for the presented use cases. The micr o -a verage approach averages the v alues o ver all data sets, without the intermediate aggregation ov er the labels. It can be interpreted as the chance of a correct classification when a completely random sample is drawn. In imbalanced scenarios, micro-scores tend to be skewed to the predominant labels; since these often perform better (more training data), micro-scores are often too optimistic, when the performance of the model with reg ard to all labels is the tar get. Although micro-av erages are not used in this paper to e v aluate the models, we nevertheless report them for the sake of comparability . W e refrain from reporting accuracy (ratio of the sum of true positiv es and true negati ves for label l to the size of the e v aluation set), since it is biased tow ards neg ati ve classifications which in our case are much more frequent than positi ve classifications. The final e v aluation is based on the f β -macro-scores calculated on all three e v aluation sets. This way each model is tested against the same unseen set of data. (see Section III). V I . R E S U LT S A. Model P erformance T ABLE III B E S T M O D E L P E R F O R M A N C E S ( AG G R E G AT E D ) Model Size f 0 . 5 (macro) f 0 . 5 (micro) f 1 (macro) f 1 (micro) f 2 (macro) f 2 (micro) LSTMClassifier s 0.788 0.846 0.737 0.826 0.695 0.808 LSTMClassifier m 0.791 0.854 0.755 0.839 0.723 0.826 LSTMClassifier l 0.772 0.832 0.717 0.809 0.671 0.787 MLPClassifier s 0.784 0.841 0.747 0.833 0.719 0.828 MLPClassifier m 0.795 0.854 0.754 0.841 0.720 0.829 MLPClassifier l 0.809 0.858 0.760 0.847 0.729 0.842 RandomForestClassifier s 0.632 0.779 0.463 0.667 0.378 0.584 RandomForestClassifier m 0.551 0.727 0.405 0.599 0.333 0.510 RandomForestClassifier l 0.532 0.716 0.382 0.577 0.311 0.483 DecisionT reeClassifier s 0.296 0.507 0.321 0.524 0.369 0.543 DecisionT reeClassifier m 0.281 0.489 0.303 0.506 0.351 0.527 DecisionT reeClassifier l 0.276 0.483 0.297 0.499 0.344 0.516 ExtraT reesClassifier s 0.504 0.699 0.359 0.545 0.291 0.447 ExtraT reesClassifier m 0.468 0.681 0.327 0.513 0.263 0.411 ExtraT reesClassifier l 0.451 0.667 0.310 0.491 0.246 0.388 For all three use cases the MLPClassifier trained on the l-sized data was the best performing model according to our tests (cp. T able III). LSTM models trained on the m-sized data were almost as well- 15 performing, but took essentially longer to train than the MLP models. The slight lead of the MLPClassifier might be explained by the amount of short payloads in the data set: the median word count (58 words) is left of the mean (112.78 words), and 26 words is the value of the 25th percentile (25 % of the records were at most 26 words long, with 10 words being the minimum). Many of the records’ payloads might be too short for the LSTM model to play out its ability to detect semantic relationships be yond the statistical approach used by the MLP based on BoW . The results of tree models are out-of-reach of the results achieved by the deep learning models. T rees and Ensembles perform best on s-sized data and with the exception of simple DecisionT reeClassifiers, all models performed better in terms of precision than in recall ( f 0 . 5 scores are greater than f 2 scores). B. P erformance by Discipline T ABLE IV F - S C O R E S F O R E A C H D I S C I P L I N E O F R E S E A R C H ( B E S T M L P - L / L S T M - M - M O D E L ) Model f 0 . 5 -MLP f 1 -MLP f 2 -MLP f 0 . 5 -LSTM f 1 -LSTM f 2 -LSTM Mathematical Sciences 0.79 0.76 0.74 0.77 0.74 0.71 Physical Sciences 0.96 0.95 0.94 0.95 0.94 0.92 Chemical Sciences 0.83 0.82 0.81 0.81 0.81 0.81 Earth and En vironmental Sciences 0.79 0.78 0.76 0.81 0.78 0.74 Biological Sciences 0.88 0.89 0.89 0.88 0.88 0.89 Agricultural and V eterinary Sciences 0.70 0.58 0.50 0.68 0.60 0.54 Information and Computing Sciences 0.82 0.81 0.79 0.81 0.79 0.77 Engineering and T echnology 0.80 0.77 0.76 0.78 0.76 0.74 Medical and Health Sciences 0.83 0.83 0.81 0.85 0.83 0.82 Built En vironment and Design 0.75 0.64 0.58 0.71 0.63 0.57 Education 0.78 0.73 0.69 0.74 0.70 0.67 Economics 0.74 0.69 0.64 0.75 0.70 0.65 Commerce, Management, T ourism and Services 0.71 0.66 0.61 0.72 0.67 0.63 Studies in Human Society 0.77 0.73 0.70 0.76 0.74 0.71 Psychology and Cognitiv e Sciences 0.84 0.82 0.81 0.84 0.82 0.80 Law and Le gal Studies 0.81 0.72 0.66 0.83 0.77 0.73 Studies in Creativ e Arts and Writing 0.84 0.75 0.69 0.71 0.65 0.60 Language, Communication and Culture 0.80 0.73 0.72 0.78 0.75 0.72 History and Archaeology 0.93 0.88 0.87 0.90 0.87 0.84 Philosophy and Religious Studies 0.82 0.68 0.60 0.75 0.68 0.61 Note: f 1 -MLP and f 2 -MLP are from the same model, as are all LSTM scores T able IV lists the un-aggre gated scores for each discipline of research. The f 0 . 5 score correlates positiv ely with the amount of records (total in T able II): 0.518 (Pearson correlation). None of the disciplines of research with more than 10,000 labeled payloads scored a smaller f 0 . 5 v alue than 0.79, while on the other side of the scale (less than 5,000 labeled payloads) no comparable tendency could be detected. 16 The LSTMClassifier scores slightly better or comparable to the MLPClassifier in disciplines of research often clustered as ”life sciences”, while it performs clearly worse in comparison to the MLPClassifier in the humanities. C. Use Cases 1) Scientometric Resear ch: The results for this use case sho w the best scores compared to the other use cases. The MLPClassifier is the best-performing model. On the basis of the scores, confidence considerations can be implemented, which allow to quantify the expected error in the classification task. The MLPClassifier can be expected to perform best, if the task at hand is specific to a certain discipline (e.g. singling-out Physics). 2) Assistant Systems: W ith the exception of ”Biological Sciences”, all un-aggregated values for the f 2 -scores are smaller than the f 0 . 5 -scores. Analyzing the un-aggregated scores by discipline of research, some drop more than others. One of the common features of those disciplines is their relativ ely low number of total payloads. The Pearson correlation between the total number of payloads per label and the corresponding f β -scores, gets stronger , the more weight is laid on recall: • f 0 . 5 0.518 • f 1 0.695 • f 2 0.698 The ef fect of the imbalance of the training and ev aluation set is therefore smaller on precision as it is on recall. Assistant systems based on the proposed models are possible, although their acceptance by users seems doubtful, if they fail to suggest obvious labels. 3) V alue-adding Services: Unsurprisingly , the f 1 -scores of the best models lie between their neighboring extremes, but slightly closer to the f 2 -scores than to the f 0 . 5 -scores. This is due to the f act that the f 1 -score is the harmonic mean between recall and precision, which tends to stress the lower values. Analogous to the previous use case, value-adding services based on the proposed model should be tested by interaction studies whether users accept their performance. V I I . D I S C U S S I O N A. Discipline-r elated Differ ences There are disciplines of research which are in general easier for the models to detect, namely ”Ph ysical Sciences” and ”History and Archaeology” which are also the disciplines of research with shorter payloads 17 (word-wise). An approach to deriv e a general rule from these dif ferences is to look for correlations with other v ariables of the data set: • number of words per payload: All f β -scores correlate negati vely with the median number of words per payload (Pearson correlation): -0.51 ( f 0 . 5 ) -0.474 ( f 1 ) -0.446 ( f 2 ). These numbers indicate that the usage of a concise vocab ulary in the metadata improv es the chance to be classified correctly . In the BoW -approach, disciplines of research with a smaller vocab ulary ha ve a better relati ve representation in the set of terms finally selected. W ith regard to the LSTM/embedding approach, a possible explanation for the correlation is that shorter text are easier to ”digest” for the model, meaning that further textual content does not improve the performance if it does not contain an equiv alent semantic surplus. • number of labels per payload: The Pearson correlation between the mean number of labels and the f β -scores is rather weak, and varies in direction: -0.093 ( f 0 . 5 ) 0.068 ( f 1 ) 0.083 ( f 2 ). The number of labels is therefore no explanation for the performance in general, at least not from the aggreg ated perspecti ve, though it is a possible explanation for the outliers: 14 In those two cases the amount of shared payloads with other labels is small and coincides with a semantic distinction. B. Discussion of Miss-Classifications This section discusses e xplanations of the reported miss-classifications and presents strategies to mitigate the identified problems or improve the performance by trying out other approaches than presented in this paper . The follo wing paragraphs focus on dif ferent aspects of the presented approach: • data processing. • vectorizing approaches. • model and/or hyper -parameter selection. Each of the follo wing paragraphs focus on one aspect. While we discuss some possible limitations of our approach for the first two aspects, the third part is dif ferent. As already stated, the solution space (models + hyper-parameter combinations) is too v ast to be exhausti vely searched. W e therefore content ourselves with hints, on how to methodically supersede our results. This last activity is similar to reproducing our results. 14 The same applies to the ratio of 1-labeled payloads to total payloads a verage number of labels (Pearson correlation): 0.117 ( f 0 . 5 ) -0.01 ( f 1 ) -0.023 ( f 2 ). 18 1) Data Issues: There are tw o promising e xplanations for miss-classifications based on a critical revie w of the training/e v aluation set: • Some payloads may be labeled wrong, which means that in such a case the model performs better than the person who originally labeled the research data item. There are structural explanations av ailable for this assumption that go beyond simple classification errors: Some repositories might only allow or encourage one discipline per data set or data sets are not curated ov er time (e.g. by adding disciplines after submission). Unfortunately , there is no approach kno wn to us to automate a procedure to identify and correct such types of miss-classifications other than manual checks: – Ordering of all false positiv es by the probability the model assigns to the miss-classified labels in decreasing order: The higher the probability , the more likely is the model’ s classification correct. – Manual relabeling of the data item if the machine’ s classification seems warranted. • Some payloads could be of insuf ficient quality for both model and human expert to unambiguously classify the research data item. This means that the model would be ”justified” in a false negati ve, since the payload in question would be too short and/or too unspecific. As with the pre vious idea, there is only a manual approach kno wn to us, to detect and handle such cases: – Ordering of all false ne gati ves by the probability the model assigns to the miss-classification and number of words (both in increasing order): The lo wer the probability and shorter the payload, the more likely is the model’ s classification warranted. – Manual assessment of the payload (does it contain enough information to make a sound clas- sification decision?) If the payload is not found to be sufficient for a classification, it can be ignored by future training runs. Both these approaches focus on the quality of the training/ev aluation data, whereas another idea is to enlarge these data by using additional sources, such as the Bielefeld Academic Search Engine (B ASE) 15 or Crossref 16 All three approaches lead to a newer version of the training and ev aluation data set, which necessitates a re-training of the models to assess the improv ements by the baseline presented in this paper . 2) V ectorization Issues: • BoW : The large number of input features for the best performing model (100,000) slows do wn prediction and increases the size of the model. Aside from these rather technical issues, 3,996,093 15 https://base- search.net 16 https://crossref.org 19 features are not exploited to increase the performance of the models. With dimension-reduction mechanisms such as Principal Component Analysis (PCA), these unused information might be exploited to further reduce the miss-classifications, while the dimension of the input layer of the network is reduced at the same time (with beneficial consequences for the prediction latency and model size). Another approach is to test what impact the selection of another list of stop words would hav e. • Embeddings : Using another embedding data set to vectorize the payloads might allow reduce the number of miss-classifications, if these embeddings were trained on a context closer to scientific communication than the used Google Ne ws data set. Another approach is to train the embeddings from scratch or update an existing embedding model during the classification process. 3) Notes on Repr oducibility: The presented procedure to retrieve, clean, and vectorize the data, and e v aluate different machine learning models on the results is based on se veral assumptions, which were moti v ated in this paper . In general, the solution space is so vast, that it is currently unreasonable to check e very hyper -parameter combination or promising learning algorithm considering the resources necessary . Besides the explanation for the choices we gav e in this paper , we follo wed an approach that allows to retrace each step taken, so dif ferent configurations and hyper -parameters can be tested. Nev ertheless, to guarantee comparability , it is crucial to keep those parts of the data processing and the learning pipeline fixed, which do not di verge from our approach. T o ease such a procedure, the data, source code and all configurations, are made publicly av ailable: • Raw retriev ed data: [34] • Cleaned and vectorized training and ev aluation data – small: [35] – medium: [33] – large: [32] • Source code with sub-modules for the steps presented in this paper , [36], with the following com- ponents: – code/retrie ve, corresponding to Subsection III-A – code/clean, corresponding to Subsection III-B – code/vectorize, corresponding to Subsection IV -A – code/e v aluate, corresponding to Section V 20 – config, all configurations, including the stop word list • Statistical data for this paper and e v aluation data of all training ev aluation runs: [37] C. Thr eats to V alidity The decision for a classification scheme is necessarily a political statement. How borders between disciplines are drawn, which research activities are aggregated under a label, and which disciplines are considered to be ”neighbors”, should be open to reflection and debate. The selection of the common classification scheme for this paper , was steered by technical reasoning to minimize the effort while maximizing the classifiers’ performance (see Section III). The methodological approach and therefore the code, allows to use another classification scheme, if mappings are provided from the found schemes to this alternati ve target scheme. Another potentially arbitrary feature of the presented approach lies both in the subject classifications found in the raw data and in the process to streamline them during the cleaning step. DataCite aggregates ov er many sources and therefore over many curators and scientist who make the first type of decision; [23] reports that 762 world-wide organizations were included as data centers in the DataCite index in April 2016. This bandwidth hopefully leads to a situation where prejudice and error is averaged out. Even if some cultural and socialized patterns in classification remain and some classification schemes are more prominent than others (ANZSRC, DDC), this approach is to our knowledge the best av ailable. By filtering out metadata which were clearly classified by other automatic means (e.g. the linsearch classification scheme), we hope to minimize an amplifier ef fect (models trained on data classified by other models). W e managed the second type of arbitrariness (mapping the found labels to a common scheme), by making each of the 609,524 mapping decisions transparent and reproducible, so that possibly existing biases and uncatched mistakes are corrigible. V I I I . C O N C L U S I O N & O U T L O O K In this paper a report is gi ven ho w training and e valuation metadata describing research data are retrie ved, cleaned, labeled and vectorized, in order to test the best machine learning model to classify the metadata by the discipline of research of the research data. Since this is a multi-label problem, both training and e v aluation procedure must be aligned with technical best practices, such as stratified sampling or using macro-av eraged scores. 21 MLP models and LSTM models perform well enough for usage in the context of scientometric research, while the usage of the ev aluated models in assistant systems and value-adding services of research data pro viders should only be considered after user interaction studies. Ideas for improv ement of the performance are mostly targeted at the training and ev aluation data. Ideas for scientometric application of the models on data sources such as DataCite and B ASE include but are not limited to: • Is research becoming more or less interdisciplinary? This question can be answered by using the automated classifiers on large time-indexed data sets (such as DataCite, which includes the year of publication as a mandatory field). The classified data sets will display a trend, whether the number of labels increase, decrease or stay stable. • Ho w does each discipline contribute to the growth of research data? This question can be answered by analyzing data sources such as DataCite or B ASE, after their contents hav e been classified by the presented models. This paper provides the mean to quantify the expected error in such in vestigations, based on the reported f β -scores. It is furthermore an open question ho w models honoring the hierarchical nature of most classification schemes could be trained and implemented at scale for the use cases at hand. A U T H O R S ’ C O N T R I B U T I O N This section follo ws the Contrib utor Roles T axonomy (CRediT). T obias W eber: • Conceptualization • Data curation • Formal analysis • In vestigation • Methodology • Software • V isualization • Writing - original draft • Writing - re vie w & editing 22 Dieter Kranzlm ¨ uller: • Funding acquisition • Resources • Supervision Michael Fromm: • Methodology • V alidation • Writing - re vie w & editing Nelson T av ares de Sousa: • Conceptualization • Writing - re vie w & editing A C K N O W L E D G M E N T S This work was supported by the DFG (German Research Foundation) with the GeRDI project (Grants No. BO818/16-1 and HA2038/6-1). This work has also been funded by the DFG within the project Relational Machine Learning for Argument V alidation (ReMLA V), Grant Number SE 1039/10-1, as part of the Priority Program ”Robust Argumentation Machines (RA TIO)” (SPP-1999). W e, as the authors of this work, take full responsibilities for its content; ne vertheless, we w ant to thank the LRZ Compute Cloud team for pro viding the resources to run our e xperiments, Martin Fenner from the DataCite-team for comments on an early draft of this paper, the staff at the library of the Ludwig- Maximilians-Uni versit ¨ at M ¨ unchen (esp. Martin Spenger), for support in questions related to the library sciences, and the Munich Network Management T eam for comments and suggestions on the ideas of this paper . C O M P E T I N G I N T E R E S T The authors hav e no competing interests to report. R E F E R E N C E S [1] Mart ´ ın Abadi et al. T ensorFlow: Larg e-Scale Machine Learning on Heter ogeneous Systems . Soft- ware av ailable from tensorflow .org. 2015. U R L : https://static.googleusercontent.com/media/research. google.com/en//pubs/archi ve/45166.pdf. 23 [2] Thomas B ¨ ahr, T ib Hannov er , and K erstin Denecke. LINSear ch -Linguistisc hes Inde xier en und Suchen Chancen und Risiken im Gr enzber eich zwischen intellektueller Erschließung und automa- tisch gesteuerter Klassifikation . T ech. rep. TIB Hannover/F orschungszentrum L3S Hannover , Oct. 2008. U R L : https : / / www . researchgate . net / publication / 259938650 LINSearch - Linguistisches Indexieren und Suchen Chancen und Risik en im Grenzbereich zwischen intellektueller Erschliessung und automatisch gesteuerter Klassifikation. [3] Gordon Bell, T on y Hey, and Alex Szalay. “Beyond the Data Deluge”. In: Science 323.5919 (Mar . 2009), pp. 1297–1298. I S S N : 1095-9203. D O I : 10.1126/science.1170411. U R L : http://dx.doi.org/10. 1126/science.1170411. [4] B. Billal et al. “Semi-supervised learning and social media text analysis to wards multi-labeling categorization”. In: 2017 IEEE International Confer ence on Big Data (Big Data) . Dec. 2017, pp. 1907–1916. D O I : 10.1109/BigData.2017.8258136. [5] Ste ven Bird, Ewan Klein, and Edward Loper. Natural language pr ocessing with Python: analyzing text with the natural languag e toolkit . 1005 Gravenstein Highway North, Sebastopol, CA 95472, USA: O’Reilly Media, Inc., 2009. [6] Leo Breiman. “Random Forests”. In: Machine Learning 45.1 (Oct. 2001), pp. 5–32. I S S N : 1573- 0565. D O I : 10.1023/A:1010933404324. U R L : https://doi.org/10.1023/A:1010933404324. [7] Leo Breiman et al. Classification and r e gr ession trees . Ed. by Leo Breiman. The W adsw orth statis- tics, probability series. Belmont, Calif. ; Belmont, Calif.: W adsworth Internat. Group ; W adsw orth Internat. Group, 1984. I S B N : 0534980538 - 0534980546. [8] DataCite Metadata W orking Group. DataCite Metadata Schema for the Publication and Citation of Resear ch Data. V ersion 4.3 . T ech. rep. DataCite e.V ., 2019. D O I : 10.14454/f2wp- s162. [9] Ronald A ylmer Fisher. Statistical methods for r esear ch workers . New Y ork, NY: Hafner, 1973. [10] Pierre Geurts, Damien Ernst, and Louis W ehenkel. “Extremely randomized trees”. In: Machine Learning 63.1 (Apr . 2006), pp. 3–42. I S S N : 1573-0565. D O I : 10 . 1007 / s10994 - 006 - 6226 - 1. U R L : https://doi.org/10.1007/s10994- 006- 6226- 1. [11] K oraljka Golub, Johan Hagelb ¨ ack, and Anders Ard ¨ o. “Automatic classification using DDC on the Swedish union catalogue”. eng. In: CEUR W orkshop Pr oceedings . V ol. 2200. Porto, Portugal: CEUR, 2018, pp. 4–16. 24 [12] Sepp Hochreiter and J ¨ urgen Schmidhuber. “Long Short-T erm Memory”. In: Neural Comput. 9.8 (Nov . 1997), pp. 1735–1780. I S S N : 0899-7667. D O I : 10 . 1162 / neco . 1997 . 9 . 8 . 1735. U R L : http : //dx.doi.org/10.1162/neco.1997.9.8.1735. [13] Arash Joorabchi and Abdulhussain E. Mahdi. “An unsupervised approach to automatic classifica- tion of scientific literature utilizing bibliographic metadata”. In: J ournal of Information Science 37.5 (2011), pp. 499–514. D O I : 10 . 1177 / 0165551511417785. eprint: https : / / doi . or g / 10 . 1177 / 0165551511417785. U R L : https://doi.org/10.1177/0165551511417785. [14] Diederik P . Kingma and Jimmy Ba. Adam: A Method for Stochastic Optimization . Published as a conference paper at the 3rd International Conference for Learning Representations, San Diego, 2015. 2014. U R L : http://arxiv .org/abs/1412.6980. [15] Peter Kraker et al. “Research Data Explored II: the Anatomy and Reception of figshare”. English. In: Pr oceedings of the 20th International Confer ence on Science and T echnolo gy Indicators (STI 2015) . 2015. [16] Mathias L ¨ osch et al. “Building a DDC-annotated Corpus from O AI Metadata”. In: J ournal of Digital Information 12.2 (2011). [17] T omas Mikolov et al. “Distributed Representations of W ords and Phrases and their Composition- ality”. In: Advances in Neural Information Pr ocessing Systems 26 . Ed. by C. J. C. Burges et al. Curran Associates, Inc., 2013, pp. 3111–3119. U R L : http : / / papers . nips . cc / paper / 5021 - distributed - representations- of- words- and- phrases- and- their- compositionality .pdf. [18] T omas Mikolo v et al. Efficient Estimation of W or d Repr esentations in V ector Space . 2013. U R L : http://arxi v .or g/abs/1301.3781. [19] Joel Nothman, Hanmin Qin, and Roman Y urchak. “Stop W ord Lists in Free Open-source Software Packages”. In: Pr oceedings of W orkshop for NLP Open Sour ce Softwar e (NLP-OSS) . 2018, pp. 7–12. U R L : https://aclweb .org/anthology/W18- 2502. [20] F . Pedregosa et al. “Scikit-learn: Machine Learning in Python”. In: Journal of Machine Learning Resear ch 12 (2011), pp. 2825–2830. U R L : http : / / www. jmlr . org / papers / volume12 / pedregosa11a / pedregosa11a.pdf. [21] Isabella Peters et al. “Research data explored: an extended analysis of citations and altmetrics”. In: Scientometrics 107.2 (May 2016), pp. 723–744. I S S N : 1588-2861. D O I : 10.1007/s11192- 016- 1887- 4. U R L : https://doi.org/10.1007/s11192- 016- 1887- 4. 25 [22] Isabella Peters et al. “Zenodo in the Spotlight of T raditional and Ne w Metrics”. In: F r ontiers in Resear ch Metrics and Analytics 2 (2017), p. 13. I S S N : 2504-0537. D O I : 10.3389/frma.2017.00013. U R L : https://www .frontiersin.org/article/10.3389/frma.2017.00013. [23] Nicolas Robinson-Garcia et al. “DataCite as a novel bibliometric source: Cov erage, strengths and limitations”. In: J ournal of Informetrics 11.3 (2017), pp. 841–854. I S S N : 1751-1577. D O I : 10.1016/ j.joi.2017.07.003. U R L : http://www .sciencedirect.com/science/article/pii/S1751157717300834. [24] David E Rumelhart, Geoffre y E Hinton, Ronald J W illiams, et al. “Learning representations by back-propagating errors”. In: Cognitive modeling 5.3 (1988), p. 1. [25] K onstantinos Sechidis, Grigorios Tsoumakas, and Ioannis Vlahav as. “On the Stratification of Multi- label Data”. In: Machine Learning and Knowledge Discovery in Databases . Ed. by Dimitrios Gunopulos et al. Berlin, Heidelberg: Springer Berlin Heidelberg, 2011, pp. 145–158. I S B N : 978-3- 642-23808-6. [26] Nakatani Shuyo. Languag e Detection Libr ary for J ava . 2010. U R L : http : / / code . google . com / p / language- detection/. [27] Marina Sokolov a, Nathalie Japko wicz, and Stan Szpako wicz. “Beyond Accuracy , F-Score and ROC: A Family of Discriminant Measures for Performance Evaluation”. In: Lectur e Notes in Computer Science . Springer Berlin Heidelberg, 2006, pp. 1015–1021. D O I : 10.1007/11941439 114. [28] Mohammad S Soro wer. A literatur e surve y on algorithms for multi-label learning . T ech. rep. Ore gon State Uni versity, 2010. [29] Grigorios Tsoumakas and Ioannis Katakis. “Multi-Label Classification: An Overvie w”. In: Inter - national Journal of Data W ar ehousing and Mining 3 (Sept. 2009), pp. 1–13. D O I : 10 .4018 /jdwm. 2007070101. [30] Ulli W altinger et al. “Hierarchical Classification of OAI Metadata Using the DDC T axonomy”. In: Advanced Language T echnologies for Digital Libraries . Ed. by Raf faella Bernardi et al. Berlin, Heidelberg: Springer Berlin Heidelberg, 2011, pp. 29–40. I S B N : 978-3-642-23160-5. [31] Jun W ang. “An extensi ve study on automated Dewe y Decimal Classification”. In: J ournal of the American Society for Information Science and T echnology 60.11 (2009), pp. 2269–2286. D O I : 10 . 1002 / asi . 21147. eprint: https : / / onlinelibrary . wiley . com / doi / pdf / 10 . 1002 / asi . 21147. U R L : https://onlinelibrary .wile y .com/doi/abs/10.1002/asi.21147. 26 [32] T obias W eber. l-sized T r aining and Evaluation Data for Publication ”Using Supervised Learning to Classify Metadata of Resear ch Data by Discipline of Researc h” . Oct. 2019. D O I : 10.5281/zenodo. 3490460. U R L : https://doi.org/10.5281/zenodo.3490460. [33] T obias W eber. m-sized T raining and Evaluation Data for Publication ”Using Supervised Learning to Classify Metadata of Resear ch Data by Discipline of Resear ch” . Oct. 2019. D O I : 10 . 5281 / zenodo.3490458. U R L : https://doi.org/10.5281/zenodo.3490458. [34] T obias W eber. Raw Data for Publication ”Using Supervised Learning to Classify Metadata of Resear ch Data by Discipline of Resear ch” . Oct. 2019. D O I : 10.5281/ zenodo.3490329. U R L : https: //doi.org/10.5281/zenodo.3490329. [35] T obias W eber. s-sized T raining and Evaluation Data for Publication ”Using Supervised Learning to Classify Metadata of Resear ch Data by Discipline of Researc h” . Oct. 2019. D O I : 10.5281/zenodo. 3490396. U R L : https://doi.org/10.5281/zenodo.3490396. [36] T obias W eber and Michael Fromm. Sour ce Code and Configurations for Publication ”Using Su- pervised Learning to Classify Metadata of Resear ch Data by Discipline of Resear ch” . Oct. 2019. D O I : 10.5281/zenodo.3490466. U R L : https://doi.org/10.5281/zenodo.3490466. [37] T obias W eber, Michael Fromm, and Nelson T a vares de Sousa. Statistics and Evaluation Data for Publication ”Using Supervised Learning to Classify Metadata of Resear ch Data by Discipline of Resear ch” . Oct. 2019. D O I : 10 . 5281 / zenodo . 3490468. U R L : https : / / doi . org / 10 . 5281 / zenodo . 3490468. [38] T obias W eber and Dieter Kranzlm ¨ uller. “How F AIR Can you Get? Image Retriev al as a Use Case to Calculate F AIR Metrics”. In: 2018 IEEE 14th International Confer ence on e-Science (e-Science) . Oct. 2018, pp. 114–124. D O I : 10.1109/eScience.2018.00027. [39] Y ongjun Zhang et al. “LF-LDA: A T opic Model for Multi-label Classification”. In: Advances in Internetworking, Data & W eb T echnologies . Ed. by Leonard Barolli, Mingwu Zhang, and Xu An W ang. Cham: Springer International Publishing, 2018, pp. 618–628. I S B N : 978-3-319-59463-7.
Original Paper
Loading high-quality paper...
Comments & Academic Discussion
Loading comments...
Leave a Comment