A method to align time series segments based on envelope features as anchor points
In the time series analysis field, there is not a unique recipe for studying signal similarities. On the other hand, averaging signals of the same nature is an essential tool in the analysis of different kinds of data. Here we propose a method to ali…
Authors: Cecilia Jarne, Pablo N. Alcain
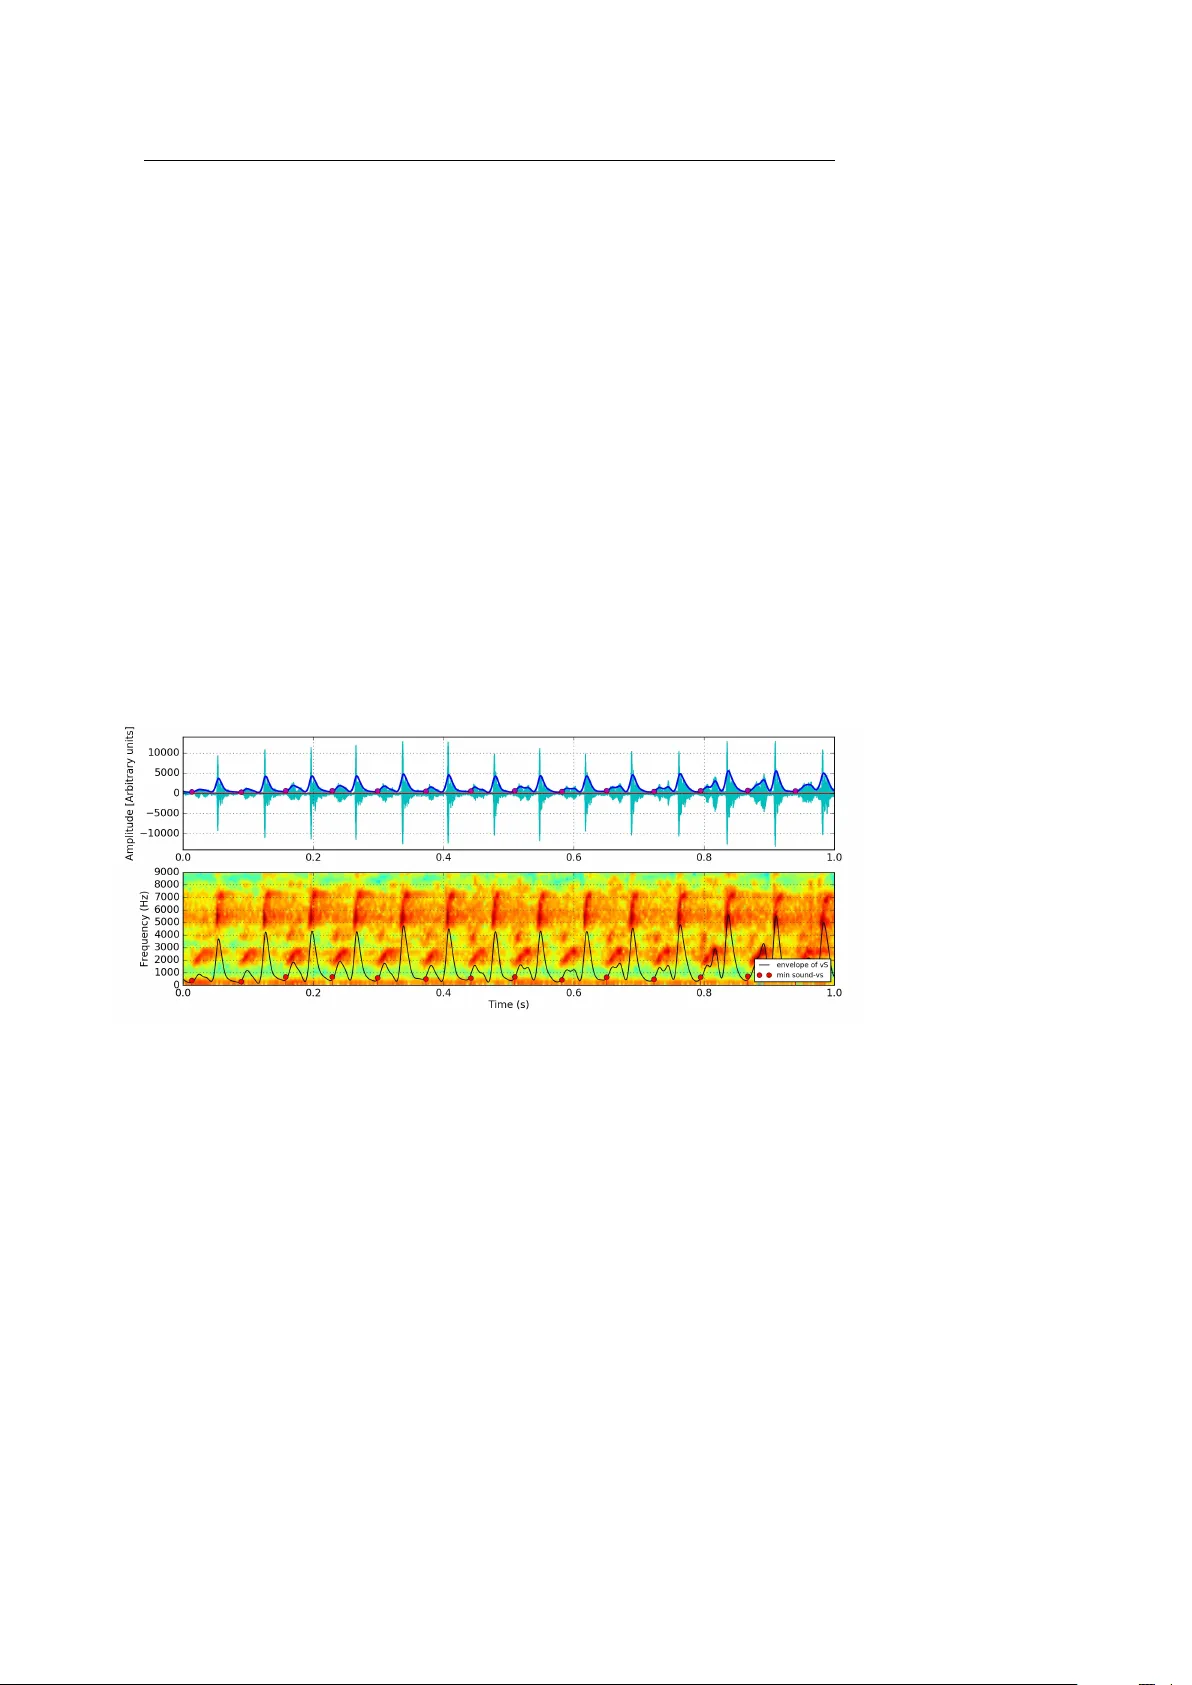
Noname man uscript No. (will b e inserted b y the editor) A metho d to align time series segments based on en v elope features as anc hor p oints Cecilia Jarne · P ablo N. Alcain Received: date / Accepted: date Abstract In the time series analysis field, there is not a unique recip e for studying signal similarities. On the other hand, av eraging signals of the same nature is an essen tial to ol in the analysis of differen t kinds of data. Here w e prop ose a metho d to align and av erage segmen ts of time series with similar patterns. A simple implemen tation based on python co de is provided for the pro cedure. The analysis was inspired by the study of canary sound syllables, but it is possible to apply it in semi p erio dic signals of differen t nature and not necessarily related to sounds. Keyw ords signal alignment and time series and a v eraging 1 Introduction: a general context regarding time series As defined in previous works, time series is a collection of observ ations made c hronologically . The nature of time series includes: large in data size, high dimen- sionalit y and necessary to up date con tinuously [1, 2, 3]. Man y analyses in exp erimen tal researc h rely on the study and treatmen t of time series. The tasks regarding the analysis mainly can b e categorized into: rep- resen tation and indexing, similarity measures, segmen tation, visualization, and mining. In the context of time series data mining, a fundamental problem is ho w to represen t the time series data. Differen t mining and searc hing tasks can be found in the literature and they can b e roughly classified in to the follo wing fields: pattern disco very and clustering, classification, rule discov ery and summarization [1]. Regarding the searc h for regularities, the partial perio dic patterns are an im- p ortan t class existing in a time series analysis. The regularities can b e classified Cecilia Jarne Universidad Nacional de Quilmes - Departamento de Ciencia y T ecnolog ´ ıa CONICET E-mail: cecilia.jarne@unq.ed.ar Pablo N. Alcain Departamento de Fsica F CEN, UBA 2 Cecilia Jarne, Pablo N. Alcain in to t w o t ypes: (i) regular patterns: patterns exhibiting perio dic b ehavior through- out a series with some exceptions and (ii) recurring patterns: patterns exhibiting p erio dic b eha vior only for particular time interv als within a series [4]. Time-series mining task also requires a notion of similarity b etw een series, based on the more intuitiv e notion of shap e. A similarity measure should b e con- sisten t and provide the follo wing prop erties: – Provide a recognition of p erceptually similar ob jects, even though they are not mathematically identical. – Be consistent with human intuition. – Emphasize the most salient features on b oth lo cal and global scales. – Be universal in the sense that it allows to identify or distinguish arbitrary ob jects, that is, no restrictions on time series are assumed. – Abstract from distortions and b e inv ariant to a set of transformations. Similarit y measures can b e classified into four categories. First, there are shap e- based distances. They compare the ov erall shap e of the series. Second, edit-based distances compare tw o time series on the basis of the minimum n umber of op- erations needed to transform one series into another one. The third category is F eature-based distances. These include extracting features describing asp ects of the series that then are compared with any kind of distance function. The last category is Structure-based similarit y: its aim is finding higher-level structures in the series to compare them on a more global scale. F urther, it is p ossible to sub divide this last category into tw o sp ecific sub- categories: Mo del-based distances work by fitting a mo del to the v arious series and then comparing the parameters of the underlying models. On the other hand, compression-based distances analyze ho w w ell t w o series can b e compressed to- gether. In this case, the similarity is reflected by higher compression ratios. One fully extended metho d to compare time series is called Dynamic Time W arping. Dynamic time warping (DTW) is a well-kno wn technique to find an optimal alignment b etw een tw o given (time-dep endent) sequences under certain restrictions. The sequences are warped in a nonlinear fashion to matc h each other. In fields such as data mining and information retriev al, DTW has b een success- fully applied to automatically cope with time deformations and differen t sp eeds asso ciated with time-dep enden t data [5]. Sev eral algorithms exist in order to implement this tec hnique and apply it to a verage signals [6, 7, 8, 9] Nev ertheless, there is not a unique recip e that can b e applied in the signal analysis. In some cases, there is the p ossibility to use a more heuristic approach, computationally c heap and also appropriate for data with regular time patterns. In this work, w e propose a metho d that uses a signal en v elop e as a feature to align canary syllables and we provide the softw are implementation. The rest of the paper is organized as follows: In Section 2 the method is de- scrib ed in general terms with the details on each subsection. In Section 3 a link to the softw are implemen tation is provided. Finally , in Section 4 we present the conclusions and some further work. A metho d to align time series segments based on env elope features as anc hor p oints 3 2 Signal alignment In present work we present an empirical algorithm that allo ws us to segmen t semi-p erio dic patterns and estimate the av erage of similar patterns. T o reach this first is necessary to align the individual patterns and then estimate an av erage amplitude and time duration. Suc h information is of particular in terest for researc h an characterization of birds singing in biology [10], thus metho d was applied to canary tonal sounds. In data of this nature, different segments hav e differences in the time duration and amplitude, ev en when some features, lik e frequency con ten t, remains the same. An example to describ e a canary song is shown in Figure 1. A canary can sing a rep ertory of different rep etitions of syllables. Let us supp ose that one w an ts to find a w a y to automatically measure the mean duration and amplitude of each kind of syllable. W e describ e here a w a y to automatically cut, align and estimate these mean quantities. T o summarize, the metho d consists of the following pro cedure: first, eac h sound segmen t is cut with a criterion that will b e describ ed in the Section 2.1. Second in order to align the many instances of the same syllable, once splitted, w e calculate the en v elope. Third, an anc hor p oint is defined with a criterion that allows aligning signals with similar patterns. Finally , the signal length of eac h segment is re- sampled in to a fixed length but preserving the individual duration of eac h segmen t in a vector. In the following subsections, we will describ e each step of the pro cess. Fig. 1 An example of a canary song. The upper panel shows the amplitude signal vs.time. The bottom panel shows the sound frequency con tent as well as the en v elope in arbitrary units of amplitude. 2.1 Segmentation of the time series Eac h sound segment is cut automatically b y means of the use of a burly env elope obtained with a low pass filter with cutoff frequency of the order of 20-40 Hz as sho wn in Figure 2. F or a differen t data set the frequency of this filter is related 4 Cecilia Jarne, Pablo N. Alcain to the frequency of the pattern rep etition. The k ey to this step is to find the frequency rep etition of the syllables and the minimum v alues to use them as an index to segment the series. That range was selected with resp ect to the canary syllable v ariations. W e used the minimum of that env elope as an index to pre-cut eac h sound segment in individual syllables. Fig. 2 An example of a canary song segmen tation with the burly env elop e in a pink line and the signal env elope in blue. 2.2 Env elope estimation and anchor p oint F or eac h of those segments, the true en v elop e is estimated using the metho d detail describ ed in [11]. During this procedure, the time duration is estimated for eac h segmen t and sav ed. T o synchronize all syllable of the multiple segments, w e used as a feature the sound env elope. In some cases, we used the v alue of the relative maximum of the true env elope, in others the relative minim um and in some cases, the where the amplitude is v ariable or very fluctuating or the maximum is not well defined, w e use the maximum of the low pass burly env elope as an anchor p oint. F or each segmen t we include a margin of fix num ber of frames from the anchor p oin t to preserve the entire shap e of each pulse up to the signal start and end. In this w ay we used the feature anc hor p oint to define a starting and ending p oin t of eac h segment. Regarding the selection of the feature, we ask the question of which is the b etter feature to define the anc hor p oint? The answer is that it will dep end on the particular characteristics of the signal. But we try the following pro cedure: With the env elopes’ amplitudes normalized to 1, we define candidates to anchor p oin t as the earliest time t a in which the normalized amplitude has the v alue a suc h as 0 < a ≤ 1. W e then displace all the env elop es from t to t 0 = t − t a ; in this w ay , all of the syllables hav e the same normalized amplitude at t 0 = 0. These are all the pr op ose d alignments. F or eac h prop osed alignment, w e calculate the mean squared error of the several env elopes, which is a measure of ho w well aligned the env elopes are. The anchor p oint is, then, the v alue that minimizes this mean squared error. A metho d to align time series segments based on env elope features as anc hor p oints 5 It is also w orth noting that this pro cedure also giv es a template of the env elope of the syllables and, therefore, ma y be used to decide whether a syllable b elongs to this group or not. Fig. 3 A study of the mean squared error vs the selected anc hor p oint. 2.3 Signal re-sampling and av eraging With the syllables aligned to this v alue, w e a v erage all the syllables. Using the anc hor p oint, the mean v alue b etw een all segment is obtained by first rescaling a re-sampling each segment to a fixed num ber of p oin ts (1000 points in the case of the example in Figure 4). In this wa y , every segmen t has a fixed num ber of p oin ts to b e aligned. With all segments aligned, we tak e the av erage in each p osition. The result of this analysis is sho wn in Figure 5. If w e w an t to ha v e also a mean v alue represented with a mean duration we can use the av erage of eac h mean time duration of the segmen ts [12]. In this wa y , when applying this pro cedure, we ha v e an a v erage syllable with an a verage amplitude, an a verage duration, and shap e that could be useful for further segmen t classification. 6 Cecilia Jarne, Pablo N. Alcain Fig. 4 The en v elope of the song segments that ha v e been re-sampled and b elong to the Sound time series shown in Figure 1. Fig. 5 Mean v alue of the env elope of the song segments. Time duration corresp onds to the mean v alue of each segment time duration. A metho d to align time series segments based on env elope features as anc hor p oints 7 3 Regarding the co de implementation The softw are used for this method w as dev eloped on python. Op en source scien tific libraries where used suc h as Scipy and Numpy in order to be p ossible shear mo dify and improv e the prop osed algorithm. This procedure is Implemented in Python in http : //g ithub.com/pabl oalcain/sy llabl e 4 Conclusions In presen t work, a metho d to align and a verage segments or series with similar patterns is proposed. Even when the pro cedure is straigh tforward and simple, its a robust solution for different signals. An imp ortant adv an tage of this metho d is that it can be applied in signals with differen t sp ectral con ten t. There are no require- men ts on the specific domain of the data. It is appropriate for one-dimensional data of any kind. Also, a pro cedure based on optimization is prop osed for the anc hor point selection, with the adv antage that it could be adapted for different signal particularities. References 1. T.c. F u, Eng. Appl. Artif. Intell. 24 (1), 164 (2011). DOI 10.1016/j.engappai.2010.09.007. URL http://dx.doi.org/10.1016/j.engappai.2010.09.007 2. P . Esling, C. Agon, ACM Comput. Surv. 45 (1), 12:1 (2012). DOI 10.1145/2379776. 2379788. URL http://doi.acm.org/10.1145/2379776.2379788 3. V etterli, J. Kov acevic, V.K. Goy al, F oundations of Signal Pr o c essing (Cam bridge Univer- sity Press, 2014) 4. R.U. Kiran, H. Shang, M. T oy oda, M. Kitsuregawa, in EDBT (2015) 5. F. P etitjean, A. Ketterlin, P . Gancarski, P attern Recognition 44 (3), 678 (2011). DOI 10.1016/j.patcog.2010.09.013. URL https://doi.org/10.1016/j.patcog.2010.09.013 6. P .F. Marteau, CoRR abs/1505.06897 (2015). URL 7. G.A. ten Holt, M.J. Reinders, E.A. Hendriks, in Thirte enth annual c onfer enc e of the A dvanc ed School for Computing and Imaging (2007) 8. S. Salva dor, P . Chan, Intell. Data Anal. 11 (5), 561 (2007). URL http://dl.acm.org/ citation.cfm?id=1367985.1367993 9. T. Giorgino, Journal of Statistical Softw are, Articles 31 (7), 1 (2009). DOI 10.18637/jss. v031.i07. URL https://www.jstatsoft.org/v031/i07 10. E.C. T umer, M.S. Brainard, Nature (2007). DOI https://doi.org/10.1038/nature06390 11. C. Jarne, ANALES AF A, [S.l.] 29 (2018). DOI https://doi.org/10.31527/analesafa.2018. 29.2.51 12. T. Oates, in 2002 IEEE International Confer enc e on Data Mining, 2002. Pr o ce e dings. (2002), pp. 330–337. DOI 10.1109/ICDM.2002.1183920
Original Paper
Loading high-quality paper...
Comments & Academic Discussion
Loading comments...
Leave a Comment