CrowdEstimator: Approximating Crowd Sizes with Multi-modal Data for Internet-of-Things Services
Crowd mobility has been paid attention for the Internet-of-things (IoT) applications. This paper addresses the crowd estimation problem and builds an IoT service to share the crowd estimation results across different systems. The crowd estimation pro…
Authors: Fang-Jing Wu, G"urkan Solmaz
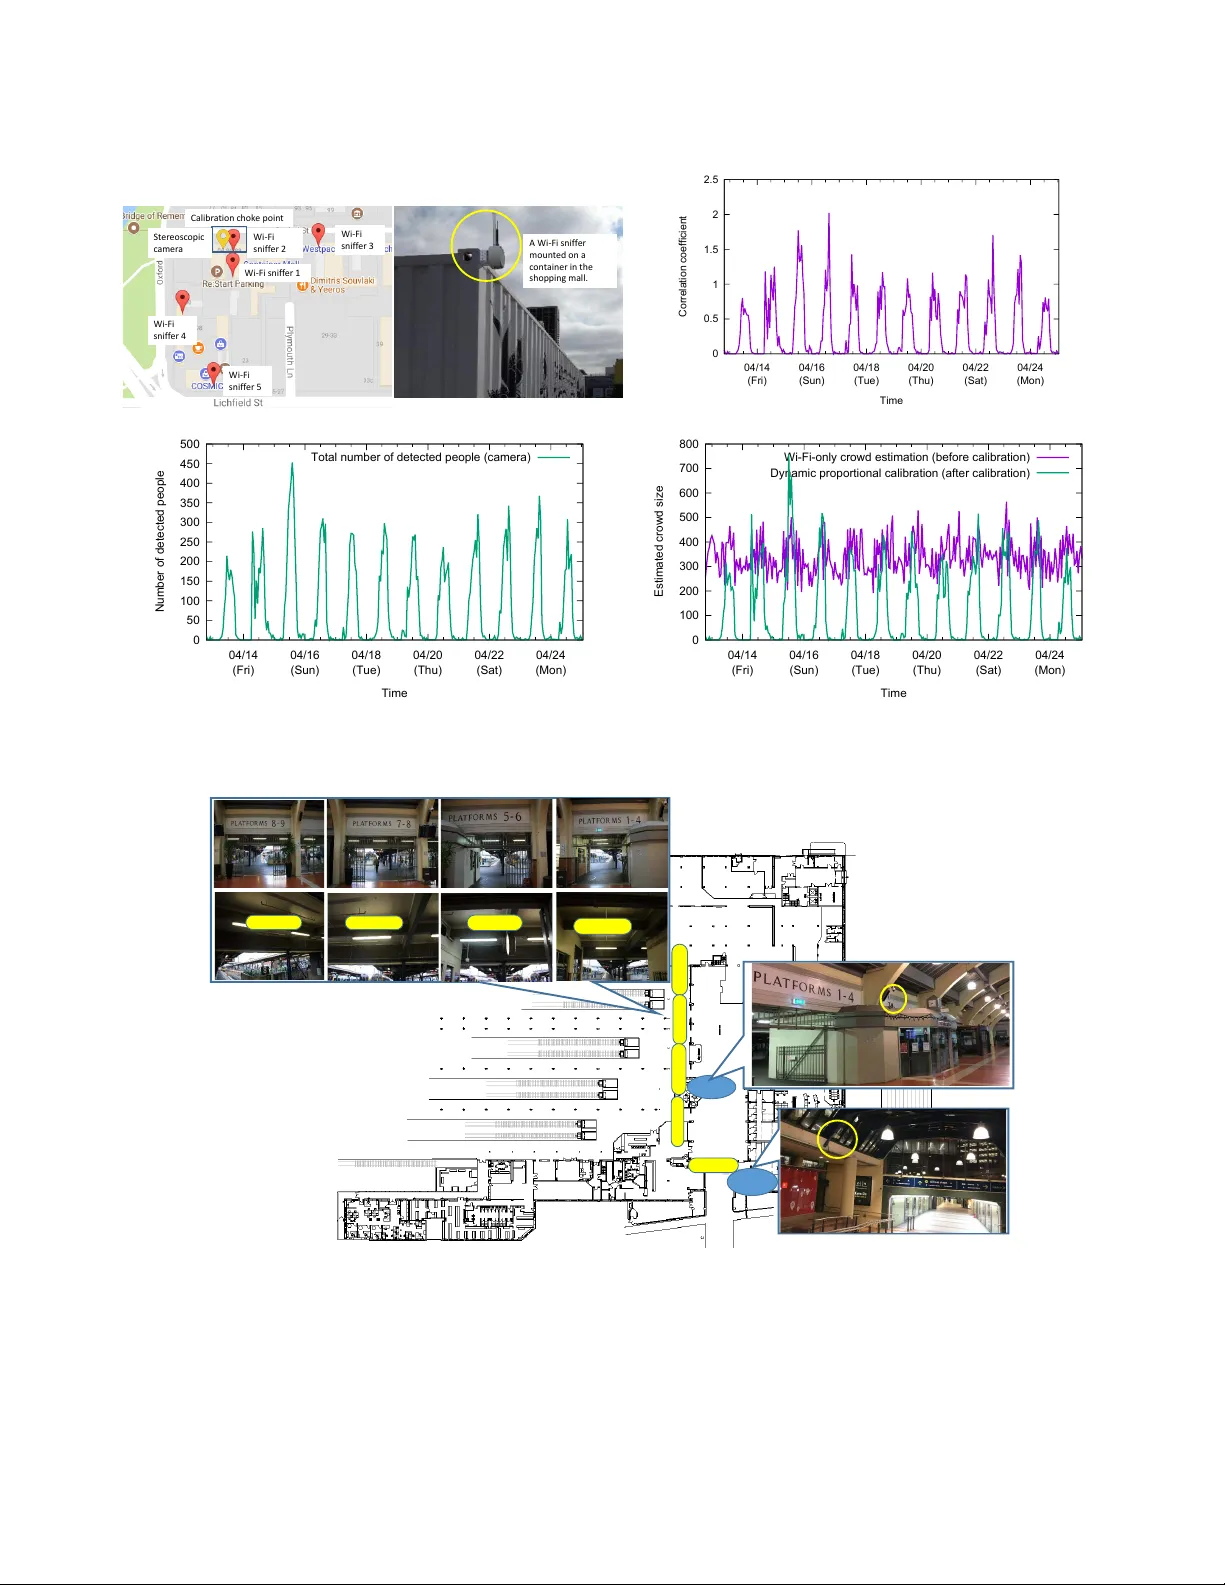
Cro wdEstimator: Appro ximating Crow d Sizes with Multi-mo dal Data for Internet-of- Things Ser vices Fang-Jing W u T U Dortmund University , Dortmund, Germany fang- jing.wu@tu- dortmund.de Gürkan Solmaz NEC Laboratories Europe, Heidelberg, Germany gurkan.solmaz@neclab.eu ABSTRA CT Crowd mobility has been paid attention for the Internet-of-things (Io T) applications. This paper addresses the crow d estimation prob- lem and builds an Io T service to share the crowd estimation results across dierent systems. The crowd estimation problem is to ap- proximate the crowd size in a targeted area using the observed information (e .g., Wi-Fi data). This paper exploits Wi-Fi probe re- quest packets (“Wi-Fi probes" for short) broadcasted by mobile devices to solve this problem. Howev er , using only Wi-Fi probes to estimate the crowd size may result in inaccurate results due to various environmental uncertainties which may lead to cro wd overestimation or underestimation . Moreover , the ground-truth is unavailable because the coverage of Wi-Fi signals is time-varying and invisible. This paper introduces auxiliary sensors, stereoscopic cameras , to collect the near ground-truth at a specied calibration choke point. T wo calibration algorithms are proposed to solve the crowd estimation problem. The key idea is to calibrate the Wi-Fi- only crowd estimation based on the corr elations between the two types of data modalities. Then, to share the calibrated results across systems required by dierent stakeholders, our system is integrated with the FIW ARE-based Io T platform. T o verify the proposed sys- tem, we have launched an indoor pilot study in the W ellington Railway Station and an outdoor pilot study in the Christchurch Re:ST ART Mall in New Zealand. The large-scale pilot studies show that stereoscopic cameras can reach minimum accuracy of 85% and high precision detection for providing the near ground-truth. The proposed calibration algorithms reduce estimation errors by 43 . 68% on average compared to the Wi-Fi-only approach. CCS CONCEPTS • Computer systems organization → Embe dded and cyb er- physical systems ; © ACM 2018. This is the author’s version of the work. It is posted here for your personal use. Not for redistribution. The denitive V ersion of Record was published in ACM MobiSys’18, http://doi.org/10.1145/3210240.3210320 1 IN TRODUCTION Internet-of- Things (IoT) enrich conuence of communication technologies, cyber- physical systems, and data analytics have boosted many promising applications such as health-care systems [ 31 ], indoor tracking [ 18 ], urban mobility monitoring [ 29 ], and Permission to make digital or hard copies of all or part of this work for personal or classroom use is granted without fee provided that copies are not made or distributed for prot or commer cial advantage and that copies bear this notice and the full citation on the rst page. Copyrights for components of this work owned by others than ACM must be honored. Abstracting with credit is permitted. T o copy otherwise, or republish, to post on servers or to redistribute to lists, requires prior specic permission and /or a fee. Request permissions from permissions@acm.org. MobiSys’18, June 10–15, 2018, Munich, Germany © 2018 Association for Computing Machinery . ACM ISBN https://doi.org/10.1145/3210240.3210320. . . $15.00 https://doi.org/978- 1- 4503- 5720- 3/18/06 social inference [ 26 ]. As the human mobility becomes an important aspect in many smart-city applications, data from mobile devices has been paid much attention. There exist two mechanisms for colle cting mobility data from mobile devices: opt-in data contribution using mobile applications [ 3 ] [ 15 ] and pervasive sning by overhearing wireless packets broadcasted by mobile de vices. Howev er , the opt-in rate in the for- mer mechanism aects the data quantity and quality, and it may suer from lack of b ootstrapping data in large-scale urban applications. Thus, this paper considers the pervasive sning, where multiple Wi-Fi sniers are deploy ed in a targeted area to capture Wi-Fi packets from nearby mobile devices. The interested type of Wi-Fi packets in this paper is Wi-Fi probe request packets (“Wi-Fi probes" for short) which are used to search for available Wi-Fi networks in the pr oximity . Since Wi-Fi probes indicate the appearance of mobile users, they provide clues for estimating the crow d size (i.e., number of people) in the area covered by the Wi-Fi snier . This paper exploits Wi-Fi probes to solve the crowd estimation problem . The crow d estimation problem is to approximate the cro wd size in a targeted area using limited information (e.g., Wi-Fi probes, sensor readings, and videos). However , using only Wi- Fi probes to count number of detected mobile devices for solving the crowd estimation problem may result in inaccurate results due to various uncertainties in mobility behaviours, physical environments (e.g., obstacles), radio interfer ence, and dynamic intervals of captured Wi-Fi probes depending on mobile device usage and moving speeds. The Wi-Fi-only crowd estimation can further result in crowd underestimation or crowd overestimation . Furthermore, since ranges of Wi-Fi signals are invisible and time-varying, the ground-truth of crowd size is not available especially for large-scale deployment when only Wi-Fi probes are considered. Therefore, this paper considers not only Wi-Fi sniers but also additional auxiliary sensors which are able to collect the near ground-truth with very high accuracy at a specied calibration choke point ( where most people ar e expected to pass through) for further calibrating the crowd estimation r esults using the multi-modal data sources. Even if the auxiliar y sensors are not supposed to be 100% accurate, they still pro- vide close to actual results at the calibration choke p oint. Stereoscopic cameras are introduced as auxiliary sensors at the calibration choke p oint, where the computer vision-based p eople counting provides the near ground-truth. However , deploying many stereoscopic cameras in a large-scale area r esults in high-costs and may raise privacy concerns in certain regions. The proposed system includes only a few stereo- scopic cameras which are deployed at the calibration choke point to compensate for Wi-Fi-only crowd estimation and perform calibration. The key idea is to learn the correlations between the Wi-Fi-only and the camera-based crow d estimation results at the calibration choke point and further apply the correlations to the neighboring areas monitored only by Wi-Fi sniers without stereoscopic cameras. However , the correlations change over time due to unpredictable uncertainties in the environment and the human mobility behaviours. Thus, two adaptive crowd estimation algorithms are proposed to dynamically learn the correlations and perform calibration in real-time. T wo pilot studies are launched for multiple stakeholders including Io T applica- tion developers, end-users, gov ernmental organizations (such as city councils), and enterprises. Therefore, we build the crowd estimation ser vice using our “in-house” FIW ARE-base d Io T platform for exposing the estimated crowd sizes. The IoT platform provides real-time service endpoint to external systems using the light-weight Io T broker with higher throughput, which w e call Thin Broker [ 6 ]. Multiple applications are developed by dierent stakeholders to access the cr owd estimation results in our two pilots through the Thin Broker . So, the multi-modal crowd estimation results can be broadly and transparently shared across Io T systems. The proposed system supports two pilot studies in an outdoor pedestrian shopping mall and in an indo or train station in New Zealand. The outdo or pilot study in the Re:ST ART shopping mall in Christchurch indicates that it suers from the crowd over- estimation problem when Wi-Fi-only crowd estimation is consider ed. The indoor pilot study in the W ellington Railway Station indicates that the crowd underestimation and overestimation problems appear alternatively during weekdays and during weekends when Wi-Fi-only crowd estimation technology is applied. Based on the measurements in large-scale pilot studies, the pe ople counting by the stereoscopic cameras can reach minimum accuracy of 85% , and the high precision detection results can serve as the near ground-truth. Based on the correlations between Wi-Fi-only cr owd estimation and people counting by the stereoscopic cameras at the calibration choke point, the proposed multi-modal calibration algorithms can reach a maximum normalized root mean square error of 0.25 and can signicantly reduce estimation err ors by 43 . 68% on average compared to the Wi-Fi-only approach. Also, the calibrated results align with the daily and weekly patterns in the near ground-truth. MobiSys’18, June 10–15, 2018, Munich, Germany Fang-Jing Wu and Gürkan Solmaz 2 RELA TED W ORK Crowd mobility analytics focuses on understanding pe ople distributions and their movements in targeted areas. Computer vision-based approaches , radio-based approaches, and Wi-Fi-based approaches are considered to address this issue. Computer vision-based approaches [ 11 ][ 17 ][ 21 ][ 12 ] perform classication based on the features learned from images or videos to detect people. In [ 11 ], neural networks are considered to estimate the density of crowds for improving the detection accuracy and speeds. Crowd detection technology using video content analytics is use d in [ 21 ]. The work in [ 12 ] focuses on detecting dense crowds in images. While various com- puter vision-based approaches are proposed [ 17 ], these approaches may compromise personal privacy . Furthermore, the usage of cameras is restricted in dierent countries depending on the regulations and the nature of the locations wher e the cameras would be installed. Radio-based approaches [ 32 ][ 9 ][ 8 ][ 30 ] exploit natures of signal propagation such as received signal strength indicators (RSSIs), channel statuses, and multi-paths to estimate the crowd size in a small area. RSSIs are taken into account in [ 32 ] for counting people and localization in an indoor oce. The work in [ 9 ], people counting are conducted based on RSSIs between a static pair of transmitter and receiver along a line-of-sight path. In [ 8 ], the transmitter and receiver are deploy ed behind the walls, and the RSSIs are used to estimate number of p eople in the area in-between. Recently , compared to RSSIs, channel state information (CSI) is more sensitiv e to moving objects and is used for counting people in [ 30 ]. However , the ab ove approaches target a small-scale environment. Wi-Fi-based approaches [ 7 ][ 2 ][ 19 ][ 16 ][ 28 ] by analyzing wireless packets provide more exible and low-cost options to perform crowd detection and human mobility monitoring in large-scale environments. The work in [ 7 ] proposes some ltering algorithms to handle uncertain and noisy data from Wi-Fi sniers due to MA C address randomization, overlapping coverage b etween Wi-Fi sniers, and high variance in Wi-Fi sensing ranges. In [ 2 ], Wi-Fi sniers are deployed in an industrial exhibition to capture the Wi-Fi probes from mobile de vices of attendees, and mobility patterns in each monitored zone are analyzed such as the number of unique MAC addr esses, the number of Wi-Fi probes, and the brand statistics of mobile devices in each zone. The work in [ 19 ] extends [ 2 ] to analyze not only crowd dynamics but also corr elations between the spatial conguration and entrepreneurial opportunities in these zones based on attendees’ mobility . In [ 16 ], the people ows are analyzed using Wi-Fi probes based on a sequence of frequently visited sensing zones. The work in [ 28 ] analyzes the RSSIs in the captured Wi-Fi probes to perform localization and further estimates crowd density in the monitored areas. Wi-Fi sning technology has been taken into account in some industrial products for crowd detection and monitoring [ 25 ][ 14 ][ 22 ]. There exist key technical dierences of our proposed approach compared to the ones aforementioned studies. First, the cro wd estimation problem using only Wi-Fi probes is raised though large-scale experimental observations and real-world pilots, where the crowd o verestimation and underestimation are investigated. Second, the key technical breakthrough is to combine both Wi-Fi-based and computer vision- based approaches for addressing the crowd estimation problem so that they can compensate the essential limitations of each other . The Wi-Fi-based approach can support large-scale observations with lower-cost deployment eorts and less restriction in privacy , whereas the computer vision-based appr oaches can provide higher accuracy observations in small-scale areas. Third, since the pr oposed algorithms ar e lightweight without a prior learning phase, it can adapt to dynamic changes of crowds mobility in real-time and large-scale applications. Finally , the proposed system is integrate d with the Io T platform to provide a reliable and real-time service for various stakeholders across Io T systems. 3 THE CRO WD ESTIMA TION PROBLEM 3.1 Preliminary: Wi-Fi Ser vice Discovery A mobile device can operate in either the passive scanning mo de or the active scanning mode, as dened in [ 13 ], to connect to Wi-Fi networks. When a mobile device operates in the passive scanning mode, it listens beacons from access points to conne ct to a Wi-Fi network. On the contrar y , when a mobile device operates in the active scanning mode, it broadcasts Wi-Fi probes to look for available Wi-Fi networks. Compared to the passive scanning mode, mobile devices operating in the active scanning mode take shorter time to connect to Wi-Fi networks. Therefore, the active scanning mode has been implemented in most of mobile devices. Each Wi-Fi probe includes the source address which is the MAC address of the mobile device, the destination address, and a sequence number in its management frame. Nowadays, o-the-shelf mobile devices broadcast Wi-Fi probes depending on the usage of mobile device for reducing energy consumption. The intervals of Wi-Fi probes range from a few seconds to 120 seconds. For example, when a mobile device is in a sleep mode, the intervals are longer . 3.2 Challenges of Crowd Estimation This paper uses Wi-Fi sning technology to estimate the crowd size in targete d areas. A Wi-Fi snier is capable of overhearing all types of Wi-Fi packets and picking up Wi-Fi probes. Wi-Fi probes indicate the appearance of mobile devices even though Wi - F i s n i ffe rs (a) Cr owd ove r est im at ion due t o a lar ger se nsi ng r ange. ( b) Cr owd under est im at ion due t o f ast m ove m ent s and longer pr obe int er va ls. Wi - F i s n i ffe rs Figure 1: The crowd overestimation and underestimation scenarios. Wi - F i s n iffe r T he cal i brat i o n c hoke poi nt w i t h a st ereos co p i c cam era. C row ds w i t hout m obi l e devi ces Z one 1 Z one 2 Z one 3 Z one 4 C row ds w i t h m obi l e devi ces E nt r ance l i ne Exi t lin e P eopl e co unt i ng using t he st er eosco pi c ca m er a Figure 2: An illustration of cross-modal crow d estimation. the mobile devices do not conne ct to Wi-Fi networks. Intuitively , for a given area monitored by a Wi-Fi snier , the crowd size in the area can be estimate d by counting the number of unique MAC addr esses. However , the accuracy cannot be guarante ed due to the following reasons when only Wi-Fi probes are taken into account. • Unknown ground-truth : Since the sensing ranges of Wi-Fi sniers are invisible and they vary over time, the actual ground-truth is unknown. Nowadays, many of smart- city applications suer from the similar issue especially for large-scale deployment. Furthermore, since it is hard to know who carries which mobile device with which MAC address, it is hard to verify the ground truth. Ther efore, when the actual ground- truth is unknown, it is hard to evaluate the accuracy of the cro wd estimation results based on only the total number of captured MAC addresses. • Crowd overestimation due to a larger sensing range: When the targete d area is much narrower than the Wi-Fi sning range ( e.g., a pedestrian shopping area), the vehicle trac or people passing by the neighborhood but not walking through the targeted area may be counted. Therefore, the estimated crowd size is more than the actual crowd size . Fig. 1 (a) shows the crowd over estimation scenario using only the Wi-Fi sning technology . • Crowd underestimation due to longer probe inter vals: Crowds make fast movements in some situations (e.g., bad weather conditions) or in some special environments (e.g. train stations). In such kind of situations, the probe intervals become longer b ecause people normally do not check their mobile deivces when they are in a hurry . In this case, people have already moved out of the sensing range of the Wi-Fi snier before their mobile phones broadcast a Wi-Fi probe. As a result, the estimated crowd size based on the number of captured MAC addresses can b e much less than the actual crowd size . Fig. 1 (b) shows a scenario of the cr owd underestimation problem when only the Wi-Fi sning technology is considered. CrowdEstimator MobiSys’18, June 10–15, 2018, Munich, Germany W i - F i sn if f er C alibr at ion point ( e. g. m ain ent r ance ) E xt er nal net wor ks G at eway G at eway Cr owd est im at ion back - end Io T b ro ke rs M obilit y m onit or ing applica t ion V ir t ual r ealit y applica t ion M o b ility - dr i v en I oT appl i c at i ons i n mul t i pl e I oT syst e m s DigiM esh pr ot oco l Io T syst e m 1 Io T syst e m 2 In - house Io T P lat f or m S t er eosco pic ca me ra W i - F i sn if f er W i - F i sn if f er W i - F i sn if f er W i - F i sn if f er G at eway Figure 3: The system architecture. 4 CROSS-MOD AL CRO WD ESTIMA TION Assume that multiple Wi-Fi sniers are deployed in an environment without many entrances such as a train station. Each Wi-Fi snier captures Wi-Fi probes in its sensing zone . W e consider a calibration choke point , wher e a Wi-Fi snier and a reliable stereoscopic camera are deploy ed for nding the correlations between the tw o data modalities. Fig. 2 illustrates the multi-modal deployment, where the calibration choke point is placed in Zone 1. The stereoscopic camera is mounte d to cover the street so that people walking through can be captured and counte d. An entrance line and an exit line are dened for determining the moving directions of the people using the computer vision-based technology . While the crowd estimation based on the information from the Wi-Fi snier is not precise , the stereoscopic camera is capable of providing precise number of people walking through the monitored area which can serve as the near ground-truth . The near ground-truth using the stereoscopic camera can be veried by manually counting people in the captured videos. Thus, we can learn how reliable the stereoscopic camera’s results are, and it can help to perform further calibration. The key idea of the proposed cross-modal crowd estimation approach is to nd the correlations between the number of MAC addresses captured by the Wi-Fi snier and the number of people counted by the stereoscopic camera at the calibration choke point. Then, we apply the correlations to Wi-Fi-only crowd estimation r esults in other sensing zones without a stereoscopic camera. Since the sensing zones covered by these Wi-Fi sniers are close to each other , the combinations of moving paths from one zone to the others are limited. For example, Zone 1 and Zone 2 are in the same main street, and the crowd distributions in the two zones are similar to each other in temporal and spatial domains. Therefore, the cro wd distributions and correlations in those sensing zones are assumed the same because the y are next to each other in the same proximity . The correlations can be applied to these sensing zones which do not have stereoscopic cameras, and it can further calibrate Wi-Fi-only results for all of the three zones based on the precise near ground-truth. Although the calibrated results for Zone 2 is more accurate compared to Zone 3 and Zone 4 which are located in the side roads, it still provides higher accuracy, as presented in Section 5, when these zones are closely located. Note that the Wi-Fi sniers and stereoscopic cameras are used in this paper to compensate for each other’s essential limitations. Wi-Fi sniers provide a low-cost and privacy-preserving solution for large-scale monitoring, whereas stereoscopic cameras can provide more precise results in a small-scale ar ea. However , the correlations b etween the results from the tw o types of data sources vary ov er time and may change dynamically due to some uncertainties such as weather conditions, festivals, weekdays, and weekends. Therefore, re-learning the correlations to adapt to dierent environmental conditions becomes a challenge. This paper pro- poses adaptive crowd estimation algorithms in Section 4.3 to dynamically re-learn the correlations between two data modalities so that the corr elations can be updated in real-time. 4.1 System Architecture Fig. 3 illustrates the system architecture of the proposed crowd estimation service. Multiple Wi-Fi sniers are deployed in the targeted environment, and a calibration choke point is sele cted based on human domain knowledge for deploying a stereo- scopic camera. For example, the main entrance in a pedestrian shopping area or in a train station can serve as the calibration choke point because most of pedestrians appear there. The calibration choke point provides richer information to compute the correlations between detected events by the two dierent data sources (i.e., the Wi-Fi (b) The m ounted stereoscopic camer a. (a) The only one entrance of an office room. Figure 4: Exp erimental setup for verication of the near ground-truth. snier and the stereoscopic camera). These data sources are connected to their local gateways through the DigiMesh protocol. The local gateways report colle cted data to the crowd estimation back-end infrastructure through external netw orks (i.e., 3G networks). The proposed cross-modal crow d estimation module is implemented in the back-end infrastructur e. It publishes the calibrated cr owd estimation r esults to the mul- tiple instances of Io T broker deployed in the in-house Io T platform so that third-party Io T systems can quer y the Io T brokers for developing their own applications. 4.2 Data Quality for the Near Ground- Truth T o evaluate the data quality for providing the near ground-truth, we conduct experiments in a lab environment to verify the accuracy and the precision of the stereoscopic camera with the computer vision-based software for people counting. • Accuracy is the proximity of measurements to the true value. For example, if the actual number of people is 20, and the numb er of people detected by the stereoscopic camera is 3, then results provided by the stereoscopic camera is inaccurate. • Precision refers to the r epeatability or reproducibility of the measurements. For example, considering the same example ab ove , if the same experiment is repeated for 100 times, and the stereoscopic camera detects 3 people each time, then the results provided by the stereoscopic camera is very precise. Based on these two metrics, we verify if the stereoscopic camera provides reliable and quality data to serve as the near ground-truth. Fig. 4 shows our experimental setup in the lab environment. An oce room with only one entrance is considered. An o-the-shelf stereoscopic camera is mounted on the entrance to monitor people moving in and from the oce room. First, to verify the accuracy of the stereoscopic camera, we consider two dierent scenarios: a static crowd and a dynamic crowd in the following two independent experiments. In the rst experiment, 4 pe ople are mostly static in the oce room, but they still move in or out from time to time during the experiment. The total duration of this experiment is 3 hours. During the experiment, the 4 people make 63 movements (move-in or move-out events), and the 63 events ar e all detected by the the stereoscopic camera. However , two of these events are false detection because one person makes ambiguous movements (back and forth mov ements) under the stereoscopic camera. The accuracy in the rst experiment with a static crowd is 96 . 8% ( = 61 / 63 ) . W e conduct the second experiment with a dynamic crowds of 14 people. The 14 people walk in the monitored oce room and then walk out of the oce room after staying for a couple of minutes. The duration of the experiment is 20 minutes. During the experiment, people walk not exactly one by one, but sometimes 2 people walk together or two just after the other two because they talk to each other while walking. Moreover , they are allowed arbitrarily enter or leave the oce room. In total, 41 events are detected in 20 minutes, and one of them is false detection. Therefor e,the accuracy for the dynamic scenario is 97 . 5% ( = 40 / 41 ) . Then, to verify the precision, we conducted the experiment, where a single p erson repeatedly mov es in and out the oce room for 10 times. The detection results of these repeated movements are all the same. Note that, compared to the stereoscopic camera, a Wi-Fi snier is not able to pr ovide a good enough precision due to uncertain intervals of Wi-Fi probes. Spe cically , although same movements are repeated by the same person, the detection r esults can be dier ent depending on the intervals of Wi-Fi probes. Based on the above observations, we assume that the stereoscopic camera can provide a baseline as the near ground-truth in bright environments. W e further verify the accuracy in the large-scale pilot studies in Section 5. 4.3 Adaptive Calibration Algorithms The key idea of the proposed algorithm is to calibrate the Wi-Fi-only crowd estima- tion r esults using the corr elations between events detected by the Wi-Fi snier and the stereoscopic camera at the calibration choke point. First, we conduct an e xperiment in the Re:ST ART p edestrian shopping mall in Christchurch to make observations on MobiSys’18, June 10–15, 2018, Munich, Germany Fang-Jing Wu and Gürkan Solmaz (a) A weekly view . (b) A daily view . Lunch time Midnight Dinner time Figure 5: Dynamic changes of correlations between the events detected by the two dierent data sources. correlations between events detected by the two types of data sources. A Wi-Fi snier and a stereoscopic camera are mounted at the main entrance gate to monitor p edestri- ans who enter and leave the pedestrian shopping mall. The duration of the experiment is 1 week. Fig. 5 shows the experimental results during the one week. As we can see in Fig. 5 (a), the crowd estimation results using the dierent data modalities have similar patterns. However , the dierence between the two results changes over time. Fig. 5 (b) shows the daily pattern. The dierences during the midnight, lunch time, and dinner time vary over time depending on uncertain and unknown environmental conditions. Since the correlations dynamically changes, tw o algorithms: (1) dynamic propor- tional calibration and (2) adaptive linear calibration , are proposed to adaptively re-learn the correlations and perform the cr oss-modal calibration over time . The rst algorithm proportionally moderates the crowd estimation r esults based on the ratios between camera’s and Wi-Fi’s detection results. The second algorithm modies the typical linear regression to t the latest training data points from the two types of detected events in the sense that the training data points ar e continuously updated over time. In the proposed algorithms, xed-size time windows are used so that the correlations can b e updated time window by time window . For a given time window t i , let C 0 denote the set of move-in and mo ve-out events detected by the ster eoscopic camera during t i , and let W k , k = 0 , . . . , n , denote the set of Wi-Fi probes captured by the Wi-Fi snier k during t i . Here, W 0 denotes the set of Wi-Fi probes captured by the Wi-Fi snier at the calibration choke point. 4.3.1 Dynamic Proportional Calibration. Algorithm 1 presents the pseudocode of the dynamic proportional calibration algorithm. There are two phases in the proposed algorithm: (i) corr elation update phase and (ii) calibration phase . First, in the correlation update phase, the numb er of mobile devices detected by the Wi-Fi snier at the calibration choke point during t i (denoted by d 0 ), is computed by Algorithm 2. Then, the algorithm accumulates the total number of the move-in and move-out events detected by the stereoscopic camera during t i , denoted by y 0 . Here, move-in and move- out events are accumulated because pedestrians can come from two opp osite directions. Therefore, the corr elation coecient a i during this time window can be calculated. Then, in the calibration phase, the correlation coecient a i is applied to d 1 , . . ., d n , which are the Wi-Fi-only crowd estimation results in the other sensing zones, to compute the corresponding calibrated results d ′ 1 , . . ., d ′ n respectively . Algorithm 1 is executed every time window so that calibration can be adaptively performed based on the time-varying correlations. Algorithm 1: Dynamic Proportional Calibration ( t i , C 0 , { W 0 , .. ., W n }) Input : C 0 is the set of move-in and move-out e vents detected by the stereoscopic camera during t i , and { W 0 , . . ., W n } is Wi-Fi probes captured by Wi-Fi sniers. Output : d ′ 1 , d ′ 2 . . ., d ′ n . 1 //Correlation update phase : 2 d 0 =Wi-Fi-based device counting ( W 0 , t i ) ; 3 y 0 = e i n + e ou t , where e i n is the total number of move-in events and e ou t is the total number of move-out events in C 0 ; 4 Compute the proportional function: y 0 = a i · d 0 ; 5 //Calibration phase : 6 for W k , k = 1 , 2 , . . . n do 7 d k =Wi-Fi-based device counting ( W k , t i ) ; 8 d ′ k = a i · d k ; 9 end 10 return d ′ 1 , d ′ 2 . . ., d ′ n ; Algorithm 2: Wi-Fi-based device counting ( W k , t i ) Input : W k which is the set of Wi-Fi probes captured by Wi-Fi snier k during time window t i . Output : d k which is the number of detected mobile devices during time window t i . 1 d k =0; 2 D = ∅ ; 3 for p ∈ W k do 4 if MAC address indicated in p < D then 5 d k = d k + 1 ; 6 D = D Ð { MAC address indicated in p } ; 7 end 8 end 9 return d k ; 4.3.2 Adaptive Linear Calibration. The key idea of the adaptive linear calibration is to nd a linear function that ts the set of given measurements captured by the Wi-Fi snier and stereoscopic cameras at the calibration choke point so that the linear function can be applied in other sensing zones to further calibrate the Wi-Fi- only crowd estimation results. However , the typical linear regression may lead to negative values (i.e., negativ e crowd sizes). In addition, the typical linear regression cannot adapt to the dynamic changes of correlations between Wi-Fi-only results and computer vision-based results at the calibration choke point. Therefore , an adaptive linear regression is designed as a modication of the typical linear regression. The key idea of the adaptive linear regression is to limit the number of training data points to the latest q measurements. Based on the latest q measurements, the linear least square method is applied to compute a linear function going through the origin. Let ( x 1 , y 1 ) , . . . , ( x q , y q ) denote the measurements during the latest q time windows at the calibration choke point. Here, x i is the number of mobile devices detected by the Wi-Fi snier during the time window t i at the calibration choke point, and y i is the total counts of people detected by the stereoscopic cameras during the time window t i at the calibration choke point. Assume that the correlations between Wi-Fi-only results and computer vision-based results at the calibration choke point follows the linear function y = a x going through the origin. Therefore, the total sum of the vertical osets from the linear function to those measurements can be computed by L 2 = q Õ i = 1 ( y i − a · x i ) 2 . = q Õ i = 1 y 2 i − 2 a q Õ i = 1 x i · y i + a 2 q Õ i = 1 x 2 i . Therefore, the linear function can be approximated by nding the minimum of L 2 . The condition for L 2 to be a minimum is that ∂ L 2 ∂ a = 0 . So, we have ∂ L 2 ∂ a = − 2 q Õ i = 1 x i y i + 2 a q Õ i = 1 x 2 i = 0 . Thus, a = Í q i = 1 x i y i Í q i = 1 x 2 i . (1) Algorithm 3 presents the adaptive linear calibration algorithm. The input of the algorithm contains the set of move-in and mo ve-out events dete cted by the stereoscopic camera during the current time windo w t i (denoted by C 0 ), the Wi-Fi probes captured by these Wi-Fi sniers ( denoted by { W 0 , . . ., W n } ) during the current time window t i , a set of historical measurements (denoted by O ), and the limited size of training data points ( denoted by q ). The set of historical measur ements O consists of the numbers of mobile devices detected by the Wi-Fi snier and the total numb ers of people detected by the stereoscopic camera at the calibration choke point during the latest q time windows t i − 1 . . t i − q . Initially , O = ∅ and it is continuously updated when a new measurement arrives. The maximum size of O is q . When the new events arriv e, d 0 and y 0 are computed. Then, a new training data point ( d 0 , y 0 ) is added into O . After O is updated, if the size of O is larger than the limited numb er of training data points q , the oldest training data point is removed from O . Then, the linear function is update d using Eq. (1) based on the updated training data points O . Finally , for those sensing zones without stereoscopic cameras, this up dated linear function is applie d to the Wi-Fi-only crowd estimation results for calibration. CrowdEstimator MobiSys’18, June 10–15, 2018, Munich, Germany POE Splitter Ethernet cable from POE switch 160x140x10mm excluding antenna (1) A business - level Wi - Fi snif fer for real - world deployment. POE Splitter Cable from POE Switch Stereoscopic Camera 12V power to Camera M 12 to RJ45 Data Cable +5VDC (2) The stereoscopic c amera for calibration. A nal yt i cs conf i g file s Wi - F i dat ab a se A nal yt i cs C am era dat ab a se C ouchD B HT T P server A m azon SQ S dat a di scover y T hi n B roker A m azon SQ S conf i g file s D B conf i g file s A m azon SQ S C ro w d est i m a t i o n bac k - en d W C T hi n D i scovery c ont ex t reg. D ashboa r d T hi n D i scovery P ost greS Q L M o b ility - dr i v en Io T a p p lic a tio n s I oT b roke r s W el l i ngt on t rai n st at i ons C hri st chu r ch shopp i ng m al l S t ereosco p i c cam era Wi - F i s n iffe r (a) Hardware components. (b) Software components. Figure 6: Hardware and software components for b oth outdoor and indoor pilot studies. Algorithm 3: Adaptive Linear Calibration ( t i , C 0 , { W 0 , .. ., W n } , O = {( x 1 , y 1 ) . . . } , q ) Input : C 0 is the set of move-in and move-out e vents detected by the stereoscopic camera during t i , and { W 0 , . . ., W n } is Wi-Fi probe request packets captured by Wi-Fi sniers. Output : d ′ 1 , d ′ 2 . . ., d ′ n . 1 //Update training data points and linear function : 2 d 0 =Wi-Fi-based device counting ( W 0 , t i ) ; 3 y 0 = e i n + e ou t , where e i n is the total number of move-in events and e ou t is the total number of move-out events in C 0 ; 4 Add ( d 0 , y 0 ) into O 5 if | O | < q then 6 exit; 7 end 8 else if | O | > q then 9 Remove the oldest measurement from O ; 10 end 11 Update the linear function: y = a · x based on Eq. (1); 12 //Calibration phase : 13 for W k , k = 1 , 2 , . . . n do 14 d k =Wi-Fi-based device counting ( W k , t i ) ; 15 d ′ k = a · d k ; 16 end 17 return d ′ 1 , d ′ 2 . . ., d ′ n ; 5 PILOT ST UDIES 5.1 Hardware and Software Design W e build business-level Wi-Fi sniers to support our outdoor and indo or pilot studies. Fig. 6(a)-(1) shows the developed Wi-Fi snier and Fig. 6(a)-(2) shows the o-the-shelf stereoscopic camera [ 27 ]. Fig. 6(b) shows the software components of the proposed service. The data sources (i.e., stereoscopic cameras and Wi-Fi sniers) send sensing data to the Amazon Simple Queue Service (Amazon SQS) [ 4 ]. Then, the Amazon SQS data discovery periodically makes queries to the Amazon SQS and posts to the H TTP ser ver . The query interval of the Amazon SQS is spe cied in the Amazon SQS conguration les. T o enable real-time ser vice, the query interval for the pilot studies is 100 ms. After the H T TP server receives incoming real-time data, it imme diately populates data into the Wi-Fi and camera databases, where a CouchDB is used in our implementation. The congurations of the databases for mapping attributes are specied in the database conguration les. Then, the data analytics component makes queries to both databases and p erforms cross-modal crowd estimation and calibration using the proposed adaptive algorithms in Section 4.3. The crowd estimation results are published to the Io T brokers so that multiple stakeholders involved in the pilot studies and their IoT applications can access the real-time results. The implemented IoT broker is called thin broker [ 6 ], which eciently handles the queries and subscriptions with with higher throughput. Meanwhile, the cr owd estimation results ar e visualized in the dashboard. T wo pilot studies in an outdoor pedestrian shopping mall in Christchurch and an indoor train station in W ellington are launched to verify the proposed cross- modal crowd estimation service. T able 1: The data model for the Wi-Fi snier entity . Property Expected type Description id String Entity’s unique identier type String The type of entity. In this case, the dene d value for the device is “nle:WiFiSnier” . MacAddress String The MA C address of the Wi-Fi snier device. nle:SimpleGeolocation JSON Contains location information (i.e., latitude and longitude) of the device. nle:CrowdEstimation JSON Attribute of the nle:WiFiSnier where data an- alytical results reside. 5.2 Integration with the Io T Platform Since the cross-modal crowd estimation results are required by multiple stake- holders (including city councils and industrial application developers) in the two pilot studies, the entire system is integrated with the in-house IoT platform which provides real-time service endpoint to external systems via the thin broker . Below , we describe the information model of crowd estimation results and then describe the components of the Io T platform that enables the cross-system crowd estimation service. 5.2.1 NGSI-based Information Model. The information model for crowd estimation is based on the FI W ARE [ 10 ] Next Generation Service Interfaces (NGSI) [ 1 ]. NGSI is a set standard interfaces for providing interoperability , information sharing, and system integration. NGSI context API [ 5 ] enables access to a plethora of rich context information about users, places, events, and things. NGSI has become an open standard of FIW ARE adopted by various smart cities all over the world. Therefore, the NGSI interface is used for crowd estimation service to achieve openness and interoperability between dierent applications, systems, and platforms. NGSI has an H T TP-based RESTful API which can have either JSON or XML formats for the message b odies. The NGSI-based information model is built on a structure which has entity , attribute , and metadata relationships. Below , we specify the major entity: Wi-Fi snier and its attribute: crowd estimation . The rst one represents a device, and the latter represents a data analytics result. T able 1 illustrates the data mo del for the Wi-Fi snier. Here, we specify the properties of the snier device. A Wi-Fi snier device is formally dened as the “nle:WiFiSnier” . The Wi-Fi snier has the “nle:CrowdEstimation” property as an attribute to represent the data analytics result. The “id” and “type” properties are mod- eled as entity id and type in the information model, whereas “nle:SimpleGeolocation” and “MacAddress” are modeled as the domain metadata of the entity . Table 2 denes the properties for the key attribute: crowd estimation. Crowd estimation attribute rep- resents the data analytics results in the crowd estimation service. There are ve basic properties of this attribute: “name” , “type” , “ contextV alue” , “StartTime” , and “EndTime ” . Context value represents the crow d estimation result for the given time window . The time window is specied by the start time and the end time. The “StartTime” and “End- Time” properties are modeled as the metadata of the attribute . The dened NGSI-based information is converted to a JSON format for context exchanges across dierent Io T systems. Fig. 7 shows an example JSON data which has the NGSI structure. 5.2.2 The IoT Platform. The crowd estimation service is integrated with the in- house Io T platform. The IoT platform is FIW ARE-based and, it includes components that are dened as generic enablers (GEs) in the FIW ARE ecosystem [ 10 ]. In particular , the components implement IoT Broker and IoT Discovery GEs of FI W ARE. Mainly , IoT Broker is used for distribution of the information coming from IoT data providers ( e.g., MobiSys’18, June 10–15, 2018, Munich, Germany Fang-Jing Wu and Gürkan Solmaz T able 2: The properties of the crowd estimation attribute. Property Expected type Description name String The attribute ’s identier . “CrowdEstimation” is used as the name. type String The typ e of entity . In this case, the dened value is “nle:CrowdEstimation” . contextV alue Integer The estimated crowd size. StartTime Date Time The start time of the crowd estimation. EndTime Date Time The end time of the crowd estimation. Figure 7: An example of JSON format based on our informa- tion model. devices) to the Io T data consumers (e.g., applications). Io T Discovery is ne cessary for discovering the availability of resources (context). W e develop the dened features of the GEs in our open-source Io T components. This pap er uses the lightweight thin broker and thin discovery . They use the same NGSI-9 and NGSI-10 interfaces for r eal- time services. The main functions of the thin broker are listed below . • Context quer y : Access conte xt information (for data consumers). • Context subscription : Subscribe for a change or an up date of a context (for data consumers). • Context notication : Send notications to the subscribers (from Io T Broker to data consumers). • Context up date : Send new context (from data providers to Io T Broker). Context query returns the latest available data to the data consumer. In the crow d estimation service, it basically returns the latest estimated crowd size. Context sub- scription is saved in the thin broker whenev er a change in the context happens (e .g., new estimated crowd size), a context notication is triggered and the subscrib er is notied with an H T TP post. Context subscription includes a reference URL which denes an HT TP server to listen upcoming notications from the thin broker . Context notication is the result of a context subscription, such that when a change in the subscribed context happens, a notication is automatically triggered. Context update is from the data providers to the thin broker . In the crowd estimation service, the new results for dierent entities (i.e., Wi-Fi sniers) are pushed to thin broker ev ery time window . 5.3 An Outdo or Pilot Study: Pedestrian Areas The rst pilot study is conducted in the Re:ST ART mall which is a pe destrian shopping mall in Christchurch, New Zealand from 12-25 April 2017. Before the April, pre-pilots are conducted from De cember 2016 to April 2017 for device installation, real-time communication testing, and making obser vations on collecte d data. The lessons from the pre-pilots are discussed in Section 6. Finally , ve Wi-Fi sniers are deployed in the Re:ST ART mall. Fig. 8(a) shows the deployment, where the shopping mall is built by many containers which divide the entire area into several pedestrian walking areas. The Wi-Fi sniers are mounted on these containers. The Wi-Fi snier T able 3: The accuracy of stereoscopic cameras. IDs C103 C104 C105 C106 Accuracy 85% 85% 93% 95% 2 and the stereoscopic camera are deployed at the calibration choke point which is located at the main street in the pedestrian shopping mall. As we can see in Fig. 8( b), there exists a r egularity in the daily patterns of corr elation coecients between the Wi-Fi-only crowd estimation results and the camera-based people counting results. Fig. 8(c) sho ws the near gr ound-truth using the stereoscopic camera in the main street. Fig. 8(d) shows the crowd estimation results before and after the dynamic proportional calibration is applied to the sensing zone cover ed by the Wi-Fi snier 4. The Wi-Fi- only crowd estimation before calibration is mostly overestimated, and the number of detected mobile devices e ven at midnight is still very high. After applying the proposed algorithm, the calibration results indicate similar daily mobility patterns of the near ground-truth. 5.4 An Indo or Pilot Study: A Train Station An indoor pilot study is conducted in the W ellington Railway Station, Ne w Zealand during 03-24 August 2017. Compared to pedestrians in a shopping mall, the passengers in the train station generally make fast mov ements. Fig. 9 shows the deplo yment in the train station with multiple entrances. The entrances are considered to form a single calibration choke point, where the passengers moving to/from the platforms are monitored. T wo Wi-Fi sniers M1 and M2 are deployed to capture Wi-Fi pr obes of mobile devices carried by passengers. The Wi-Fi snier M1 is deployed at the calibration choke point, and the Wi-Fi snier M2 is lo cated at the side entrance of the train station in the canopy/subway ar ea for monitoring people walking outside the train station. Four stereoscopic cameras are deploy ed at the calibration choke point for collecting the near ground-truth. Since the entire platform areas consist of multiple platforms, where multiple of them share an entrance, four stereoscopic cameras C103, C104, C105, and C106 are grouped into a “virtual” one to cover all entrances of the entire platform areas. In the indoor scenario, videos from all the stereoscopic cameras are recorded. W e manually count the actual number of people in the recorded videos to verify the accuracy of these stereoscopic cameras in the pilot study . Table 3 indicates the accuracy of the stereoscopic cameras at the calibration choke p oint. They can provide a minimum accuracy of 85% in the indoor environment. Fig. 10(a) shows the weekly pattern of the near ground-truth collected at the cali- bration choke point. Since the four stereoscopic cameras are grouped into a virtual one, the total number of passengers detected by all of stereoscopic cameras are accumulated for the near ground-truth. As we can see , the numbers of passengers passing though the platform areas during weekdays are much higher than the weekends. Fig. 10(b) shows the daily pattern of the Wi-Fi-only crow d estimation and the near ground-truth detected by the stereoscopic cameras at the calibration choke point. There exist a peak during commuting time every morning and a sub-peak during the commuting time every afternoon. As it can b e seen, the Wi-Fi-only approach underestimates crowd sizes during peak hours, whereas it overestimates crowd sizes during non-peak hours and weekends. The environmental conditions are more dynamically changing com- pared to the outdoor pedestrian shopping mall in Christchurch. Fig. 10(c) sho ws the correlation coecients between the Wi-Fi-only crowd estimation results and people counting by these stereoscopic cameras at the calibration choke point. It is similar to the weekly mobility pattern in the train station. Fig. 10(d) shows the calibration results after the dynamic proportional calibration is applied. Since the results are adaptively calibrated based on the near ground-truth, the underestimation and overestimation situations can be mitigated after calibration. Fig. 11 shows the heat map views which are included in the visualization dashboards for the two pilot studies. 5.5 Advanced Performance Comparison T o verify the accuracy the proposed calibration algorithms, an additional stereo- scopic camera C101 is installed next to the Wi-Fi snier M2 in the W ellington Railway Station, as shown in Fig. 9. The C101 provides the near ground-truth in the M2’s sens- ing zone to compare with calibration r esults of the proposed calibration algorithms and verify their accuracy . Fig. 12 shows the calibration results when the two proposed calibration algorithms ar e applied to the M2’s sensing zone . The dynamic proportional calibration results are closer to the near ground-truth than the adaptive linear cali- bration results most of the time. It relieves the over estimation situations compared to the Wi-Fi-only crowd estimation. However , dynamic proportional calibration is too sensitive to the extreme changes of correlations during peak hours. By contrast, the adaptive linear calibration can provide more accurate r esults during peak hours. Next, we investigate ho w the number of training data points (i.e., the value of q ) aects the results when the adaptive liner calibration is adopted. The value of q is changed to 10 and 100 respectively in the experiments. Fig. 13 shows the e xperimental results. Interestingly , having mor e training data points is not always good or necessary especially for an environment with more uncertainties. A larger value of q is not CrowdEstimator MobiSys’18, June 10–15, 2018, Munich, Germany Calib r a t ion c h o k e p o in t Wi - Fi sn if f er 1 Wi - Fi sn if f er 3 Wi - Fi sn if f er 4 Wi - Fi sn if f er 5 St er eo sc o p ic c ame r a Wi - Fi sn if f er 2 A Wi - Fi sn if f er mo u n t ed o n a c o n t ain er in t h e sh o p p in g mall. 0 0.5 1 1.5 2 2.5 04/14 (Fri) 04/16 (Sun) 04/18 (Tue) 04/20 (Thu) 04/22 (Sat) 04/24 (Mon) Correlation coefficient Time (a) The deployment in Re:ST ART mall in Christchurch. (b) The correlation coecients ( a i ). 0 50 100 150 200 250 300 350 400 450 500 04/14 (Fri) 04/16 (Sun) 04/18 (Tue) 04/20 (Thu) 04/22 (Sat) 04/24 (Mon) Number of detected people Time Total number of detected people (camera) 0 100 200 300 400 500 600 700 800 04/14 (Fri) 04/16 (Sun) 04/18 (Tue) 04/20 (Thu) 04/22 (Sat) 04/24 (Mon) Estimated crowd size Time Wi-Fi-only crowd estimation (before calibration) Dynamic proportional calibration (after calibration) (c) The near ground-truth using the stereoscopic camera. (d) The calibration results of the Wi-Fi snier 4. Figure 8: The deployment and experimental results in the Re:ST ART mall. O ve r head ca ble t r ay C103 C104 C105 C106 M1 M2 C103 C104 C105 C106 C101 Figure 9: Deployment in the W ellington Railway Station. exible to adapt to extreme changes of correlations during peek hours and midnights because the linear functions at dierent time are almost xe d. However , having a smaller value of q opens more exible opportunities for updating the linear functions. This makes the linear functions t better to the real-time changes in the environment. Therefore, a smaller value of q oers the capabilities to adapt to the dynamic changes in the real-time system. Then, to quantify the accuracy, the root mean square errors (RMSEs) and the normalized root mean square errors (NRMSEs) are calculated when dierent algo- rithms are applied to the collecte d dataset. For each algorithm, we calculate R M S E = MobiSys’18, June 10–15, 2018, Munich, Germany Fang-Jing Wu and Gürkan Solmaz 0 2000 4000 6000 8000 10000 12000 08/03 (Thu) 08/10 (Thu) 08/17 (Thu) 08/24 (Thu) Number of detected people Time Total number of detected people (camera) 0 2000 4000 6000 8000 10000 12000 08/18 (Fri) 08/19 (Sat) 08/20 (Sun) 08/21 (Mon) 08/22 (Tue) 08/23 (Wed) 08/24 (Thu) 08/25 (Fri) 08/26 (Sat) 08/27 (Sun) 08/28 (Mon) 08/29 (Tue) Estimated crowd size Time Total number of detected people (camera) Wi-Fi-only crowd estimation at M1 (Wi-Fi) (a) The weekly pattern of the near ground-truth. (b) The observed daily pattern at the calibration choke point. 0 1 2 3 4 5 6 7 08/18 (Fri) 08/19 (Sat) 08/20 (Sun) 08/21 (Mon) 08/22 (Tue) 08/23 (Wed) 08/24 (Thu) 08/25 (Fri) 08/26 (Sat) 08/27 (Sun) 08/28 (Mon) 08/29 (Tue) Correlation coefficient Time 0 2000 4000 6000 8000 10000 12000 14000 08/18 (Fri) 08/19 (Sat) 08/20 (Sun) 08/21 (Mon) 08/22 (Tue) 08/23 (Wed) 08/24 (Thu) 08/25 (Fri) 08/26 (Sat) 08/27 (Sun) 08/28 (Mon) 08/29 (Tue) Estimated crowd size Time Dynamic proportional calibration at M2 (after calibration) Wi-Fi-only crowd estimation at M2 (before calibration) (c) The correlation coecients at the calibration choke point. (d) The calibration results of M2. Figure 10: The experimental results in the W ellington Railway Station. (a) A heat map at Re:ST ART mall in Christchurch. (b) A heat map in the Welling ton Railway Station . Figure 11: Visualization in the two pilot studies. r Í s i = 1 ( ˜ e i − д i ) 2 s , where s is the total number of the time windo ws in the dataset, ˜ e i is the crowd estimation using a particular algorithm at the time window t i , and д i is the near ground-truth provided by the stereoscopic camera C101 at the time win- dow t i . Then, the NRMSE is dened by N R M S E = R M S E max s i = 1 д i − min s i = 1 д i . Fig. 14 and Fig. 15 show the evaluation results of RMSEs and NRMSEs. Both of the two proposed calibration algorithms improve the accuracy of crowd estimation compared to the Wi-Fi-only approach. The proposed calibration algorithms can reach a maximum nor- malized root mean square error of 0.25. Overall, the dynamic proportional calibration provides better crowd estimation accuracy compared to the other algorithms. It also incurs lower computational complexity compared to the adaptive linear calibration which requires a historical set of training data points. T able 4 shows the statistics of errors compared to the near ground-truth when dierent approaches are applied. The proposed calibration algorithms reduce an average error of 43 . 68% compared to the Wi-Fi-only approach. 0 2000 4000 6000 8000 10000 12000 14000 08/18 (Fri) 08/19 (Sat) 08/20 (Sun) 08/21 (Mon) 08/22 (Tue) 08/23 (Wed) 08/24 (Thu) 08/25 (Fri) 08/26 (Sat) 08/27 (Sun) 08/28 (Mon) 08/29 (Tue) Estimated crowd size Time Dynamic proportional calibration at M2 Number of people detected by C101(camera) Wi-Fi-only crowd estimation at M2 (before calibration) Adaptive linear calibration at M2 with 10 samples Figure 12: Comparison between dierent calibration algo- rithms. 6 DISCUSSION W e discuss technical limitations, deplo yment issues, experience from the real-world pilots, and future work. Limitations of single-modal technology : This work is motivated by the nd- ings from our earlier pre-pilots using single-modal technology which motivate us to design the multi-modal approach. With the proposed approach, the two types of sensing technologies can comp ensate each other’s essential limitations. The Wi-Fi- only technology has unstable and invisible coverage due to nature of wireless signals, whereas vision-based technology oers visible coverage which makes verication with the real ground-truth possible. The wireless signals and packets are not reproducible even though the ev ents of crowd appearance and environmental conditions are the CrowdEstimator MobiSys’18, June 10–15, 2018, Munich, Germany T able 4: The statistics of errors. Algorithms Mean Standard deviation Minimum The 1st quartile The 2nd quartile The 3rd quartile Maximum Wi-Fi-Only 1303 1589 -4919 1040 1373 1825 4875 Dynamic proportional 659 1093 -28 69 245 590 5699 Adaptive linear( q=10) 686 1462 -4190 84 427 1340 5694 Adaptive linear( q=100) 734 1447 -5546 635 880 1181 5694 0 1000 2000 3000 4000 5000 6000 7000 8000 08/18 (Fri) 08/19 (Sat) 08/20 (Sun) 08/21 (Mon) 08/22 (Tue) 08/23 (Wed) 08/24 (Thu) 08/25 (Fri) 08/26 (Sat) 08/27 (Sun) 08/28 (Mon) 08/29 (Tue) Estimated crowd size Time Number of people detected by C101(camera) Adaptive linear calibration at M2 with 10 samples Adaptive linear calibration at M2 100 samples Figure 13: Adaptive linear calibration results with dierent numbers of training data points. 0 500 1000 1500 2000 Wi-Fi-Only Dynamic proportional Adaptive linear (q=10) Adaptive linear (q=100) Root mean square error (RMSE) Algorithms Wi-Fi-Only Dynamic proportional calibration Adaptive linear calibration, q=10 Adaptive linear calibration, q=100 Figure 14: RMSEs when dierent algorithms are applie d. 0 0.05 0.1 0.15 0.2 0.25 0.3 0.35 Wi-Fi-Only Dynamic proportional Adaptive linear (q=10) Adaptive linear (q=100) Normalized root mean square error (NRMSE) Algorithms Wi-Fi-Only Dynamic proportional calibration Adaptive linear calibration, q=10 Adaptive linear calibration, q=100 Figure 15: NRMSEs when dierent algorithms are applie d. same. By contrast, with the same events, measurements of people counting are repeat- able and reproducible with vision-based technology . Wi-Fi-only approach may result in a lower accuracy due to uncertain mobility speeds, multiple devices carried by a single person, and more complex environmental conditions, whereas the vision-base d technology oers deterministic results. On the other hand, the Wi-Fi-only technology oers a better solution to privacy preservation compared to the vision-based tech- nology and might be more applicable to many regions due to legal regulations. The Wi-Fi-only technology is more exible for large-scale use-cases required by various stakeholders, whereas the vision-based technology may be limited by the brightness, sizes of targeted areas, and invisibility due to nearby obstacles. The Wi-Fi-only tech- nology oers low-cost deployment and incurs the less communication overhead for data collection compared to collecting videos or images. Requirements for deployment : The pilot studies are conducted in pedestrians areas without much vehicle trac (such as a train station with a few entrances and a shopping mall with a main entrance ar ea). The targeted environments have some burst pedestrian trac such as sport events and daily commuters. A main junction or entrance is preferred to be selected as the calibration choke point due to having more chances to capture most of pedestrians. Distances between the calibration choke point and other Wi-Fi sniers are not far , and the distributions of pedestrians in these zones are similar. Thus, the correlation learned from the calibration choke point is applicable to these zones. Our system uses the o-the-shelf stereoscopic cameras for counting people [ 27 ]. T o collect the near ground-truth, the stereoscopic cameras should look vertically downwards and visually cover all possible passage areas. This can be achieved by mounting the cameras on the ceilings below which the passage area is not very wide. These constraints limit the usage of stereoscopic cameras to only certain choke points where people are suppose d to pass through such as the entrance gates of a shopping mall. However , the proposed algorithms are not limite d to the stereoscopic cameras. Other o-the-shelf cameraes can be used to perform people counting [ 20 ][ 23 ]. Alternative options for vision-based people counting could exploit some of the existing real-time object detection approaches [ 24 ] with normal CCTV cameras. Privacy-by-design me chanisms are implemented in the proposed system at a low cost, where the privacy-sensitive data in Wi-Fi packets is pre-processed as anonymous data by hashing and salting mechanisms b efore the proposed algorithms are applied. System limitations and lessons from real-world pilots : This paper proposes dynamically applying the learned correlations at the calibration choke points to larger scales with less costly Wi-Fi snier deployment. While a corr elation at a calibration choke point may not be fully applicable to all neighboring zones, it still provides higher accuracy as shown in the experimental evaluation. Our pilot experience shows us that correlating Wi-Fi sniers with cameras has certain limitations. For instance, in a crowded open area which does not hav e certain entrance gates such as a beach area, the stereoscopic camera’s results cannot be regarded as the near-ground truth. T o make verication possible, camera deployment should cover most entrance areas for capturing the near ground-truth at the calibration choke p oints. For example, a “virtual” camera is formed by multiple cameras to cover all entrances of the platforms in the W ellington Railway Station. As expected, areas having many entrance points cause higher costs of deployment. Although the pr oposed approach is applicable to various medium to large-scale urban areas, it does not take the places with heavy vehicle trac into account. Considering more comple x environments with vehicles could be a future research direction. 7 CONCLUSION This paper exploits the Wi-Fi probes and computer vision technology to build the crowd estimation IoT service. This service can provide real-time crowd estimation results across dierent Io T systems. Using only Wi-Fi probes to estimate crowd sizes may lead to crowd o verestimation or crow d underestimation. A uxiliar y stereoscopic cameras are introduced to colle ct the near ground-truth for further calibration. An outdoor pilot study has been launche d in the Re:ST ART mall in Christchurch, and an indoor pilot study has been launched in the W ellington Railway Station to verify the developed cross-modal crow d estimation Io T service. The crowd estimation results are available through the Io T platform for supporting diverse real-time IoT applications. MobiSys’18, June 10–15, 2018, Munich, Germany Fang-Jing Wu and Gürkan Solmaz 8 A CKNO WLEDGMEN T This work was funded by the joint project collaborations be- tween NEC New Zealand and NEC Laboratories Europe and be- tween NEC Laboratories Europe GmbH and T echnische Univer- sität Dortmund, and has been partially funded by the European Union’s Horizon 2020 Programme under Grant Agreement No. CNECT -ICT-643943 FIEST A -Io T: Fe derated Interoperable Semantic Io T Testbeds and Applications. The content of this paper does not reect the ocial opinion of the European Union. Responsibility for the information and views expressed therein lies entirely with the authors. REFERENCES [1] 2012. NGSI Context Management Specication . Te chnical Report. Open Mobile Alliance (OMA). [2] Utku Günay Acer , Geert V anderhulsty , Afra Mashhadiy , and Aidan Boran. 2016. Capturing Personal and Crowd Behavior with Wi-Fi Analytics. In International W orkshop on Physical A nalytics (WP A) . 43–48. [3] Fadi Al- T urjman, A ysu Betin-Can, Enver Ever , and Sinem Alturjman. 2016. Ubiq- uitous Cloud-Based Monitoring via a Mobile App in Smartphones: An O verview . In IEEE International Conference on Smart Cloud . 196–201. [4] Amazon. 2018. Amazon Simple Queue Ser vice. https://aws.amazon.com/sqs/. (2018). [5] Martin Bauer , Ernö Kovacs, Anett Schülke, N. Ito, Carmen Criminisi, Laurent- W alter Goix, and Massimo V alla. 2010. The Context API in the OMA Next Gener- ation Service Interface. In Proceedings of International Conference on Intelligence in Next Generation Networks . 1–5. [6] Bin Cheng, Gürkan Solmaz, Flavio Cirillo, Ernö K ovacs, Kazuyuki Terasawa, and Atsushi Kitazawa. 2017. FogFlow: Easy Programming of Io T Ser vices Over Cloud and Edges for Smart Cities. IEEE Internet of Things Journal (2017), 1–11. https://doi.org/10.1109/JIOT .2017.2747214 [7] Cristian Chilipirea, Andreea-Cristina Petre, Ciprian Dobre, and Maarten van Steen. 2016. Presumably Simple: Monitoring Crowds Using WiFi. In IEEE Inter- national Conference on Mobile Data Management (MDM) . [8] Saandeep Depatla and Y asamin Mosto. 2018. Crowd Counting Through W alls Using WiFi. In IEEE Pervasive Computing and Communications . to app ear . [9] Saandeep Depatla, Arjun Muralidharan, and Y asamin Mostof. 2015. Occupancy Estimation Using Only WiFi Power Measurements. IEEE J. Selected A reas in Comm. 33, 7 (2015), 1381–1393. [10] FIW ARE Community. 2018. FIW ARE Open Source Platform. http://w ww .- ware. org/. (2018). [11] Min Fu, Pei Xu, Xudong Li, Qihe Liu, Mao Y e, and Ce Zhu. 2015. Fast crow d density estimation with convolutional neural networks. Engineering A pplications of A rticial Intelligence 43 (2015), 81–88. [12] Haroon Idr ees and Khurram Soomroand Mubarak Shah. 2015. Detecting Humans in Dense Crowds Using Lo cally-Consistent Scale Prior and Global Occlusion Reasoning. IEEE Transactions on Pattern Analysis and Machine Intelligence 37, 10 (2015), 986–1998. [13] IEEE 802.11 W orking Group. 2016. IEEE Standard for Information technology– T elecommunications and information exchange between systems Local and met- ropolitan area networks–Specic requirements - Part 11: Wireless LAN Medium Access Control (MAC) and P hysical Layer (PH Y) Specications . IEEE. [14] Intellectual Property Intermediary (IPI). 2018. Massive Crowd Monitoring Sys- tem. (2018). https://www .ipi-singapore.org/technology-oers/massive-crow d- monitoring-system. [15] Burak Kantarci and Hussein T . Mouftah. 2014. Mobility-aware trustworthy crowd- sourcing in cloud-centric Internet of Things. In IEEE Symposium on Computers and Communications . 1–6. [16] Kai Li, Chau Yuen, and Salil Kanher e. 2015. SenseF low: An Experimental Study of People Tracking. In Proceedings of the 6th ACM W orkshop on Real W orld Wireless Sensor Networks (RealWSN ’15) . ACM, New Y ork, NY , USA, 31–34. https: //doi.org/10.1145/2820990.2820994 [17] T eng Li, Huan Chang, Meng W ang, Bingbing Ni, Richang Hong, and Shuicheng Y an. 2014. Crowded Scene Analysis: A Survey . In IEEE Transactions on Circuits and Systems for Vide o Technology . 367–386. [18] W enguang Mao, Zaiwei Zhang, Lili Qiu, Jian He, Y uchen Cui, and Sangki Yun. 2017. Indo or Follow Me Drone. In A CM Int’l Conf. on Mobile Systems, A pplications, and Services . 345–358. [19] Afra Mashhadi, Utku Günay A cer , Aidan Boran, Philipp Scholl, Claudio Forlivesi, and Fahim Kawsar . 2016. Exploring Space Syntax on Entrepreneurial Opportu- nities with Wi-Fi Analytics. In A CM International Joint Conference on Pervasive and Ubiquitous Computing . A CM, New Y ork, N Y , USA, 658–669. [20] Mobotix. 2018. Mobotix Cameras. https://www.mobotix.com/en/products/ access- control/people- counting- directions- of- movement. (2018). [21] NCS: Smart City Applications. 2018. Cr owd Detection (V CA): In- sights on Crowd Density with Video Content Analytics. https: //www.ncs.com.sg/documents/20184/73669/Cro wd+Detection%28VCA% 29.pdf/052107fc- d788- 47c5- bf30- 69251420a9ee. (2018). [22] NCS: Smart City Applications. 2018. Crowd Detection (Wi-Fi). https://www.ncs.com.sg/documents/20184/73669/Cro wd+Detection%28WiFi% 29.pdf/b65a15cf- 5290- 410b- 8e99- a21c63ccfa64. (2018). [23] Panasonic. 2018. Panasonic Cameras. https://security .panasonic.com/products/ functions/business_intelligent/. (2018). [24] Joseph Redmo, Santosh Divvala, Ross Girshick, and Ali Farhadi. 2016. Y ou only look once: Unied, real-time obje ct detection. In Proceedings of the IEEE conference on computer vision and pattern recognition . 779–788. [25] SensorInsight. 2018. People and crowd monitoring. (2018). http://sensorinsight.io/people-and-crowd-monitoring/. [26] Gürkan Solmaz and Fang-Jing W u. 2017. T ogether or Alone: Detecting Group Mobility with Wireless Fingerprints. In IEEE Int’l Conf. Comm. [27] HELLA Aglaia People Sensing T echnologies. 2017. Advanced People Sensor APS-180E. http://people- sensing.com/. (2017). [28] Jens W eppner , Benjamin Bischke, and Paul Lukowicz. 2016. Monitoring Crowd Condition in Public Spaces by Tracking Mobile Consumer Devices with Wi Interface. In The 5th W orkshop on Pervasive Urban Applications with Ubicomp (UbiComp ’16) . A CM, New Y ork, N Y , USA, 1363–1371. https://doi.org/10.1145/ 2968219.2968414 [29] Guojun Wu, Yichen Ding, Y anhua Li, Jie Bao, Yu Zheng, and Jun Luo. 2017. Mining Spatio-T emp oral Reachable Regions over Massive Trajectory Data. In IEEE International Conference on Data Engineering (ICDE) . 1283–1294. [30] W ei Xi, Jizhong Zhao, Xiang-Y ang Li, Kun Zhao, Shaojie T ang, Xue Liu, and Zhiping Jiang. 2014. Electronic Frog Eye: Counting Cro wd Using WiFi. In IEEE INFOCOM . 361–369. [31] Sijie Xiong, Sujie Zhu, Yisheng Ji, Binyao Jiang, and Xiaohua Tian. 2017. iBlink: Smart Glasses for Facial Paralysis Patients. In ACM Int’l Conf. on Mobile Systems, A pplications, and Services . 359–370. [32] Chenren Xu, Bernhard Firner , Robert S. Moore, Y anyong Zhang, W ade Trappe, Richard Howard, Feixiong Zhang, and Ning An. 2013. SCPL: Indoor Device- Free Multi-Subject Counting and Localization Using Radio Signal Strength. In ACM/IEEE Int’l Conf. on Information Processing in Sensor Networks . 79–90.
Original Paper
Loading high-quality paper...
Comments & Academic Discussion
Loading comments...
Leave a Comment