Probabilistic duck curve in high PV penetration power system: Concept, modeling, and empirical analysis in China
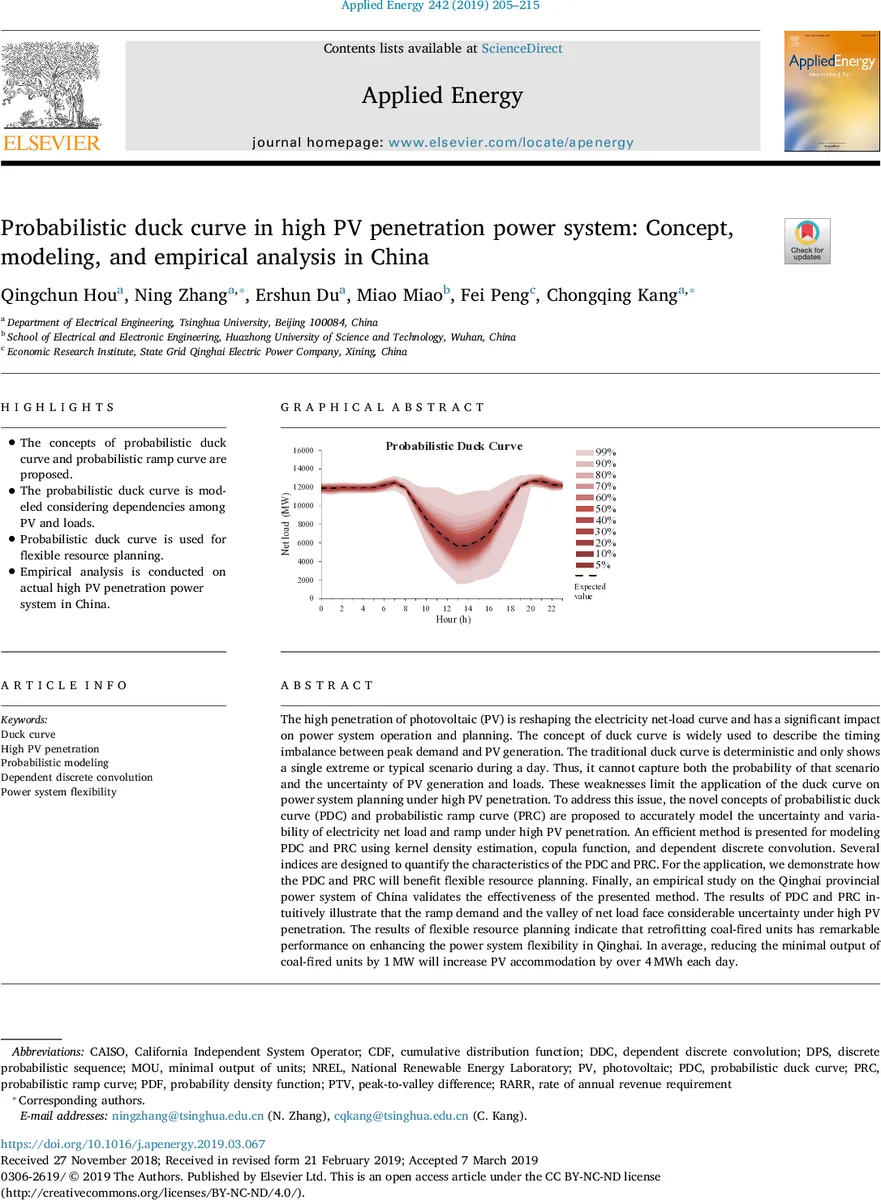
The high penetration of photovoltaic (PV) is reshaping the electricity net-load curve and has a significant impact on power system operation and planning. The concept of duck curve is widely used to describe the timing imbalance between peak demand and PV generation. The traditional duck curve is deterministic and only shows a single extreme or typical scenario during a day. Thus, it cannot capture both the probability of that scenario and the uncertainty of PV generation and loads. These weaknesses limit the application of the duck curve on power system planning under high PV penetration. To address this issue, the novel concepts of probabilistic duck curve (PDC) and probabilistic ramp curve (PRC) are proposed to accurately model the uncertainty and variability of electricity net load and ramp under high PV penetration. An efficient method is presented for modeling PDC and PRC using kernel density estimation, copula function, and dependent discrete convolution. Several indices are designed to quantify the characteristics of the PDC and PRC. For the application, we demonstrate how the PDC and PRC will benefit flexible resource planning. Finally, an empirical study on the Qinghai provincial power system of China validates the effectiveness of the presented method. The results of PDC and PRC intuitively illustrate that the ramp demand and the valley of net load face considerable uncertainty under high PV penetration. The results of flexible resource planning indicate that retrofitting coal-fired units has remarkable performance on enhancing the power system flexibility in Qinghai. In average, reducing the minimal output of coal-fired units by 1 MW will increase PV accommodation by over 4 MWh each day.
💡 Research Summary
**
The paper tackles the growing challenge of high photovoltaic (PV) penetration in power systems by extending the traditional deterministic “duck curve” into two probabilistic constructs: the Probabilistic Duck Curve (PDC) and the Probabilistic Ramp Curve (PRC). The classic duck curve, which simply plots net load (total load minus PV generation) for a single day, fails to capture the inherent variability of both load and PV output and therefore cannot inform reliable planning under uncertainty.
Key Contributions
- Conceptual Innovation – The authors define PDC as the set of probability density functions (PDFs) of net load for each hour of a day, and PRC as the PDFs of net‑load ramps between consecutive hours. Both curves embed the stochastic nature of PV and load and the dependence between them.
- Modeling Framework – A four‑stage methodology is proposed: (i) non‑parametric kernel density estimation (KDE) to obtain marginal PDFs of PV and load from historical data; (ii) Gaussian copula functions to model spatial‑temporal dependencies among multiple PV farms, loads, and between PV and load; (iii) Dependent Discrete Convolution (DDC) to combine the discretized marginal PDFs while preserving the copula‑derived dependence; (iv) derivation of PDC and PRC from the convolved PDFs. This separation of marginal fitting and dependence modeling avoids the restrictive assumptions of parametric distributions and captures complex correlation structures.
- Characteristic Indices – Several metrics are introduced to quantify the probabilistic curves: minimum net load (P_min), minimum ramp (R_min), peak‑to‑valley difference (PTV), and probabilistic area under the curve (S). These indices enable a systematic assessment of flexibility requirements.
- Empirical Validation – The methodology is applied to the Qinghai provincial power system in China, where PV capacity is projected to reach 10 GW (≈ 77 % of peak load) by 2020. Using one year of hourly PV and load data, the authors generate PDC and PRC for a typical high‑PV day. Results show a wide confidence band for the midday net‑load valley (0.6–1.4 GW at 95 % confidence) and for the evening ramp (up to 1.5 GW/h at 99 % confidence), highlighting substantial uncertainty that deterministic curves miss.
- Flexibility Planning Application – The probabilistic curves are employed to evaluate three flexibility options: (a) retrofitting coal‑fired units by lowering their minimum output (MOU), (b) installing battery energy storage, and (c) curtailing PV output. Sensitivity analysis reveals that reducing the minimum output of coal units by 1 MW increases daily PV accommodation by more than 4 MWh, making this the most cost‑effective flexibility lever in a coal‑dominant system. Battery storage can reduce the minimum net load but at higher cost per MWh, while PV curtailment only becomes economical when excess generation exceeds about 5 % of total PV capacity.
Technical Strengths – The use of KDE avoids misspecification of marginal distributions, while copula‑based dependence modeling captures the joint behavior of PV and load driven by common weather factors. DDC provides an efficient way to perform subtraction and addition of discrete probability sequences without assuming independence, a common limitation in traditional convolution approaches.
Limitations and Future Work – The study relies on Gaussian copulas, which may not fully capture tail dependence during extreme weather events; more flexible copulas (t‑copula, vine copulas) could improve extreme‑value modeling. The analysis is confined to a single region with very high PV share; extending the framework to systems with significant wind penetration or different generation mixes would test its generality. Moreover, the current focus is on hourly resolution; incorporating sub‑hourly variability and longer‑term (weekly, seasonal) dynamics would enhance planning relevance.
Conclusion – By providing a probabilistic view of net load and ramp requirements, the PDC and PRC enable power system planners to incorporate uncertainty directly into flexibility resource decisions. The empirical case in Qinghai demonstrates that probabilistic analysis can reveal cost‑effective strategies—particularly the reduction of coal‑unit minimum output—that deterministic duck‑curve studies would overlook. The methodology offers a solid foundation for future research on stochastic power‑system planning under high renewable penetration.
Comments & Academic Discussion
Loading comments...
Leave a Comment