Sequential Dynamic Resource Allocation for Epidemic Control
Under the Dynamic Resource Allocation (DRA) model, an administrator has the mission to allocate dynamically a limited budget of resources to the nodes of a network in order to reduce a diffusion process (DP) (e.g. an epidemic). The standard DRA assum…
Authors: Mathilde Fekom, Nicolas Vayatis, Argyris Kalogeratos
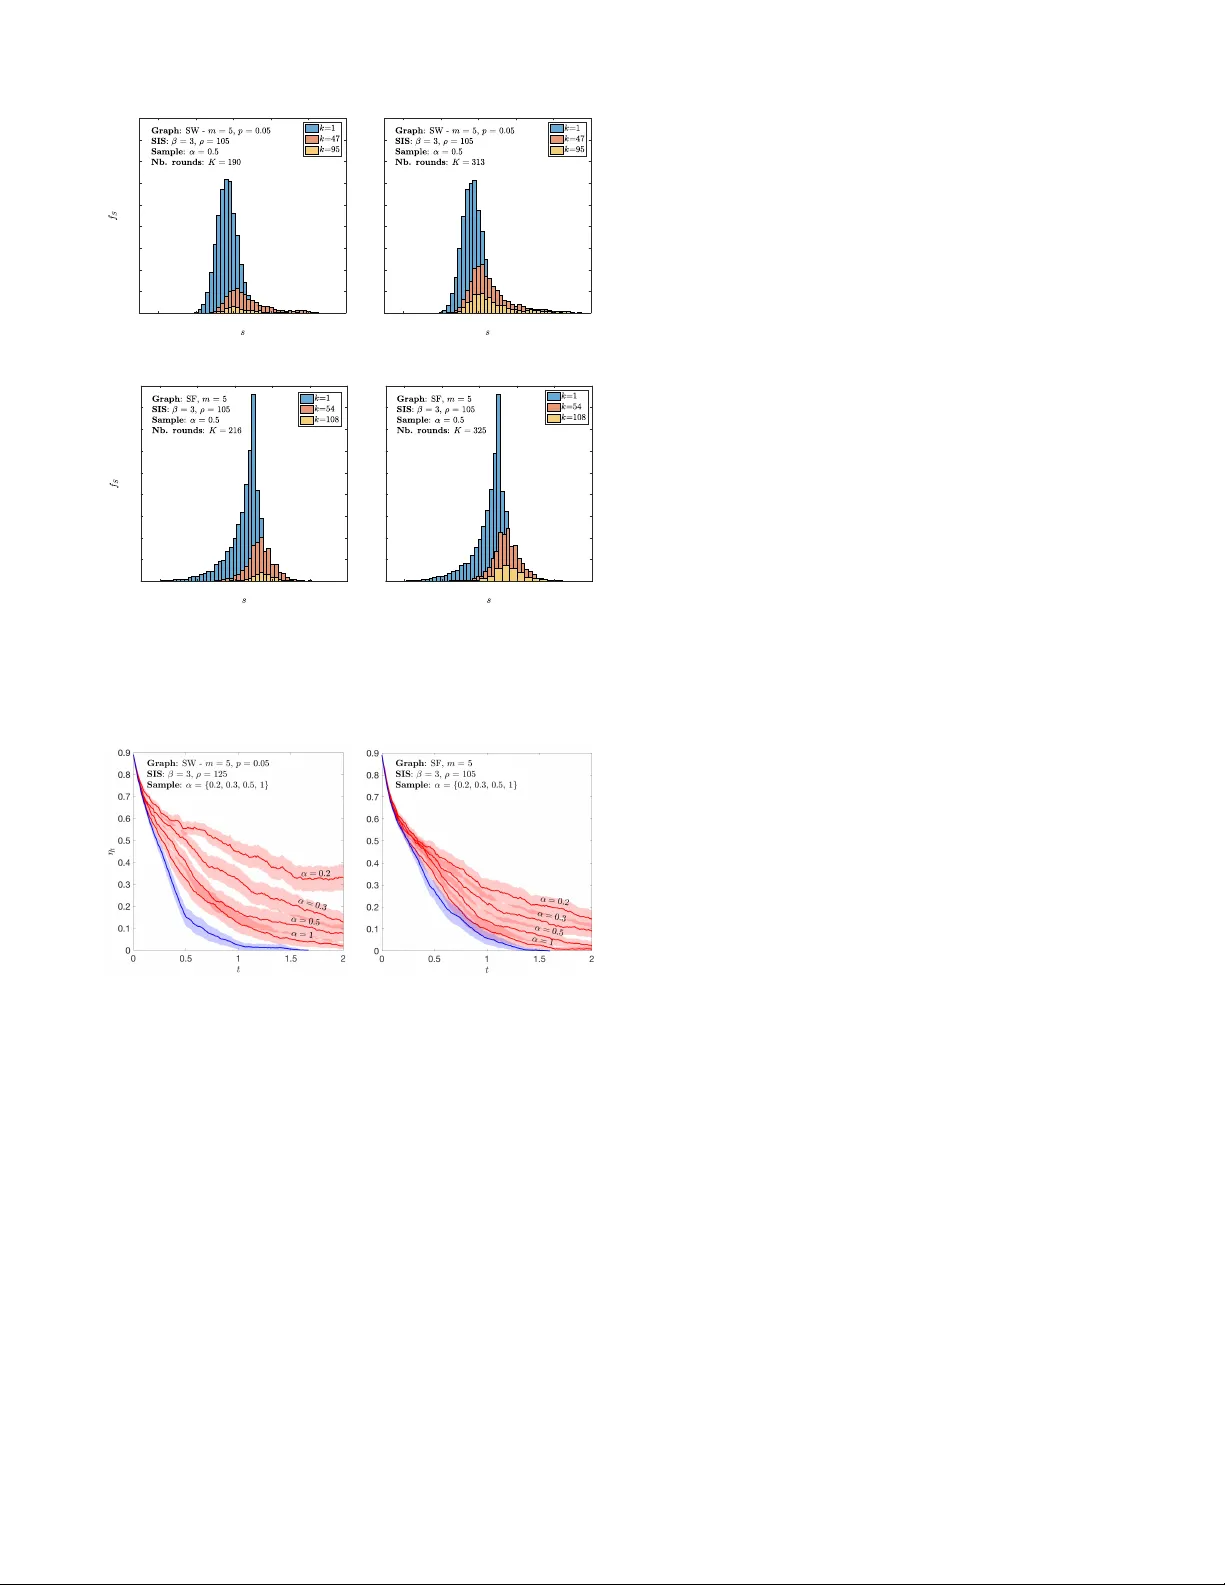
Sequential Dynamic Resour ce Allocation f or Epidemic Contr ol Mathilde Fekom Nicolas V ayatis Argyris Kalogeratos Abstract — Under the Dynamic Resource Allocation (DRA) model, an administrator has the mission to allocate dynamically a limited budget of r esources to the nodes of a netw ork in order to reduce a diffusion process (DP) (e.g. an epidemic). The standard DRA assumes that the administrator has constantly full information and instantaneous access to the entire network. T owards bringing such strategies closer to real-life constraints, we first present the Restricted DRA model extension where, at each intervention round, the access is restricted to only a fraction of the network nodes, called sample . Then, inspired by sequential selection problems such as the well-known Secretary Problem, we propose the Sequential DRA (SDRA) model. Our model intr oduces a sequential aspect in the decision pr ocess ov er the sample of each round, offering a completely new perspective to the dynamic DP control. Finally , we incorporate several sequential selection algorithms to SDRA control strategies and compare their performance in SIS epidemic simulations. I . I N T R O D U C T I O N Compartmental models hav e been extensi v ely studied in epidemiology since early last century . In recent years, they have gained much wider attention due to their simple analytic formulations that can model modern problems related to information dif fusion and social epidemics, e.g. rumor spreading [ 9 ] and other social contagions [ 7 ]. Being able to control ef ficiently undesired diffusion processes (DPs) is v ery crucial for public health and security . Y et, it is a difficult problem that in fact gets instantly much more complicated the moment one starts including more realistic constraints or objectiv es. This explains why most studies of the literature, despite pro viding high-le vel insights about the phenomena, remain rather far from being applicable in practice. A source of limitations is the theoretical interaction model one considers, along with its network-wise abstraction level (e.g. macro- vs microscopic modeling), which may be over - simplistic for the analyzed phenomenon. Another source of shortcomings is the requirement for having information regarding the system state , such as the infection state of nodes or the network connecti vity . Finally , limitations come from the way a control model assumes it can intervene to the DP, in a static or dynamic fashion to the evolution to the process, and using certain kinds of resources or actions. Dynamic Resour ce Allocation (DRA) [ 11 ], [ 12 ] is a model for network control, originally dev eloped for SIS- like processes [ 10 ] (the nodes are either infected or healthy without permanent immunity) that distributes a limited budget of av ailable treatment resources on infected nodes in order to speed-up their recov ery . The resources are non-cumulable at The authors are with CMLA – ENS Paris-Saclay , 94230 Cachan, France. Emails: { fek om, v ay atis, k alogeratos } @cmla.ens-cachan.fr . Part of this work was funded by the French Railway Company , SNCF , and the IdAML Chair hosted at ENS Paris-Saclay . nodes (i.e. each node gets at most one resource) and cannot be stored through time. The scor e-based DRA formulation introduces an elegant way , through a simple score value, of assessing the criticality of each node indi vidually for the containment of the DP . Then, the administrator only has to ensure that at each moment the resources will be spent on the infected nodes with the highest scores. Among the proposed options, a simple yet efficient local score is the Lar gest Reduction in Infectious Edges (LRIE) [ 11 ], which depends on the infection state of the neighbors, hence it needs to be updated regularly during the process. The motiv ation of our work is to bring the score-based DRA modeling closer to reality . In the majority of real- life scenarios, authorities ha ve access to limited information regarding the network state, and can reach a limited part of the population to apply control actions (e.g. deliver treatments). Even more importantly , the decision making process is essentially a sequence of time-sensitiv e decisions over choices that appear and remain available to the administrator only for short time, also with little or no margin of rev ocation. An intuiti ve paradigm to consider is how a healthcare unit works: patients arriv e one-by-one seeking for care, and online decisions try to assign the limited av ailable resources (e.g. medical experts, beds, treatments) to the most important medical cases [ 2 ], [ 8 ], [ 6 ]. By establishing a link between the DRA problem and the sequential decision making literature, our work of fers a completely new percepti ve to dynamic DP control. Among the existing Sequential Selection Pr oblems (SSP) that hav e been widely studied, the most well-kno wn is the Secretary Problem [ 5 ]. Our aim, ho we ver , is to propose a concordant match to the DP control setting described abov e. Concerning our technical contrib ution, we first present the Restricted DRA (RDRA) model, in which each time the administrator can decide the reallocation of the resources only among a random sample of currently reachable nodes. On top of that, we next propose the special case of Sequential DRA (SDRA) where the latter sample of nodes is provided with a random arrival or der , forcing the administrator to decide for the resource reallocation sequentially according to the characteristics of the incoming nodes. W e believ e that the major achie vement of our modeling is that it manages to create a new playground where SSP algorithms can be incorporated to the DP control, and this way makes control strategies more applicable in real conditions. The implementation of e xisting online algorithms such as the hiring-above-the-mean [ 3 ] or ev en the more ef fectiv e Cutoff-based Cost Minimization [ 4 ], leads to SDRA strategies that manage to reduce the DP in a comparable fashion to the unrestricted DRA. I I . T H E S E Q U E N T I A L D R A A. Setting and scoring function Consider the en vironment set by a fixed network repre- sented by the graph G ( V , E ) of |V | = N nodes and |E | = E edges. T o simplify the presentation we directly suppose that the DP that takes place is a continuous-time Markov process [ 10 ], so that at each time instance t ∈ R + there can be at most one e vent of node state change in the network. In particular, we consider an SIS-like epidemic, where nodes are either healthy (susceptible to infection), or infected. The infection state of the network is denoted by X t = ( X 1 ,t , ..., X N ,t ) T ∈ { 0 , 1 } N s.t. X i,t = 1 if node i ∈ V is infected and 0 otherwise. The infection spreads from each infected node to its healthy neighbors. Nodes are equipped with self-recov ery but they nev er achiev e permanent immunity . An administrator has the mission to reduce the DP by managing a fixed budget of b ∈ N ∗ , b N , resources that help the receiving nodes leaning towards the healthy state. The resources are regarded as reusable treatments that cannot be stored through time and are non-cumulable at nodes (i.e. at most one on each node). The Dynamic Resour ce Allocation (DRA) [ 11 ], [ 12 ] dy- namically determines the resource allocation vector R t = ( R 1 ,t , ..., R N ,t ) T ∈ { 0 , 1 } N where R i,t = 1 if a treatment is allocated to node i at time t and 0 otherwise; subject to P i R i,t = b, ∀ t ∈ R + . The strategy is dynamic and adapts to the infection state. The stochastic transition rate from state x to state y at time t is giv en by p t ( x, y ) ∈ R and depends on the allocation indicated by R t . Finally p t ( x ) = ( p t ( x, y 1 ) , ..., p t ( x, y 2 N )) T ∈ R 2 N is the vector with the prob- abilities to go from the system state x to e very other possible state at time t . The scor e-based DRA assumes that there exists a scoring function s : V → R that computes a score S i,t for each node i at time t according to the mission. At any gi ven moment, the nodes with the highest scores are those to receive the resources. This class of strategies depends on the ef ficiency and the size of the av ailable budget of resources, and also on the ef ficiency of the scoring function in indicating the most critical nodes. B. Restricted Dynamic Resour ce Allocation The standard DRA strategies are b uild on the strong assumption whereby the administrator has always full in- formation and access to the network, which is apparently infeasible in many practical cases. T o relax this requirement we introduce the Restricted DRA (RDRA) model in which only a fraction of nodes are reachable at each moment. W e work with two reasonable assumptions: 1) the access to nodes and the information acquisition about them are regarded as inextricable, and 2) the set of treated nodes, C R t = { i ∈ V : R i,t = 1 } ⊂ V , ∀ t ∈ R + , is always accessible. Definition 1: Restricted Dynamic Resour ce Allocation (RDRA) strategy Π t ( I ) is a DRA strategy that includes the number of resources b ∈ N ∗ and the scoring function s : V → R . At any moment, the administrator has access to j=n 1 j=1 round 1 RDRA SDRA j=n 2 j=1 … j=n K j=1 round 2 round K Legend t t 1 t 2 t K Sample Random Order Infected node Healthy node Recovery event Infection event Evolving Process on Network … … Fig. 1. The sequential evaluation of candidates in the SDRA model. nodes in the set I ⊂ V , in addition to those currently treated, C R t ⊂ V . The strategy outputs a resource allocation vector , i.e. Π t = R t , ∀ t ∈ R + . The default is the accessible set to be I = C t , where C t is called sample and is defined below . Choosing to define I otherwise, results in special RDRA cases. Definition 2: Node sample C t is the set of accessible infected nodes at time t , C t = ( C 1 ,t , ..., C n t ,t ) ⊂ V . Its size n t = f ( X t ) ∈ N ∗ is given by f : { 0 , 1 } N → N ∗ that is a function of the infection state. The probability of observing a sample c ⊂ V , gi ven its size n ∈ N ∗ and the network state x ∈ { 0 , 1 } N , is Λ t ( c ; n, x ) = P ( C t = c | | C t | = n, X t = x ) . In short we write C t ∼ Λ t ( n, X t ) . C. Sequential Dynamic Resour ce Allocation The RDRA’ s assumption of having simultaneous access to all the nodes of a sample remains far from being realistic. Refining further the access constraints, we present the Sequential DRA (SDRA) model that is enriched with a phase of sequential processing of the sample. Same as in the standard DRA, the resource allocation is questioned whenev er there is a change in the infection state of the network. This defines what we call a r ound of allocation decisions. Definition 3: Round k is an event of (re)-allocation of resources on the network. The series of rounds is defined by the sequence of time instances ( t k ) ∈ R K characterized by the recurrence: t k = t k − 1 + min ( δ t | || X t + δ t − X t || = 1) , ∀ k ≤ K, (1) where t 0 = 0 , and K is the total number of rounds. Note that by definition a round, overall, acts at a much smaller time-scale compared to the DP. Moreov er, the round duration is further divided into n k time intervals. The purpose of introducing the concept of round is to make the reallocation Algorithm 1 DP control with Restricted DRA Input: N : population size; b : budget of resources; X 0 : initial infection state; p ( x ) : transition probability from state x to every other state; f : function that giv es the number of accessible nodes; Λ : p.d.f. of the sample; Π : Restricted DRA strategy; isSequential : specifies if the strategy is RDRA (false) or SDRA (true). Output: X : final network state, R : final allocation of the resources 1: X ← X 0 / / initialize the infection state 2: R ( randp ( b, N )) ← 1 / / initialize the resource allocation 3: while sum ( X ) 6 = 0 do 4: n ← f ( X ) / / compute the number of accessible nodes 5: C R ← find ( R = 1) / / currently treated nodes 6: C ∼ Λ( n, X ) / / generate the sample 7: if isSequential = true then 8: for j = 1 ...n do / / loop of a selection round 9: R ← Π ( C R , C j ) / / seq. update resource allocation 10: end for 11: else 12: R ← Π ( C R , C ) / / update resource allocation altogether 13: end if 14: X ← p ( X ) / / update the infection state 15: end while 16: return X , R sequential at the time-scale of the round duration, that is to create an order in which nodes of the sample are ev aluated for a treatment. This replaces the way of reassigning altogether the b treatments, which is used by DRA or RDRA strategies. Hence, the discrete index j ∈ { 1 , ..., n k } characterizes the sequential arri val order of candidates, e.g. j = 1 and j = n k are respecti vely the first and last candidates of round k . Since a round is a measure of time, each variable can be defined by its value within a round, for instance we write X k for the infection state at round k , i.e. at time instance t k . Also, the administrator gains access sequentially on incoming candidates, therefore the v ariables might depend on the index j ∈ { 1 , ..., n k } . Definition 4: Sequential DRA (SDRA) Π k ( I j ) is the RDRA strategy defined at time instances ( t k ) ∈ R + , and where I j = C j , ∀ j ≤ n k , providing a uniformly random ar- riv al order to the nodes of the sample. The way the RDRA and SDRA models operate is described in Alg. 1, an example is also depicted in Fig. 1. I I I . F R O M D P C O N T RO L T O A M U L T I - RO U N D S E Q U E N T I A L S E L E C T I O N P R O C E S S A. Link with the Sequential Selection Pr oblem (SSP) T o the best of our knowledge, our work is the first to cast the dynamic DP control as a problem where decisions are seen as in a Sequential Selection Problem (SSP). Our purpose, though, is not to develop here a new SSP but rather to resort to existing results of the field, and hence to connect the SDRA problem described in Sec. II to a suitable SSP framew ork. Features to consider are, for instance, to have single (or multiple) resource(s), finite (or infinite) horizon, scor e-based (or rank-based ) objectiv e function, etc. It turns out that the biggest difficulty to find a match to existing methods is that our setting has a set of currently treated nodes when the selection round starts, as the b resources should be constantly in effect in the network. Indeed, most SSPs consider a cold-starting selection, i.e. the administrator begins with an empty selection set. Here, each round gets initialized since the b currently treated nodes are already ‘selected’. Nonetheless, a warm-starting variant has been inv estigated in [4]. Remark 1: Since the reallocation of resources takes place upon every change of the infection state of the network, at most one node can recover between two subsequent rounds. B. W arm-starting Pr oblem Inspired by [ 4 ], we map the problem of DP control with SDRA to a succession of separate W arm-starting Pr oblem s (WSSP s), see Definition 5. Specifically , one round of the former corresponds to one instance of the latter . For con venience, within each WSSP, the round subscript k is dropped in our notations, e.g. C k becomes C . Definition 5: W arm-starting Pr oblem (WSSP) is an SSP variant described by elements of different categories: 1) Background (included in B ) a) Information • b ∈ N ∗ : fixed budget of resources, • s : V → R : scoring function s.t. S = s ( V ) ∈ R N is the score vector of the entire population, • n ∈ N ∗ : number of candidates to come. b) Initialization • C R = ( C R 1 , ..., C R b ) ⊂ V : the subset of the population, called pr eselection , to which resources are initially allocated when a round begins, i.e. R C R i = 1 , ∀ i ≤ b . 2) Process & Decisions • ( C 1 , ..., C n ) ∈ P n ( V \ C R ) : sequence of randomly incom- ing candidates for recei ving a resource, where P l ( E ) denotes the set of l -combinations of some finite set E , • ( R C 1 , ..., R C n ) ∈ { 0 , 1 } n : sequence of resource alloca- tion decisions taken; giving a resource to a candidate immediately withdraws it from a preselected indi vidual (recov ered or not), i.e. R C j = 1 ⇒ ∃ i ≤ b s.t. R C R i = 0 . 3) Ev aluation • The cost function is defined as: φ B = max R i ,i ∈C ( S · R ) − ( S · R ) ∈ R + , (2) where C = ( C R , C 1 , ..., C n ) ⊂ V . The first term of the cost function defines the highest achiev able score, while the second giv es the score obtained from the sequential decisions. The sequence of incoming candidates being a random v ariable, E [ φ B /b ] is the objectiv e function to maximize. T wo observations have to be made concerning the afore- mentioned mapping: 1) it translates the objective of the DP control, i.e. to minimize the percentage of infected nodes through time, into a SSP objective: to minimize the expected cost function of the selected items, hence, η t = E [ 1 N P i X i,t ] is closely related to E [ φ B /b ] ; 2) it is done so that during each WSSP instance, the administrator knows nothing about the infection state of the network, and simply selects online. Note that, when still having av ailable resources (e.g. allocated to preselected indi viduals that just recov ered) while reaching 1 0 1 0 1 j = 1 0 -1 Preselection …. 1 2 1 -1 -1 1 1 1 2 3 1 -1 0 -3 j = 2 j = 3 unreachable 0 -1 0 -1 resource j S infected with score S incoming at step j Legend healthy -1 -1 -3 1 1 0 0 -2 Offline 0 -1 Preselection Online 1 -1 -1 0 -3 1 0 2 5 3 1 7 6 4 8 -2 0 -1 Preselection j = n vs. Fig. 2. Example of the 3 first steps of a SDRA round. Candidate nodes are sequentially incoming w .r.t. j and possible reallocations are decided immediately; e.g. at step j = 3 a candidate is given a resource, that is withdrawn from a preselected. The result is compared to that of the RDRA (offline). the end of the sequence, then those resources are by default giv en to the last infected candidates to appear . C. Offline vs. Online In our DP context, a strategy is called offline when it systematically selects the b -best reachable nodes and immediately assigns resources to them. As explained in the first section, the notion of ‘best’ is given by an expert through the scoring function s : V → R , which prioritizes nodes according to their criticality for the spread of the DP. The way this is achiev ed is not of this paper’ s concern, it is reg arded as a ‘ black box ’. An online strategy , howe ver , can only examine candidate nodes one-by-one, see Definition 4. In Fig. 2, an example is displayed of the final resource allocation using an online and an offline strate gy . T wo resources are initially activ e, i.e. b = 2 , represented by the blue nodes in the preselection. Scores are shown inside each infected node (the higher, the more critical). Consider for instance, an online strategy that giv es a resource to each incoming node with a score higher than the average score of the preselection, here with scores { 0 , − 1 } . When the first candidate arrives ( j = 1 ) with a score of − 1 , it is not selected since it does not beat − 0 . 5 ; ho wev er the second candidate ( j = 2 ) has a score of 0 , and a resource is reallocated to it from the worse preselected node. The score threshold to beat becomes 0 . The process continues, up to the last candidate ( j = n ). Here, the cost function is 1 b φ B = (1 + 1) − (1 + 0) = 1 , where the first term is the highest achiev able av erage score (i.e. the of fline score), and the second term is the allocation resulting from the online strategy . Ideally , an ef ficient Sequential DRA strategy (online) should be as close as possible to the associated Restricted DRA strategy (of fline), regardless the scoring function; in other words, having φ B as small as possible. D. Algorithms for DP control The mapping we introduced in Sec. III-B allows and suggests the implementation of online algorithms of the SSP literature to sequentially control DPs. In particular, the focus is put on two categories of online strategies: • cutoff-based : it takes as input a given cutoff value c ∈ N ; it first rejects by default the first c incoming candidates, called the learning phase and then selects a candidate according to information gathered during the latter phase. • thr eshold-based : a particular case of cutoff-based strate- gies with c = 0 . A candidate is accepted if his score beats a specified acceptance thr eshold . W e chose one indicativ e algorithm from each of the above classes, the Cutoff-based Cost Minimization (CCM) and the hiring-above-the-mean (MEAN); whose objectives are to minimize the expected sum of the ranks, or respecti vely sum of scores scores, of the treated nodes at the end of a round. In CCM, a notion of quality q ∈ ]0 , 1[ of the preselected w .r .t. the sample has to be gi ven as input. In this paper , we set q k = φ B ,k − 1 /b, ∀ k ≤ K , where φ B , 0 = 0 . 5 . Then, a table c ∗ ( b, n, q ) ∈ N b × n is computed by tracking the lowest point of the expected rank-based cost provided in [ 4 ]. Finally , the acceptance threshold is essentially the b -th best score seen during the learning phase. For simplicity , we denote by CCM ∗ the CCM strategy with c = c ∗ ( b, n, q ) . In MEAN [ 3 ], the acceptance threshold used is the a verage score of the preselection, thus it evolv es with each selection of candidate. This strategy , although intuitive and easier to implement than CCM, reaches its limit when the preselection is of poor quality with respect to the sample (and probably also with all the population of care-seekers). W e also consider the strategy where the acceptance threshold used is their median score, MEDIAN. In the next section, both these types of algorithms are compared in various simulations. I V . S I M U L A T I O N S A. Experimental setup Network . The interactions among a population of N individ- uals are modeled by a fixed, symmetric (undirected), and unweighted network with adjacency matrix M ∈ { 0 , 1 } N × N . For each entry it holds M ij = M j i = 1 if nodes i and j are linked with an edge, or 0 otherwise. The connectivity structure is generated according to either a scale-free (SF) or a small- world (SW) network model. The characteristic of the SF type is that its node de gree distribution follows a power law , hence fe w nodes are hubs and hav e much more edges than the rest. W e use the Barab ´ asi-Albert pr efer ential attachment model [ 1 ] that starts with two connected nodes and, thereafter, connects each ne w node to m ∈ N ∗ existing nodes randomly chosen with probability equal to their normalized degree at that moment. As for the SW type, its characteristic is that nodes are reachable to each other through short paths. T o generate this structure, we use the W atts-Strogatz model [ 15 ]. This starts by arranging the N nodes on a ring lattice, each connected to m ∈ N ∗ neighbors, m/ 2 on each side. Then, with a fixed probability p ∈ [0 , 1] for each edge, it decides to rewire it to a uniformly chosen node of the network. W e use a small population size of N = 100 individuals, which howe ver is sufficient for our demonstration. By rescaling the epidemic parameters, the same phenomena can be reproduced for larger networks. Note that the model parameters to obtain each used network, are mentioned explicitly in the associated figures. Diffusion process and score-based DRA . W e introduce a continuous-time SIS Marko v process [ 14 ], [ 13 ] into a given network, which we simulate at the node-lev el. For node i , the possible state transitions at time t are: X i,t : 0 → 1 at rate β P j M ij X j,t , and X i,t : 1 → 0 at rate ρR i,t , where β is the contribution of an edge to the infection rate, and ρ is the contribution of a recei ved treatment to the node recovery rate. W e set a fixed b udget of b = 5 resources. From the above SIS formulation we have dropped the self-recovery in order to emphasize the role of the compared DRA strategies. Since in this paper our purpose is not to in vestigate the role of the different possible scoring functions, in the simulations we use a simple yet ef fi cient function called Lar gest Reduction in Infectious Edges (LRIE) [ 11 ]. For each infected node, LRIE computes the difference in number between its neighbors that are healthy to the rest that are infected; formally: S i,t = P j M ij ¯ X j,t − M j i X j,t . LRIE is greedy and dynamic, since node scores change when nodes’ infection state and/or the network structure changes. B. Results In the empirical study , our aim is to compare the perfor - mance of se veral DRA strategies Π , that follo w Alg. 1. The offline selection strategy that picks the reachable candidates with the highest scores, is always plotted with blue curve as reference (see Fig. 3, 5). At each round, a fraction α ∈ [0 , 1] of the infected nodes becomes accessible to the administrator , n t = b α P i X i,t c , which is uniformly sampled from the population, i.e. we set Λ( n, X ) to be U ( P n ( V )) . Cutoff-based vs. threshold-based strategies . Fig. 3 displays the average percentage of infected nodes η t w .r .t. time t using the compared DRA strategies on the two network types discussed earlier . W e start with the SW type at the top row , where on the left appears the cutof f-based CCM strategy with various cutoffs, and on the right variations of the threshold- based strategy , MEAN and MEDIAN. In both subfigures, CCM ∗ (red curve) is clearly the best performing approach. Also, here MEAN is a lot better than MEDIAN. Howe ver , in the respectiv e simulations on a SF network (bottom row), the curves appear to be closer together; MEAN and MEDIAN hav e no more dif ference in performance. The CCM is still (a) Cutoff-based SDRA on SW . (b) Threshold-based SDRA on SW . (c) Cutoff-based SDRA on SF . (d) Threshold-based SDRA on SF . Fig. 3. Comparison of cutoff-based and threshold-based SDRA strategies. The Restricted DRA is shown for reference; for the same reason, the proposed SDRA-CCM is also repeated in the right subfigure of each row . A verage percentage of infected nodes η t through time for SW (top row) and for SF (bottom row) networks. better , but CCM ∗ sho ws no improvement over the use of the simpler cutof f c = √ n − 1 . T o in vestigate the behavior of strategies further, in Fig. 4 we plot the score distribution D ( s ) (here, this comes from LRIE) for all the infected nodes of the network, at three dif ferent rounds (i.e. time instances) shown in dif ferent colors. The top and bottom rows refer respecti vely to SW and SF networks. Fig. 4(a) and Fig. 4(c) sho w the D ( s ) obtained using a RDRA strategy (blue curve in Fig. 3(a)), while for Fig. 3(b) and Fig. 3(d) the sequential strategy used is the CCM ∗ (red curve in Fig. 3(a)). Starting from almost identical D ( s ) per ro w at k = 1 (initialization with the same infection lev el), we observe that throughout the rounds the dif ference between the distributions of the RDRA and SDRA strategies is lar ger for SW networks. This is as expected, since in that example the two strategies hav e larger difference in performance. W e also observe that, in the case of SF networks, the D ( s ) leans tow ards a Gaussian-like shape, which explains why MEAN and MEDIAN behav e similarly , contrary to the more skewed shape obtained for a SW network. Something easy to see in these simulations is that the network structure plays a crucial role in ho w the epidemic spreads and sets the difficulty le vel to a strategy that tries to contain it. Also, the highly evolving shape of the score distribution throughout the course of rounds illustrates the challenges that SDRA strategies need to address in order to be suf ficiently effecti ve. -30 -20 -10 0 10 20 0 0.02 0.04 0.06 0.08 0.1 0.12 0.14 0.16 0.18 (a) RDRA on SW . -30 -20 -10 0 10 20 0 0.02 0.04 0.06 0.08 0.1 0.12 0.14 0.16 0.18 (b) SDRA, CCM ∗ on SW . -30 -20 -10 0 10 20 0 0.02 0.04 0.06 0.08 0.1 0.12 0.14 0.16 0.18 (c) RDRA on SF . -30 -20 -10 0 10 20 0 0.02 0.04 0.06 0.08 0.1 0.12 0.14 0.16 0.18 (d) SDRA, CCM ∗ on SF . Fig. 4. Empirical p.d.f. D ( s ) of the node scores, at different points in time, i.e. different rounds k , for SW (top row) and for SF (bottom row) networks, when applying RDRA or SDRA (the CCM ∗ ). Fig. 5. The av erage percentage of network infection though time using the sequential CCM ∗ strategy (red lines), for various fixed sample sizes. The blue curves display the associated non-sequential RDRA strategy with full access to nodes at each round (i.e. α = 1 ). Sample size . As described, the sampling is performed on the infected nodes and so far we used a fixed ratio, α = 0 . 5 . T o analyze the impact of the sample size on the ef ficiency of an CCM strategy , we plot in Fig. 5 the average percentage of infected nodes w .r .t. time for various sampling ratios. W e observe that the SDRA is less sensitiv e to the sample size on SF networks (right) than on SW networks (left). Furthermore, regardless to the network structure, increasing the sample size does not improve linearly the efficiency of the algorithm. V . C O N C L U S I O N A N D D I S C U S S I O N This study aimed tow ards bringing Dynamic Resource Allocation (DRA) strategies closer to real-life constraints. W e re viewed their strong assumption that the administrator has full information and access to all network nodes, at any moment a round of decisions takes place: anytime needed, she can instantaneously reallocate resources to any nodes indicated by a criticality scoring function. W e significantly relaxed this assumption by first introducing the Restricted DRA model, where only a sample of nodes becomes accessible at each round of decisions. Inspired by the way decisions are taken while care-seekers appear at a healthcare unit, we next proposed the Sequential DRA model that limits further the control strategy so as to hav e sequential access to only a sample of nodes selected at each round. This setting of fers a completely ne w perspective to the dynamic DP control: the administrator examines the nodes one-by-one and decides immediately and irrev ocably whether to treat them or not by reallocating treatment resources. This online problem is put in relation with recent work in the Sequential Selection literature where ef ficient algorithms have been presented for the selection of items from a sequence for which little or no information is av ailable in advance. Special mention should be made to the Multi-round Sequential Selection Pr ocess (MSSP) that has been found to be particularly fitting for handling the sequential reallocation of resources. Finally , according to our simulations on SIS epidemics, where we compared the performance of se veral variants of the abov e DP control models, we conclude that the cutoff-based CCM ∗ is a very promising approach for the setting of sequential DP control. R E F E R E N C E S [1] A.-L. Barab ´ asi and R. Albert. Emergence of scaling in random networks. Science , 286(5439):509–512, 1999. [2] R. Bekker , G. K oole, and D. Roubos. Flexible bed allocations for hospital wards. Health Care Management Science , 20(4):453–466, 2017. [3] A. Z. Broder, A. Kirsch, R. Kumar , M. Mitzenmacher, E. Upfal, and S. V assilvitskii. The hiring problem and lake Wobegon strategies. SIAM Journal on Computing , 39:1223–1255, 2009. [4] M. Fekom, N. V ayatis, and A. Kalogeratos. The warm-starting sequential selection problem and its multi-round extension. arXiv pr eprint , 2019. [5] T . S. Ferguson. Who solved the secretary problem? Statistical Science , 1989. [6] A. Gnanlet and W . G. Gilland. Sequential and simultaneous decision making for optimizing health care resource flexibilities. Decision Sciences , 40(2):295–326, 2009. [7] A. L. Hill, D. G. Rand, M. A. Nowak, and N. A. Christakis. Infectious disease modeling of social contagion in networks. PLoS Computational Biology , 6(11):e1000968, 2010. [8] S. M. Kabene, C. Orchard, J. M. Howard, M. A. Soriano, and R. Leduc. The importance of human resources management in health care: a global context. Human Resources for Health , 4(1):20, 2006. [9] A. Kalogeratos, K. Scaman, L. Corinzia, and N. V ayatis. Information diffusion and rumor spreading. In P . M. Djuric and C. Richard, editors, Cooperative and Graph Signal Processing Principles and Applications , chapter 24, pages 651–678. Elsevier , 2018. [10] P . V . Mieghem, J. Omic, and R. Kooij. V irus spread in networks. IEEE/ACM T rans. on Networking , 17(1):1–14, 2009. [11] K. Scaman, A. Kalogeratos, and N. V ayatis. A greedy approach for dynamic control of diffusion processes in networks. In IEEE Int. Conf. on T ools with Artificial Intelligence , pages 652–659, 2015. [12] K. Scaman, A. Kalogeratos, and N. V ayatis. Suppressing epidemics in networks using priority planning. IEEE T rans. on Network Science and Engineering , 3(4):271–285, 2016. [13] P . V an Mieghem. The N-intertwined SIS epidemic network model. Computing , 93(2):147–169, 2011. [14] P . V an Mieghem, J. Omic, and R. Kooij. V irus spread in networks. IEEE/ACM T rans. on Networking , 17(1):1–14, 2009. [15] D. J. W atts and S. H. Strogatz. Emergence of scaling in random networks. Natur e , 393:440 EP , 1998.
Original Paper
Loading high-quality paper...
Comments & Academic Discussion
Loading comments...
Leave a Comment