Irrelevance of linear controllability to nonlinear dynamical networks
There has been tremendous development of linear controllability of complex networks. Real-world systems are fundamentally nonlinear. Is linear controllability relevant to nonlinear dynamical networks? We identify a common trait underlying both types …
Authors: Junjie Jiang, Ying-Cheng Lai
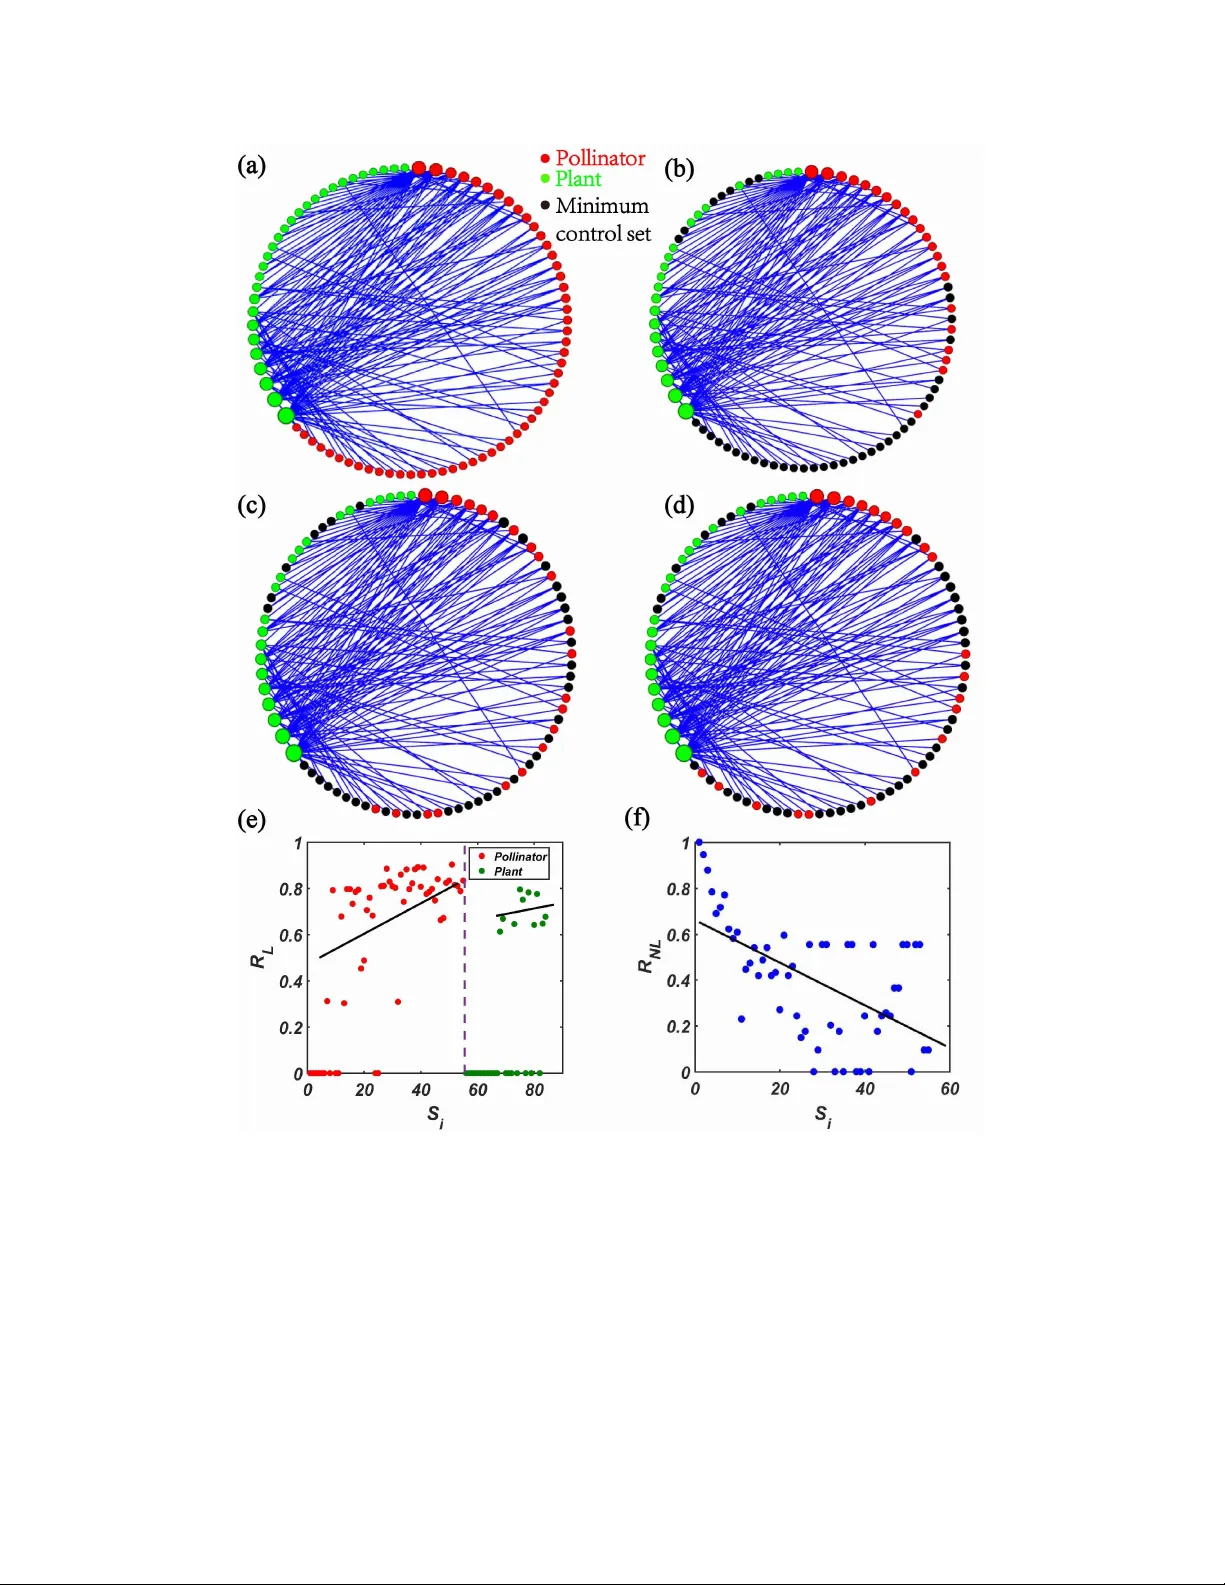
Irr elev ance of linear controllability to nonlinear dynamical networks Junjie Jiang 1 and Y ing-Cheng Lai 1, 2 1 School of Electrical, Computer and Ener gy Engineering, Arizona State University , T empe, Arizona 85287, USA 2 Department of Physics, Arizona State University , T empe, Arizona 85287, USA Abstract There has been tremendous de velopment of linear controllability of complex networks. Real-world sys- tems are fundamentally nonlinear . Is linear controllability relev ant to nonlinear dynamical networks? W e identify a common trait underlying both types of control: the nodal importance. For nonlinear and linear control, the importance is determined, respecti vely , by physical/biological considerations and the proba- bility for a node to be in the minimum driver set. W e study empirical mutualistic networks and a gene regulatory network, for which the nonlinear nodal importance can be quantified by the ability of individual nodes to restore the system from the aftermath of a tipping-point transition. W e find that the nodal impor- tance ranking for nonlinear and linear control exhibits opposite trends: for the former lar ge-de gree nodes are more important but for the latter , the importance scale is tilted to wards the small-de gree nodes, suggesting strongly irrelev ance of linear controllability to these systems. The recent claim of successful application of linear controllability to C. ele gans connectome is examined and discussed. 1 INTR ODUCTION In the de velopment of a field that in v olves dynamical systems, when knowledge has accumu- lated to certain degree, the question of control would arise naturally . For example, in nonlinear dynamics, the principle of controlling chaos was articulated in 1990 [1], after approximately a decade of intense research focusing on the fundamental understanding of chaotic dynamical sys- tems. Like wise, in complex netw orks, the issue of control began to be addressed [2, 3] also approximately after ten years of tremendous growth of research triggered by the pioneering work on small world and scale-free networks. A ke y de v elopment is the systematic adoption of the linear structural controllability theory to comple x networks with directed interactions [4]. Since then, there has been a great deal of ef fort in in vestigating the linear controllability of complex networks [5 – 21]. Control of linear dynamical systems is a traditional field in engineering [22, 23]. Because of the simplicity in the possible dynamical beha viors that a linear dynamical system can generate (in contrast to nonlinear dynamical systems where the behaviors are extremely rich and di verse), the general objectiv e is to design proper control signals to driv e the system from an arbitrarily initial state to an arbitrarily final state in finite time. When applying the linear controllability theory to complex networks, a primary goal has been to determine the minimum number of controllers. This problem was addressed [4] for comple x directed networks through the de velopment of a min- imum input theory based on the concept of maximum matching [24 – 26]. T o generalize the linear controllability theory to networks of arbitrary structures (e.g., weighted or unweighted, directed or undirected), an exact controllability theory was dev eloped [9] based on the Popov-Bele vitch- Hautus (PBH) rank condition [27]. The e xact controllability theory pro vides a computationally extremely ef ficient method to determine not only the minimum number of controllers but also the set of the nodes to which the control signals should be applied - the set of driv er nodes, for complex networks of arbitrary topology and link structures [9]. The de velopment of the linear controllability theories has played the role of stimulating re- search on controlling complex networks [28]. Howe ver , its limitations must not be forgotten. The fundamental assumption used in an y linear controllability theory is that the nodal dynamics are described by a set of coupled linear , first-order dif ferential equations. While such a setting may be rele v ant to engineering control systems, real-world systems are gov erned by nonlinear dynamics such as biologically inspired networks [29]. In classical control engineering, it is well recognized that controllability for nonlinear systems requires a different set of tools to be dev eloped compared to what is known for the controllability of linear systems [30]. A serious concern is the tendency to ov erstate the use or the predictiv e po wer of the linear controllability theories when they are ap- plied to real-world physical or biological systems. For example, it was claimed recently [31] that linear network control principles can predict the neuron function in the Caenorhabditis ele gans connectome, a highly nonlinear dynamical neuronal network. The goal of the present work is to legitimize this concern in a quantitativ e manner by presenting concrete and statistical evidence that linear netw ork controllability may not be rele vant to physically or biologically meaningful control of nonlinear networks. The physical world is nonlinear . Network dynamics in biological or ecological systems are gov erned by nonlinear rules with no e xceptions. Control of real world complex networks based on the rules of nonlinear dynamics has remained to be an e xtremely difficult problem. Existing strate- gies include local pinning [32 – 35], feedback vertex set control [36 – 38], controlled switch among 2 coexisting attractors [39], or local control [21]. These methods belong to the category of open- loop control, i.e., one applies pre-defined control signals or parameter perturbations to a feedback verte x set chosen according to some physical criteria. For certain nonlinear dynamical networks, especially those in ecology , closed-loop control can be articulated and has been demonstrated to be ef fecti v e [40]. Recently , ho w to exploit biologically inspired agent based control method to choose dif ferent alternati v e states in engineered multiagent network systems has been studied [41]. In order to answer the question “is linear controllability rele v ant to nonlinear dynamical net- works?”, two challenges must be met. Firstly , because of lack of general controllability frame work for nonlinear networks it is necessary to focus on specific contexts where nonlinear network con- trol can be done in a physically or biologically meaningful way . W e choose two such contexts: mutualistic networks in ecology [42 – 49] and a gene regulatory network from systems biology [50– 52]. Secondly and more importantly , linear and nonlinear dynamical networks are fundamentally and characteristically different in many aspects, so are the respectiv e control methods. Ho w do we compare their control performances? (Ho w can an apple be compared with a banana?) Our idea is that, ev en in the analog of apple-banana comparison, if one finds a common trait, e.g., the amount of sugar contained per gram of the substance, then a comparison between an apple and a banana in terms of the specific common trait is meaningful. W e are thus led to seek a feature or a characteristic that is common in both nonlinear and linear network control. Specifically , we identify the statistical importance of indi vidual nodes in control as such a common trait. Our approach and main result can be described, as follo ws. Gi ven a nonlinear dynamical network with its structure determined from empirical data, we focus on the concrete problem of harnessing a tipping point at which the system transitions from a normal state to a catastrophic state (e.g., massiv e extinction) or from a catastrophic state to a normal state abruptly as a system parameter changes through a critical point [45, 49, 53 – 59]. W e exploit the ability of the indi vidual nodes, via control, to make the system reco ver from the aftermath of a tipping point transition that puts the system in an extinction state. This enables a quantitati ve ranking of the importance of the indi vidual nodes to be determined. The ranking is generally found to be linearly correlated with the nodal de gree of the network, in agreement with intuition. The individual nodes, in terms of their ability to make the system reco ver , are drastically distinct. W e then perform linear control on the same network by assuming artificial linear nodal dynamics. Using the exact controllability theory [9], we calculate the minimal control set. A key feature of linear network control, which was usually not emphasized in most e xisting literature on linear controllability [5 – 21] but was mentioned in a recent paper [60], is that the minimal control set of nodes is not unique. For a reasonably large netw ork (e.g., of size of a fe w hundred), there can be v astly man y such sets that are equi v alent to each other in terms of control realization. Thus, in principle, there is a finite probability for a node in the network to be chosen as a control driv er and the corresponding probability can be calculated from the ensemble of the minimal control sets. This probability can be defined as a kind of importance of the node in control relativ e to other nodes so that a nodal importance ranking can be determined. Because of the generality and univ ersality of the linear control frame work, the method to determine the nodal importance is applicable to any complex network. For a large number of real pollinator -plant mutualistic networks reconstructed from empirical data from different geographical re gions of the world (T able II) and a representati ve gene regulatory netw ork, we find that the linear importance ranking fa v ors the small de gree nodes, in stark contrast to the case of nonlinear control where lar ge degree nodes are typically more v aluable. The characteristic difference in the importance ranking of the nodes in terms of their role 3 in control, linear or nonlinear , suggests that linear controllability may not be rele v ant to physically or biologically justified nonlinear control for the mutualistic and gene regulatory netw orks. RESUL TS A concr ete example of complex pollinator -plant mutualistic netw ork illustrating irrele vance of linear controllability The assumptions of this study are as follo ws. For linear dynamical networks, a general con- trollability frame work exists, which can be used to determine the nodal importance ranking and is applicable to all networks. For nonlinear networks, because of the rich di v ersity in their dynamics, at the present a general control framew ork does not exist. The control strategy thus depends on the specific physical or biological context of the netw ork. T o demonstrate the characteristic statistical dif ference between nonlinear and linear control, we take a representativ e pollinator-plant mutualistic network (network A ), and calculate the node based, nonlinear and linear control importance according to Eqs. (1) and (7), respecti vely , as de- scribed in Methods . Figure 1 shows the 38 pollinator and plant species, together with the relati ve nonlinear and linear control importance as represented by the lengths of the green and blue bars beneath the images, respectiv ely . There is a wide spread in the nonlinear control importance, but the linear control importance appears approximately uniform across the species. There are cases where a node is not important at all for nonlinear control (e.g., the first, fifth, and sixth species in the bottom row), but the node is important for linear control. The statistical characteristics of the nodal importance in nonlinear and linear control are thus drastically distinct. An examination of other empirical mutualistic systems rev eals that, for some networks, the beha viors are similar to those in Fig. 1, while in others, the nodal importance sho ws opposite trends in nonlinear and linear control. For example, there are cases where the nonlinear control importance tends to increase with the nodal degree, but the linear nodal importance sho ws the opposite trend. These results suggest that linear controllability may not be useful for controlling the actual nonlinear dynamical network. Nonlinear and linear control importance W e present quantitati ve results of nonlinear and linear control importance for four empirical mutualistic networks described in Methods , as sho wn in Fig. 2. For a gi ven empirical network, to calculate the nonlinear control importance based on definition (1), we begin from a zero value of the av erage mutualistic interaction strength γ 0 where the system is in an extinction state without control, apply the control by setting the ab undance of a pollinator species at A S = 1 . 5, and system- atically increase the value of γ 0 to wards a relativ ely large value (e.g., 3.0). During this process, the recovery point γ i c can be obtained. When the v alues of the recovery point for all pollinator species hav e been calculated, Eq. (1) giv es the control importance for each species, as shown in Figs. 2(a-d) for networks A − D , respectiv ely , where the index of the pollinator species on the abscissa is arranged according to the nodal degree. Apart from statistical fluctuations, there is a high le vel of positi ve correlation between the nonlinear control importance and degree, i.e., lar ger degree nodes tend to be more important. In particular , managed control of larger degree nodes is 4 FIG. 1. Distinct characteristics in nonlinear and linear control of a repr esentative complex mutu- alistic network. The system is network A reconstructed based on empirical data from T enerife, Canary Islands [61]. The numbers of pollinators, plants, and mutualistic links are N A = 38, N P = 11, and L = 106, respecti vely . For each node, the species name is giv en in T able I. The length of the green bar below each species is indicativ e of the relativ e importance of the node in tipping point control of the actual nonlinear dynamical network, which is calculated based on Eq. (1). The blue bars illustrate the relativ e importance of the nodes when the system is artificially treated as a linear , time-in v ariant network, which are calculated according to Eq. (7). There is great v ariation in the lengths of the green bars for dif ferent species, demon- strating a highly non-uniform nonlinear control importance ranking. In contrast, there is little v ariation in the length of the blue bars among the different species, indicating an approximately uniform linear con- trol importance ranking. Linear controllability may thus not be useful for controlling the actual nonlinear dynamical network. more effecti ve for species recov ery . T o obtain the linear control importance according to Eq. (7), we use 1000 random minimum controller sets as determined by the linear exact controllability to calculate the probability for each species to be chosen as a driv er node. Note that, because of the artificial imposition of linear time in v ariant dynamics on each node, there is a probability for any species to be a driv er node, regardless of whether it is a pollinator or a plant species. The results are presented in Figs. 2(e-h) for netw orks A − D , respecti vely , where the linear control importance 5 FIG. 2. Contrasting behaviors of nodal importance ranking in nonlinear and linear control . The four empirical networks are labeled as A , B , C , and D with details gi ven in Methods . (a-d) Nonlinear and (e-h) linear control importance ranking for networks A − D , respectiv ely . For tipping point control of the nonlinear network in (a-d), only the pollinator species are subject to external intervention through the managed maintenance of the ab undance of a single species. The nodal inde x on the abscissa of each panel is arranged according to the degree ranking of the node: from high to lo w degree v alues (left to right). For the set of nodes with the same degree, their ranking is randomized. The nonlinear control importance is calculated from Eq. (1) for the parameter setting h = 0 . 2, t = 0 . 5, β ( A ) ii = β ( P ) ii = 1, β ( A ) i j = β ( P ) i j = 0 , α ( A ) i = α ( P ) i = − 0 . 3, and µ A = µ P = 0 . 0001. The coupled nonlinear dif ferential equations are solv ed using the standard Runge-Kutta method with the time step 0 . 01. The distinct feature associated with nonlinear control is that, in spite of the fluctuations, larger degree nodes tend to be more important (i.e., more effecti ve in recov ering the species abundances after a tipping point). The linear control importance ranking in (e-h) can be calculated for all species based on definition (7), because the corresponding artificial linear dynamical network does not distinguish between pollinator and plant species. In each panel, the pollinators (red dots) and plants (green dots) are placed on the left and right side, respecti v ely , and are arranged in descending v alues of their degree, with a vertical dashed line separating the two types of species. The striking result is that, for the pollinators, their ranking of linear control importance exhibits a trend opposite to that of nonlinear control importance. A similar behavior occurs for ranking based on betweenness centrality and actual degrees. of the pollinators (red dots) and that of the plants (green dots) - separated by the vertical dashed line, are sho wn. The common feature among the four empirical networks is that the linear con- trol importance ranking has an opposite trend to the nonlinear control importance ranking. That is, smaller de gree nodes tend to be more important for linear control. The correlation between linear control importance and de gree is thus negati ve, which is in stark contrast to the behavior of nonlinear control importance. Overall, Figs. 2(a-h) rev eal that, for nonlinear control of tipping 6 FIG. 3. Examples of distinct minimum contr oller sets associated with linear control . F or mutualistic network E as described in Methods , (a) network structure, where the size of a circle (red and green for a pollinator and a plant, respectiv ely) is proportional to the de gree of this node, (b-d) three e xamples of mini- mum controller sets (black dots), (e) linear control importance ranking, and (f) nonlinear control importance ranking. Other parameters are the same as those in Fig. 2. points, managing lar ge de gree nodes can be significantly more ef fecti ve than harnessing small de- gree nodes, but for linear control of the same network, the large degree nodes play little role in control as they rarely appear in an y minimum controller set. The linear control importance measure, as defined in Eq. (7), is rooted in the fact that, in the 7 linear controllability theory , typically there are many equiv alent minimum controller sets [60]. It is useful to visualize such sets. Figure 3(a) e xhibits a graphical representation of an empirical mu- tualistic network - network E described in Methods , where the pollinators (red dots) and plants (green dots) are arranged along a circle, and the size of a dot is proportional to the degree of the corresponding node. By definition, mutualistic interactions mean that there are no direct links between any pair of dots with the same color - any link in the network must be between a red and a green dot. For this netw ork, there are altogether approximately 10 12 minimum controller sets of exactly the same size - three examples are shown in Figs. 3(b-d), respecti vely , where the driv er nodes are represented by black dots. A feature is that the minimum controller sets tend to a v oid nodes of very large de grees in the netw ork, which is consistent with the results in Fig. 2. The corresponding linear and nonlinear control importance rankings are shown in Figs. 3(e) and 3(f), respecti vely . A comparison of these results indicates that the ranking behaviors are characteristi- cally distinct, suggesting the difference between linear controllability and nonlinear control - the same message con veyed by Fig. 2. Gene regulatory networks The opposite beha viors in the nodal importance ranking for linear controllability and nonlinear control also arise in gene regulatory networks. F or such networks, tipping point dynamics similar to those in mutualistic networks can occur when a biological parameter is reduced, rendering feasible a similar control strate gy (see Methods ). Figure 4 sho ws, for the netw ork of S. cer evisiae described in Methods , the nonlinear and linear control importance rankings for two subnetw orks: the giant component (a,c) and the subnetwork of all nodes with input connections (b,d). Because of the dense connectivity in the giant component subnetwork, for linear control the size of the minimum controller set is N D = 4 (c). For the subnetwork in (b,d), we have N D = 17. Note that, for nonlinear control of the subnetwork (b), there are sev eral genes that hav e zero nonlinear control importance, i.e., external management of the activ ation le vel of an y of these genes is unable to restore the network function destro yed by a tipping point transition. The striking finding is that, for linear control, these genes are e xceptionally important because the probability for any of these genes to belong to a minimum controller set is disproportionally high (e.g., > 80%). If one follows the prediction of the linear controllability theory to identify those nodes as important and attempts to use them as the rele vant nodes for actual control of the nonlinear network, one would be disappointed as harnessing any of these genes will hav e no effect on the tipping-point dynamics of the network. The occurrence of such genes with zero nonlinear control importance is the result of the interplay between the Holling-type of nonlinear dynamics and the comple x network structure. Pearson corr elation and cosine distance For the fi v e mutualistic networks ( A − E ) and two gene regulatory subnetworks tested so far , the correlation between nonlinear and linear control importance is ne gati ve, as sho wn in Figs. 2-4. T o test if this holds for a broad range of empirical networks, we calculate the Pearson correlation and the cosine distance between linear and nonlinear control importance for a lar ge number of real networks, as shown in Fig. 5. In most cases, the correlation is negati ve and the cosine distance 8 FIG. 4. Nodal importance rankings associated with nonlinear and linear control of a gene r egulatory network. (a,c) Nonlinear and linear control importance rankings for the subnetwork of the giant component of size 60, respectively . In (a), there are four nodes with R N L = 1, because controlling any of these genes will make the system recov er immediately from the tipping point collapse when the direction of the change in the bifurcation parameter is re versed. For linear control in (c), the size of any minimum controller set is N D = 4. (b,d) Nonlinear and linear nodal importance rankings for the subnetwork of 81 nodes with input connection. In (b), there are sev eral genes with R N L = 0, as each gene in this group lacks the ability to restore the entire system e ven when its activity lev el is maintained at a high lev el through external control. For linear control in (d), any minimum controller set has N D = 17 nodes. In all panels, the nodal index along the abscissa is arranged in the descending order of the outgoing degrees of the genes. is large. There are a fe w mutualistic netw orks with positiv e b ut small correlation. Out of the 43 mutualistic networks, only one has a large correlation value and a small cosine distance (one corresponding to the rightmost green circle). A peculiar feature of this network is that it has only six pollinator species and an y minimum controller set in linear control contains four such species, 9 FIG. 5. Pearson correlation and cosine distance between linear and nonlinear control importance . The abscissa and ordinate correspond to the v alues of Pearson correlation and cosine distance, respecti vely , between linear and nonlinear control importance. Each green circle corresponds to a real mutualistic net- work (there are 43 of them) and the two red dots are for the two gene regulatory subnetworks in Fig. 4. If there were a kind of relev ance between nonlinear and linear control of the same network, the dots would concentrate in the lo wer right region of the plane with positiv e Pearson correlation and a small cosine dis- tance. For most of the empirical networks tested, the dots are in the region of negati ve correlation with cosine distances below 0.4. For the two gene regulatory subnetworks, not only are the v alues of the Pearson correlation negati ve, the cosine distances are also large. rendering atypical this case. Our detailed comparison between the control importance ranking in a type of biologically meaningful nonlinear control and in linear control for a large number of real pollinator-plant mu- tualistic networks and a gene re gulatory network provides e vidence that linear controllability may generate results that are drastically inconsistent with nonlinear dynamical beha viors and control of the system. In no way should this be a surprise, as the assumption of linear , time-in variant dynam- ics cannot be e xpected to hold for nonlinear dynamical netw orks in the real world. Howe v er , there 10 is a recent tendency to apply the linear controllability framework to real-world nonlinear systems such as the C. ele gans connectome [31] and brain networks[62 – 65]. Although the linear control frame work may provide insights into nonlinear dynamical networks under some specific circum- stances, controlling highly nonlinear dynamical networks is still an open problem at the present. Nonetheless, a thorough analysis of the linear controllability w ould gi v e clues to its inappropriate- ness and likely failure in real w orld systems (see Appendix A and Figs. 7 and 8). DISCUSSION It is apparent that the assumption of linear , time in v ariant nodal dynamics is not compatible with natural systems in the real world that are gov erned by nonlinear dynamical processes. Why then study the linear controllability of comple x netw orks? There were two reasons for this. Firstly , when the dev elopment of the field of complex network had reached the point at which the prob- lem of control emerged as a forefront problem (around 2011), to adopt linear controllability , a well established framework in traditional control engineering, to complex networks seemed to be a natural starting point. The well de veloped mathematical foundation of linear control made it possible to address the ef fect of complex network structure on the controllability in a rigorous manner [4, 9], physical or biological irrele v ance notwithstanding. Secondly , to study the linear controllability of complex networks is justified from the point of view of engineering, as linear dynamical systems are rele vant to subfields in engineering such as control and signal process- ing. That being said, the applicability of the linear controllability to real physical, chemical and biological systems is fundamentally limited because of the ubiquity of nonlinear dynamics in nat- ural systems - a well accepted fact, thanks to more than four decades of extensi ve and intensiv e study of nonlinear dynamics and chaos theory . It is imperati ve and a common sense understanding that the linear controllability of complex networks not be overemphasized and its importance and significance not be ov erstated. Quite contrary to the common sense understanding, there are recent claims that linear network controllability is applicable to real biological systems [31, 62 – 65] for gaining new understand- ing. Curiosity demands a thorough ree xamination of these claims. More importantly , such claims, if they are indeed unjustified b ut remain uncorrected, can potentially generate undesirable and negati ve impacts on the further de v elopment of the field of complex network control. These con- siderations moti v ated our present work. The main question we hav e set out to answer is whether linear controllability is actually rele- v ant to controlling nonlinear dynamical networks. T o be able to address this question, it is nec- essary to hav e nonlinear networked systems for which a certain type of physically or biologically meaningful control can be carried out. W e hav e identified two classes of such systems: comple x pollinator-plant mutualistic networks in ecology and gene regulatory networks in systems biology . W e focus on the physically significant issue of controlling tipping points, which enables the nodal importance in the control to be ranked. This is essentially a ranking associated with nonlinear con- trol. Ignoring the nonlinear dynamics and simply using the network structure to treat it as a linear , time-in variant system enable us to calculate the minimum controller set in the linear controllability frame work. T aking advantage of the exact controllability theory [9], we identify a large number of equi v alent configurations of the minimum controller set and find that, typically , there is a prob- ability for almost ev ery node to be in such a set. This probability serves as the base for ranking the nodal importance in linear controllability . The two types of control importance rankings, one 11 nonlinear and another linear , can then be meaningfully compared. The main finding of this paper is that the nonlinear and linear rankings are characteristically different for a large number of real world mutualistic networks and the gene regulatory network of S. cere visiae . In particular , the nonlinear control importance ranking typically exhibits a behavior that in general fa v ors high de- gree nodes. Ho we ver , linear ranking typically exhibits the opposite trend that fa v ors small degree nodes. These results are evidence that linear controllability theory generates information that is not useful for nonlinear control of tipping point dynamics in comple x biological netw orks. A quite striking finding is that, for the gene regulatory network of S. cer evisiae , there are four genes with essentially zero nonlinear control importance in the sense that managed control of any of these genes is unable to recov er the system from the aftermath of a tipping point transition. Ho we v er , in linear control, these four genes are far more important than other nodes in the network. Thus, for the particular gene regulatory network studied here, linear controllability absolutely has nothing to do with the actual control of the nonlinear dynamical network. In a recent work [31], it was claimed that linear structural controllability predicts neuron func- tion in the C. ele gans connectome. This real neuronal netw ork has about 300 neurons, which contains four different types of neurons including the sensory neurons, inter-neurons, and motor neurons. A sensory neuron can generate an action potential propagating to other neurons, while an inter-neuron can receiv e action potentials from sensory neurons or other inter-neurons. The pro- cesses of generating and propagating action potentials are highly nonlinear . The claim of Ref. [31] is thus questionable. W e find that the C. ele gans connectome, when artificially treated as a lin- ear network, is uncontrollable if the control signals are to be applied to sensory neurons only . A calculation of the linear control importance re v eals an approximately uniform ranking across all neurons. The surprising feature is that, on av erage, a muscle cell is almost twice as important as a motor neuron in terms of linear controllability , but biologically any control signal must flo w from neurons to muscle cells, not in the opposite direction. Linear controllability thus yields a result that is apparently biologically meaningless. In fact, the ability to predict neuron function is based on signal propagation from some sensory to some motor neurons, which can be accomplished through random stimulation of some sensory neurons. Because of the existence of great many equiv alent minimal control driv er sets, which sensory neuron should be chosen to deliv er a control signal is completely random. From the point of view of signal paths, there exist v astly large numbers of direct paths from the sensory to the motor neurons. Because of the approximately uniform rank- ing in nodal importance as a result of the existence of many equi v alent minimum controller sets, linear controllability theory , when being used fairly in the sense of taking into considerations of the many controller set realizations, cannot possibly yield any path that is more special than others to uncover hidden biological functions. That is, it is not necessary to use linear controllability to predict any neuron function, contradicting the claim in Ref. [31]. If control were to play a role in predicting some functions, it must be some kind of nonlinear control (which has not been achie ved so far) due to the network dynamics’ being fundamentally nonlinear . Is it possible to use linear controllability as a kind of centrality measure for comple x networks? The answer is “it depends. ” An essential requirement for such a measure is the ability to distinguish and rank the nodes in the network according to some criteria. Intuitiv ely , one would hope that the nodes in the minimum controller set may be special and bear importance relativ e to other nodes. Ho we v er , as demonstrated in our work, in a complex mutualistic network, the minimum controller set can be anything but unique. For a network of reasonable size, there is typically a vast number of equiv alent configurations or realizations of the set, a fact that w as seldom stated or studied 12 in the e xisting literature of linear controllability of complex networks. W e note that, besides the linear structural [4] and e xact [9] controllability theories, there are alternativ e frameworks such as the energy or linear Gramian based controllability [62]. Howe ver , the Gramian matrix depends on the chosen minimum controller set and the control signal input matrix. Our finding that, for some networks, almost all nodes can be in some realizations of the minimum controller set with approximately equal probability makes it difficult to use or exploit linear controllability as a centrality measure for nodal ranking, such as network A in Fig. 2(e). Howe ver , for other networks, some nodes are always or ne ver in a dri ver set, which gi ve a distribution of nodes in the minimum controller set. The distribution with respect to the topology of the network may be informati ve and characteristic of some empirical conte xts [11, 60]. The type of nonlinear control exploited in this paper for comparison with linear controllability is controlled management of the aftermath of a tipping point transition to enable species reco v ery . While this is a special type of control, its merit is rooted in the feasibility to quantify and rank the ability of individual nodes to promote recovery of the nonlinear dynamical network, so that the node-based, nonlinear control importance can be meaningfully compared with the corresponding linear control importance. Is there a more general approach to nonlinear netw ork control which can be used for comparison with linear network control? W e do not ha ve an answer at the present, as the collective behaviors of nonlinear dynamical networks are extremely div erse, so are the possible control strate gies [21, 32 – 39]. Ho we ver , re gardless of the type of nonlinear control, heterogeneity in the nodal importance ranking can be anticipated in general, due to the interplay between the nonlinear nodal dynamics and network structure. In contrast, as demonstrated in this paper , nodal importance ranking associated with linear controllability of complex networks exhibits a kind of heterogeneity opposite to that with nonlinear control, rendering linear controllability not useful for nonlinear dynamical networks in general. METHODS General principle T o obtain a statistical description of the roles played by the individual nodes and compare the nodal importance for nonlinear and linear control, we seek real world systems that meet the follo wing two criteria: (a) the underlying dynamical network is fundamentally nonlinear , for which a detailed mathematical description of the model is a vailable, and (b) there exists an issue of practical significance, with which nonlinear control is feasible. W e find that mutualistic networks with a Holling type of dynamics [66, 67] in ecology [42 – 49] and gene regulatory networks with Michaelis-Menten type of dynamics in systems biology [50 – 52] satisfy these two criteria, with respect to the significant and broadly interesting issue of controlling tipping points. Nonlinear dynamical networks W e hav e performed calculations and analyses for a large number of real-w orld pollinator -plant mutualistic networks av ailable from the W eb of Life database (http://www .web-of-life.es), which were reconstructed from empirical data collected from different geographic regions across differ - ent continents and climatic zones. The results reported in the main text are from the follo wing 13 fi ve representati ve mutualistic networks: (a) network A ( N A = 38 and N P = 11 with the number of mutualistic links L = 106) from empirical data from T enerife, Canary Islands [61], (b) network B ( N A = 79, N P = 25, and L = 299) from Bristol, England [68], (c) network C ( N A = 36, N P = 61, and L = 178) from Morant Point, Jamaica [69], (d) network D ( N A = 51, N P = 17, and L = 129) from T enerife, Canary Islands, and (e) network E ( N A = 55, N P = 29, and L = 145) from Garajonay , Gomera, Spain. As a concrete example of gene regulatory networks, we study the transcription network of S. cer evisiae of 4441 nodes, for the representati ve parameter setting [51] B = 1, f = 1, and h = 2. In spite of the large number of genes in v olved in the network, the giant connected component in which each node can reach and is reachable from others along a directed path has 60 nodes only , and the size of the component in which each and e v ery node has at least one incoming connection is 81. Nonlinear control importance ranking For con venience, here we use the term “nonlinear control importance” to mean the statistical characterization of the nodal importance when carrying out a physically meaningful type of control of the nonlinear dynamical netw ork. Especially , we focus on controlling tipping points in comple x pollinator-plant mutualistic netw orks and gene re gulatory networks. For the mutualistic networks, a typical scenario for a tipping point to occur is when the av erage mutualistic strength γ 0 is decreased tow ards zero. The tipping point occurs at a critical value γ c 0 , at which the abundances of all species decrease to near zero v alues. There is global e xtinction for γ 0 ≤ γ c 0 . When γ 0 is increased from a v alue in the extinction region (e.g., in an attempt to restore the species ab undances through improv ement of the environment), reco very is not possible without control. A realistic control strategy was articulated, in which the ab undance of a single pollinator species is maintained at a constant v alue, say A S , through external means such as human management. W e ha ve observed numerically that, in the presence of control, a full recov ery of all species abundances can be achieved - the phenomenon of “control enabled recov ery . ” For the same v alue of the controlled species level A S , the critical γ 0 v alue of the reco very point depends on the particular species (node) subject to control. A smaller recov ery point in γ 0 thus indicates that the control is more ef fecti ve, which is species dependent. The species, or nodes in the network, can then be rank ed with respect to the control. This pro vides a way to define the nodal importance associated with control of the underlying nonlinear network. In particular , let γ i c be the system recov ery point when the i th pollinator is subject to control. Choosing each and e v ery pollinator species in turn as the controlled species, we obtain a set of values of the recov ery point: { γ i c } N A i = 1 . Let γ max c and γ min c be the maximum and minimum v alues of the set. The importance of the pollinator species i associated with control of the tipping point can then be defined as R i N L = γ max c − γ i c γ max c − γ min c , (1) where 0 ≤ R i N L ≤ 1 and the control is more ef fecti ve or , equi v alently , the node subject to the control is more “important” if its corresponding v alue of R i N L is larger . For the gene regulatory netw ork, decreasing the value of the bifurcation parameter C from one will result in a tipping point at which the activities of all genes suddenly collapse to near zero 14 v alues. The behavior of sudden e xtinction at the tipping point can be harnessed by maintaining the acti vity le v el of a single acti ve gene, e.g., the most acti ve gene. In particular , when such control is present, the genes “die” in a benign way in that the death occurs one after another as the v alue of C approaches zero, effecti v ely eliminating the tipping point. W e also find that, without control, it is not possible to recover the gene activities by increasing the v alue of C , but a full recov ery can be achiev ed with control. When a different gene is chosen as the controlled target, for the same le vel of maintained activity , the recovery point on the C axis, denoted as C c , is different, which provides the base to rank the “importance” of the genes with respect to control of the nonlinear network. A gene with a relati vely smaller v alue of C c is more important, as control tar geted at it is more ef fecti v e to restore the gene acti vities in the network. Similar to our approach to ranking the control importance for the pollinator-plant mutualistic networks, we define the follo wing importance measure for gene i : R i N L = C max c − C i c C max c − C min c , (2) Where C i c is the critical expression lev el to recov er the whole system when the gene is subject to control, C max c and C min c are the maximum and minimum v alues of the recov ery point among all the genes in the network. Linear control importance ranking Here, the term “linear control importance ranking” is referred to as the statistical ranking of the nodes in terms of their roles in the control of the underlying linear dynamical network. This ranking can be determined by the exact linear controllability theory [9]. T o do so, we follow the existing studies that adv ocate the use of linear controllability for real world networked systems, such as those in Refs. [31, 62 – 65]. That is, we completely ignore the fact that the mutualistic net- work system and the gene re gulatory network are highly nonlinear dynamical systems and instead treat them fictitiously as linear dynamical netw orks. For a network of N nodes whose connect- ing topology is characterized by the adjacent matrix A , the linear control problem is formulated according to the follo wing standard setting of canonically linear , time-in variant dynamical system: d x ( t ) d t = A · x ( t ) + B · u ( t ) , (3) where x ( t ) ≡ ( x 1 ( t ) , ..., x N ( t )) T is the state v ector of the system, B is the N × M input matrix ( M ≤ N ) that specifies the control configuration - the set of M nodes (dri v er nodes) to which exter- nal control signals u ( t ) = ( u 1 ( t ) , ..., u M ( t )) T should be applied. In general, the linear networked system Eq. (3) can be controlled [70] for properly chosen control v ector u and for M ≥ N D , where N D is the minimum number of external signals required to fully control the network. The classic Kalman controllability rank condition [22] states that, system Eq. (3) is controllable in the sense that it can be driv en from any initial state to any desired final state in finite time if and only if the follo wing N × N M controllability matrix C = ( B , A · B , A 2 · B , . . . , A N − 1 · B ) , has full rank: rank ( C ) = N . 15 FIG. 6. Illustration of non-uniqueness of driver node set in linear network control. (a) A 10-node undirected network. Fi v e eigen values of the network connection matrix are identical: λ = − 1, so its alge- braic multiplicity is fi v e. The geometric multiplicity of this eigen value is the number of linearly dependent ro ws in the matrix λ i I N − A , which can be determined through elementary column transforms. (b) The matrix λ i I N − A and its representation after a series of elementary column transforms. The first, second, third, fifth, and eighth rows are distinct from all other ro ws, so they are linearly independent. The fourth, sixth, sev enth, ninth and tenth rows are linearly dependent rows. Because there are fi v e linearly independent and fiv e linearly dependent rows, the number of ways to choose the latter is 54. (c-f) Four distinct ways to choose the control input matrix to make the rank of the matrix λ i I N − A , B ten. For this small netw ork of size ten, any one of the nine out of the the ten nodes can be chosen to be a dri ver node. For a complex directed network, the linear structural controllability theory [23] can be used to determine N D through identification of maximum matching [4], the maximum set of links that do not share starting or ending nodes. A node is matched if there is a link in the maximum matching set points at it, and the directed network can be fully controlled if and only if there is a control signal on each unmatched node, so N D is simply the number of unmatched nodes in the network. An alternati ve linear controllability frame work, which is applicable to complex networks of ar - bitrary topology (e.g., directed or undirected, weighted or unweighted), is the e xact controllability theory [9] deriv ed from the PBH rank condition [27]. In particular , the linear system Eq. (3) is 16 fully controllable if and only if the follo wing PBH rank condition rank ( c I N − A , B ) = N , (4) is met for an y comple x number c , where I N is the N × N identity matrix. For any complex network defined by the general interaction matrix A , it was pro v en [9] that the network is fully controllable if and only if each and e very eigen v alue λ of A satisfies Eq. (4). For a set of control input matri- ces B , N D can be determined as N D = min { rank ( B ) } . An equiv alent but more practically useful criterion [9] is that, for a directed network, N D is nothing b ut the maximum geometric multiplicity µ ( λ i ) of the eigen v alue λ i of A : N D = max i { µ ( λ i ) } , (5) where λ i ( i = 1 , . . . , l ≤ N ) are the distinct eigen values of A and geometric multiplicity of λ i is gi ven by µ ( λ i ) = d im V λ i = N − rank ( λ i I N − A ) . For a directed network, the exact controllability theory giv es the same value of N D as determined by the structural controllability theory . For an undirected network with arbitrary link weights, N D is determined by the maximum algebraic multiplicity (the eigen value de generacy) δ ( λ i ) of λ i : N D = max i { δ ( λ i ) } . (6) An issue of critical importance to our w ork but which is often ignored in the existing literature on linear network controllability is the non-uniqueness of the set of the required dri ver nodes. In fact, for an arbitrary network with the v alue of N D determined, there can be a large number of equi v alent configurations of the driv er node set. This can be seen from the matrix c I N − A that appears in the PBH rank condition Eq. (4). When c is replaced by one of the eigen v alues of A , say λ i (the one with the maximum algebraic multiplicity), the matrix λ i I N − A contains at least one dependent ro w . The quantity N D is nothing but the number of linearly dependent ro ws of λ i I N − A . The control signals should then be applied to those nodes that correspond to the linearly dependent ro ws to make full rank the combined matrix λ i I N − A , B ) in Eq. (4), as illustrated in Fig. 6 for a small network of size N = 10. The ke y fact is that there can be multiple but equiv alent choices of the linearly dependent rows of the matrix λ i I N − A . For the small 10 × 10 network in Fig. 6, there are 54 such choices. The N D = 5 dri v er nodes can then be chosen from the N 0 = 9 nodes as determined by the linearly dependent rows of λ i I N − A . When the netw ork size N is large, the N D N driv er nodes can be chosen from N 0 . N nodes. Since N D N 0 , there can be great many distinct possibilities for choosing the set of driv er nodes (the number increases faster than exponential with the network size). It is thus justified to define the probability for a node to be chosen as one of the driv er nodes, so that the importance of each individual node in linear control can be determined. Specifically , the linear control importance of node i can be defined as R i L = F i / F , (7) where F is the total number of configurations of the minimum controller sets calculated and F i is the times that the i t h node appears in these configurations. The probability R i L thus giv es the linear control importance ranking of the network, which can be meaningfully compared with the nonlinear control importance ranking. 17 D A T A A V AILABILITY All rele v ant data are a v ailable from the authors upon request. CODE A V AILABILITY All rele v ant computer codes are a v ailable from the authors upon request. A CKNO WLEDGMENTS W e would like to ackno wledge support from the V anne v ar Bush Faculty Fello wship program sponsored by the Basic Research Of fice of the Assistant Secretary of Defense for Research and Engineering and funded by the Of fice of Na v al Research through Grant No. N00014-16-1-2828. A UTHOR CONTRIBUTIONS YCL concei ved the project. JJ performed computations and analysis. Both analyzed data. YCL wrote the paper with help from JJ. COMPETING INTERESTS The authors declare no competing interests. CORRESPONDENCE T o whom correspondence should be addressed. E-mail: Y ing-Cheng.Lai@asu.edu. A ppendix A: Linear controllability of C. elegans connectome W e report results from a linear controllability analysis of C. ele gans connectome, whose net- work structure is shown in Fig. 7(a). In a recent work [31], the neural network was treated as a linear , time in v ariant dynamical system with control input signals applied to sensory neurons. It was found that such a control signal would propagate to some motor neurons, and the remo v al of one such neuron (that had not been identified previously) would af fect the muscle mo vement or function [31]. W e hav e calculated that the size of the minimum controller set is quite lar ge: N D = 101, which means that, since there are only 86 sensory neurons in C. ele gans connectome, it is not possible to control the linear network ev en when each and ev ery sensory neuron receiv es one independent dri ving signal. There are many possible ways to place the required N D = 101 control signals in the network, leading to many configurations of the minimum controller set. W e find that a typical realization of the set contains both motor neurons and muscle cells. Figures 7(b) and 7(c) display two examples of the minimum controller set, where the driv er nodes are represented by black dots. The two realizations share 43 common dri ver nodes, and the number of distinct dri vers 18 FIG. 7. Linear control importance ranking for Caenorhabditis elegans connectome. (a) A graphical representation of C. ele gans connectome. The network contains 282 neurons and 97 muscle cells, where the yellow , green, magenta, and red nodes represent sensory neurons, inter-neurons, motor neurons, and muscle cells, respectiv ely . The size of a node is proportional to the sum of its in- and out-degrees. The dynamical network is nonlinear , but a mathematical description of reasonable detail is not av ailable at the present. When the network is artificially treated as a linear , time-in variant system, the size of the minimum controller set is N D = 101. (b) Linear control importance ranking, where the index on the abscissa is arranged in a descending order of the nodal de gree (sum of in- and out-degrees). The importance distrib ution is approximately uniform across the nodes, except for a small fraction of nodes. (c,d) T wo realizations of the minimum controller set (black dots). Because of the relativ ely large size of the network, the number of distinct minimum controller sets is quite large. is 58. Note the appearance of some muscle cells in both realizations. Utilizing 1000 random real- izations, we calculate the linear control importance ranking, as shown in Fig. 7(d). It can be seen that the statistical distribution of the importance is approximately uniform for most nodes in the network, with only a fe w exceptions. There is a probability for almost an y neuron or muscle cell to belong to some specific realization of the minimum controller set. W e find that the a verage v alues of the linear control importance for the three groups of neurons (sensory , inter - and motor neurons) 19 are approximately the same: h R L i SN ≈ 0 . 230, h R L i I N ≈ 0 . 211, and h R L i M N ≈ 0 . 221. Ho we v er , the av erage linear nodal importance for muscle cells is higher: h R L i MC ≈ 0 . 399. These data indicate that the neurons in the connectome ha ve equal chance to be selected as a dri v er node, b ut a muscle cell is almost twice more likely to appear in the minimum controller set. This result contradicts a general understanding from both the biological and control perspecti ves, and has intriguing impli- cations to the rele vance of the linear controllability theory to C. ele gans connectome. Specifically , from the point of view of biology , neurons send signals to the muscle cells, b ut not the other way around. From the standpoint of actual control of the network, a biologically meaningful dri ver set should fa v or neurons. Y et the linear controllability theory gi ves the opposite result, in contrast to the claim in Ref. [31]. FIG. 8. Signal paths between sensory neur ons and motor neur ons in C. elegans . (a) The numbers of direct paths from all sensory neurons to motor neurons with path length less than or equal to sev en (yellow), six (red), and fiv e (blue). The numbers of such paths are enormous. (b) Matrix representation of all direct paths with path length less than or equal to sev en, from each and e very sensory neuron to each and e very motor neuron. In Ref. [31], some particular signal paths from the sensory neurons to a special motor neuron were identified and deemed to be particularly important based on the linear controllability theory . Does linear control really rev eal any specially important motor neurons, i.e., are there any differ - ences among the motor neurons in terms of linear control importance? T o address this question, we map out all the direct paths among the sensory and motor neurons that control the muscle cells and hence the mov ement of C. ele gans . Figure 8(a) sho ws the total numbers of direct paths of length l less than or equal to fi ve, six, and se v en from the sensory neurons to each and e very motor neuron, where the abscissa is the motor neuron index. The number of these paths is lar ge. For example, for l ≤ 7, for each and ev ery motor neuron, there are between 10 6 and 10 8 such paths. Apart from statistical fluctuations, the numbers of paths are approximately constant across all the motor neurons, suggesting the none xistence of an y special motor neuron. A matrix representation of the paths for l ≤ 7 is shown in Fig. 8(b). Between each and ev ery pair of sensory and motor 20 neurons, the number of such paths is at least of the order of 10 6 , although the numbers associated some specific paths can be about two orders of magnitude higher . A ppendix B: Description of real-world mutualistic networks (1) Anastoechus, latifrons (2) Anthophora, alluaudi (3) Apis, mellifera (4) Euodynerus, reflexus (5) Geron, hesperidon (6) Eristalis, tenax (7) Megachile, canariensis (8) Anthrax, anthrax (9) Eucera, gracilipes (10) Hyleaus, canariensis (11) Lasioglossum, viride (12) Linnaemyia, soror (13) Cephalodromia (14) Cyclyrius, webbianus (15) Estheria, simonyi (16) Lasioglossum, actifrons (17) Melecta, curvispina (18) Osmia, canariensis 19) Andrena, wollestoni (20) Colletes, dimidiatus (21) Gasteruption (22) Lucilia, sericata (23) Macroglossum, stellatarum (24) Scaev a, albomaculata (25) Stomorhina, lunata (26) Unidentified (27) Anthidium, manicatum (28) Bibio, elmoi (29) Dermasothes, gracile (30) Drosophila (31) Lasioglossum, chalcodes (32) Leptochilus, eatoni (33) Nyctia, lugubris (34) Peleteria, ruficornis (35) Phylloscopus, collybita (36) Serinus, canarius (37) T achina, canariensis (38) T achysphex, unicolor T ABLE I. All names of the species in Fig. 1 in the main text. Index # Pollinators # Plants Linkage Network Location 1 101 84 0.04 Cordn del Cepo, Chile 2 64 43 0.07 Cordn del Cepo, Chile 3 25 36 0.09 Cordn del Cepo, Chile 4 102 12 0.14 Central Ne w Brunswick, Canada 5 275 96 0.03 Pikes Peak, Colorado, USA 6 61 17 0.14 Hickling, Norfolk, UK 7 36 16 0.15 Shelfanger , Norfolk, UK 8 38 11 0.25 T enerife, Canary Islands 9 118 24 0.09 Latnjajaure, Abisko, Sweden 10 76 31 0.19 Zack enberg 11 13 14 0.29 Mauritius Island 12 55 29 0.09 Garajonay , Gomera, Spain 13 56 9 0.2 KwaZulu-Natal region, South Africa 14 81 29 0.08 Hazen Camp, Ellesmere Island, Canada 15 666 131 0.03 Daphn, Athens, Greece 16 179 26 0.09 Doana National Park, Spain 17 79 25 0.15 Bristol, England 18 108 36 0.09 Hestehaven, Denmark 19 85 40 0.08 Sno wy Mountains, Australia 21 T ABLE II – continued from pre vious page Index # Pollinators # Plants Linkage Network Location 20 91 20 0.1 Hazen Camp, Ellesmere Island, Canada 21 677 91 0.02 Ashu, Kyoto, Japan 22 45 21 0.09 Laguna Diamante, Mendoza, Argentina 23 72 23 0.08 Rio Blanco, Mendoza, Argentina 24 18 11 0.19 Melville Island, Canada 25 44 13 0.25 North Carolina, USA 26 54 105 0.04 Galapagos 27 60 18 0.11 Arthur’ s P ass, Ne w Zealand 28 139 41 0.07 Cass, New Zealand 29 118 49 0.06 Craigieburn, Ne w Zealand 30 53 28 0.07 Guarico State, V enezuela 31 49 48 0.07 Canaima Nat. Park, V enezuela 32 33 7 0.28 Brownfield, Illinois, USA 33 34 13 0.32 Otta wa, Canada 34 128 26 0.09 Chiloe, Chile 35 36 61 0.08 Morant Point, Jamaica 36 12 10 0.25 Flores, Aores Island 37 40 10 0.18 Hesteha v en, Denmark 38 42 8 0.24 Hestehaven, Denmark 39 51 17 0.15 T enerife, Canary Islands 40 43 29 0.09 W indsor , The Cockpit Country , Jamaica 41 43 31 0.11 Syndicate, Dominica 42 6 12 0.35 Puerto V illamil, Isabela Island, Galapagos 43 82 28 0.11 Hesteha v en, Denmark 44 609 110 0.02 Amami-Ohsima Island, Japan 45 26 17 0.14 Uummannaq Island, Greenland 46 44 16 0.39 Denmark 47 186 19 0.12 Isenbjerg 48 236 30 0.09 Denmark 49 225 37 0.07 Denmark 50 35 14 0.18 T enerife, Canary Islands 51 90 14 0.13 Nahuel Huapi National Park, Argentina 52 39 15 0.16 T undra, Greenladn 53 294 99 0.02 Mt. Y ufu, Japan 54 318 113 0.02 K yoto City , Japan 22 T ABLE II – continued from pre vious page Index # Pollinators # Plants Linkage Network Location 55 195 64 0.03 Nakaikemi marsh, Fukui Pre- fecture, Japan 56 365 91 0.03 Mt. Kushigata, Y amanashi Pref., Japan 57 883 114 0.02 Kib une, K yoto, Japan 58 81 32 0.12 P arc Natural del Cap de Creus 59 13 13 0.42 P arque Nacional do Catimbau T ABLE II: The 59 real pollinator-plant networks are from web- of-life (http://www .web-of-life.es). For each network, the linkage is normalized with respect to the corresponding fully connected (all-to-all) network for which the linkage is 100%. [1] E. Ott, C. Grebogi, and J. A. Y orke, “Controlling chaos, ” Phys. Rev . Lett. 64 , 1196 (1990). [2] A. Lombardi and M. H ¨ ornquist, “Controllability analysis of networks, ” Ph ys. Rev . E 75 , 056110 (2007). [3] A. Rahmani, M. Ji, M. Mesbahi, and M. Egerstedt, “Controllability of multi-agent systems from a graph-theoretic perspecti ve, ” SIAM J. Contr . Optim. 48 , 162 (2009). [4] Y .-Y . Liu, J.-J. Slotine, and A.-L. Barab ´ asi, “Controllability of complex networks, ” Nature 473 , 167 (2011). [5] W .-X. W ang, X. Ni, Y .-C. Lai, and C. Grebogi, “Optimizing controllability of complex networks by minimum structural perturbations, ” Phys. Re v . E 85 , 026115 (2012). [6] J. C. Nacher and T . Akutsu, “Dominating scale-free netw orks with variable scaling exponent: hetero- geneous networks are not dif ficult to control, ” New J. Phys. 14 , 073005 (2012). [7] G. Y an, J. Ren, Y .-C. Lai, C.-H. Lai, and B. Li, “Controlling complex networks: How much energy is needed?” Phys. Re v . Lett. 108 , 218703 (2012). [8] T . Nepusz and T . V icsek, “Controlling edge dynamics in complex networks, ” Nat. Phys. 8 , 568 (2012). [9] Z. Y uan, C. Zhao, Z. Di, W .-X. W ang, and Y .-C. Lai, “Exact controllability of complex networks, ” Nat. Commun. 4 , 2447 (2013). [10] G. Menichetti, L. Dall’Asta, and G. Bianconi, “Netw ork controllability is determined by the density of lo w in-degree and out-de gree nodes, ” Phys. Rev . Lett. 113 , 078701 (2014). [11] J. Ruths and D. Ruths, “Control profiles of complex networks, ” Science 343 , 1373 (2014). [12] S. W uchty , “Controllability in protein interaction networks, ” Proc. Natl. Acad. Sci. (USA) 111 , 7156 (2014). [13] Z.-Z. Y uan, C. Zhao, W .-X. W ang, Z.-R. Di, and Y .-C. Lai, “Exact controllability of multiplex net- works, ” New J. Phys. 16 , 103036 (2014). [14] A. J. Whalen, S. N. Brennan, T . D. Sauer , and S. J. Schiff, “Observability and controllability of nonlinear networks: The role of symmetry , ” Phys. Re v . X 5 , 011005 (2015). 23 [15] J. C. Nacher and T . Akutsu, “Structurally robust control of complex networks, ” Phys. Re v . E 91 , 012826 (2015). [16] T . H. Summers, F . L. Cortesi, and J. L ygeros, “On submodularity and controllability in comple x dynamical networks, ” IEEE Trans. Cont. Net. Syst. 3 , 91 (2015). [17] F . L. Iudice, F . Garofalo, and F . Sorrentino, “Structural permeability of complex netw orks to control signals, ” Nat. Comm. 6 , 8349 (2015). [18] Y .-Z. Chen, L.-Z. W ang, W .-X. W ang, and Y .-C. Lai, “Energy scaling and reduction in controlling complex netw orks, ” Roy . Soc. Open Sci. 3 , 160064 (2016). [19] L.-Z. W ang, Y .-Z. Chen, W .-X. W ang, and Y .-C. Lai, “Physical controllability of complex netw orks, ” Sci. Rep. 7 , 40198 (2017). [20] I. Klickstein, A. Shirin, and F . Sorrentino, “Energy scaling of targeted optimal control of complex networks, ” Nat. Comm. 8 , 15145 (2017). [21] I. Klickstein, A. Shirin, and F . Sorrentino, “Locally optimal control of complex networks, ” Phys. Re v . Lett. 119 , 268301 (2017). [22] R. E. Kalman, “Mathematical description of linear dynamical systems, ” J. Soc. Indus. Appl. Math. Ser . A 1 , 152 (1963). [23] C.-T . Lin, “Structural controllability , ” IEEE T rans. Automat. Contr . 19 , 201 (1974). [24] J. E. Hopcroft and R. M. Karp, “An n 5 / 2 algorithm for maximum matchings in bipartite graphs, ” SIAM J. Comput. 2 , 225 (1973). [25] H.-J. Zhou and Z.-C. Ou-Y ang, “Maximum matching on random graphs, ” arXiv:cond-mat/0309348 (2003). [26] L. Zdeborov ´ a and M. M ´ ezard, “The number of matchings in random graphs, ” J. Stat. Mech. 5 , 05003 (2006). [27] M. L. J. Hautus, “Controllability and observability conditions of linear autonomous systems, ” Ned. Akad. W etenschappen, Proc. Ser . A 72 , 443 (1969). [28] Y .-Y . Liu and A.-L. Barab ´ asi, “Control principles of complex systems, ” Re v . Mod. Phys. 88 , 035006 (2016). [29] R. Albert, J. Baillieul, and A. E. Motter , “Introduction to the special issue on approaches to control biological and biologically inspired networks, ” IEEE Trans. Control Netw . Syst. 5 , 690 (2018). [30] H. Nijmeijer and A. V an der Schaft, Nonlinear Dynamical Contr ol Systems , 1st ed. (Springer , 1990). [31] G. Y an, P . E. V ´ ertes, E. K. T owlson, Y . L. Chew , D. S. W alker , W . R. Schafer , and A.-L. Barab ´ asi, “Network control principles predict neuron function in the caenorhabditis elegans connectome, ” Na- ture 550 , 519 (2017). [32] X. F . W ang and G. Chen, “Pinning control of scale-free dynamical networks, ” Physica A 310 , 521 (2002). [33] X. Li, X. F . W ang, and G. Chen, “Pinning a complex dynamical network to its equilibrium, ” IEEE T rans. Circ. Syst. I 51 , 2074 (2004). [34] F . Sorrentino, M. di Bernardo, F . Garofalo, and G. Chen, “Controllability of complex networks via pinning, ” Phys. Re v . E 75 , 046103 (2007). [35] W . Y u, G. Chen, and J. L ¨ u, “On pinning synchronization of complex dynamical networks, ” Automat- ica 45 , 429 (2009). [36] B. Fiedler , A. Mochizuki, G. K urosaw a, and D. Saito, “Dynamics and control at feedback vertex sets. I: Informati ve and determining nodes in re gulatory networks, ” J. Dyn. Diff. Eq. 25 , 563 (2013). [37] A. Mochizuki, B. Fiedler , G. Kurosa wa, and D. Saito, “Dynamics and control at feedback vertex 24 sets. II: A faithful monitor to determine the diversity of molecular acti vities in re gulatory netw orks, ” J. Theo. Biol. 335 , 130 (2013). [38] J. G. T . Za ˜ nudo, G. Y ang, and R. Albert, “Structure-based control of complex networks with nonlinear dynamics, ” Proc. Natl. Acad. Sci. (USA) 114 , 7234 (2017). [39] L.-Z. W ang, R.-Q. Su, Z.-G. Huang, X. W ang, W .-X. W ang, C. Grebogi, and Y .-C. Lai, “A geometrical approach to control and controllability of nonlinear dynamical networks, ” Nat. Commun. 7 (2016). [40] Y .-Z. Sun, S.-Y . Leng, Y .-C. Lai, C. Grebogi, and W . Lin, “Closed-loop control of complex networks: A trade-of f between time and energy , ” Phys. Re v . Lett. 119 , 198301 (2017). [41] R. Gray , A. Franci, V . Sri vasta v a, and N. E. Leonard, “Multiagent decision-making dynamics inspired by honeybees, ” IEEE T rans. Control Netw . Syst. 5 , 793 (2018). [42] J. Bascompte, P . Jordano, C. J. Meli ´ an, and J. M. Olesen, “The nested assembly of plant-animal mutualistic networks, ” Proc. Natl. Acad. Sci. (USA) 100 , 9383 (2003). [43] P . R. Guimaraes, P . Jordano, and J. N. Thompson, “Evolution and coe volution in mutualistic net- works, ” Ecol. Lett. 14 , 877 (2011). [44] S. L. Nuismer , P . Jordano, and J. Bascompte, “Coev olution and the architecture of mutualistic net- works, ” Evolution 67 , 338 (2013). [45] J. J. Lev er , E. H. Nes, M. Schef fer, and J. Bascompte, “The sudden collapse of pollinator communi- ties, ” Ecol. Lett. 17 , 350 (2014). [46] R. P . Rohr , S. Saav edra, and J. Bascompte, “On the structural stability of mutualistic systems, ” Science 345 , 1253497 (2014). [47] V . Dakos and J. Bascompte, “Critical slo wing do wn as early warning for the onset of collapse in mutualistic communities, ” Proc. Natl. Acad. Sci. (USA) 111 , 17546 (2014). [48] P . R. Guimaraes, M. M. Pires, P . Jordano, J. Bascompte, and J. N. Thompson, “Indirect effects driv e coe volution in mutualistic netw orks, ” Nature 550 , 511 (2017). [49] J. Jiang, Z.-G. Huang, T . P . Seager , W . Lin, C. Grebogi, A. Hastings, and Y .-C. Lai, “Predicting tipping points in mutualistic networks through dimension reduction, ” Proc. Natl. Acad. Sci. (USA) , 201714958 (2018). [50] U. Alon, An Intr oduction to Systems Biology: Design Principles of Biological Cir cuits (CRC press, 2006). [51] S. Balaji, M. M. Babu, L. M. Iyer , N. M. Luscombe, and L. Aravind, “Comprehensive analysis of combinatorial regulation using the transcriptional re gulatory network of yeast, ” J. Mol. Biol 360 , 213 (2006). [52] J. Gao, B. Barzel, and A.-L. Barab ´ asi, “Univ ersal resilience patterns in complex networks, ” Nature 530 , 307 (2016). [53] M. Schef fer , J. Bascompte, W . A. Brock, V . Brovkin, S. R. Carpenter , V . Dakos, H. Held, E. H. V an Nes, M. Rietkerk, and G. Sugihara, “Early-warning signals for critical transitions, ” Nature 461 , 53 (2009). [54] M. Scheffer , “Complex systems: foreseeing tipping points, ” Nature 467 , 411 (2010). [55] D. B. W ysham and A. Hastings, “Regime shifts in ecological systems can occur with no warning, ” Ecol. Lett. 13 , 464 (2010). [56] J. M. Drake and B. D. Griffen, “Early warning signals of extinction in deteriorating en vironments, ” Nature 467 , 456 (2010). [57] L. Dai, D. V orselen, K. S. K orole v , and J. Gore, “Generic indicators for loss of resilience before a tipping point leading to population collapse, ” Science 336 , 1175 (2012). 25 [58] C. Boettiger and A. Hastings, “Tipping points: From patterns to predictions, ” Nature 493 , 157 (2013). [59] J. M. T ylianakis and C. Coux, “T ipping points in ecological networks, ” T rends. Plant. Sci. 19 , 281 (2014). [60] C. Campbell, S. Aucott, J. Ruths, D. Ruths, K. Shea, and R. Albert, “Correlations in the degeneracy of structurally control lable topologies for networks, ” Sci. Rep. 7 , 46251 (2017). [61] Y . L. Dupont, D. M. Hansen, and J. M. Olesen, “Structure of a plant–flo wer -visitor network in the high-altitude sub-alpine desert of T enerife, Canary Islands, ” Ecography 26 , 301 (2003). [62] S. Gu, F . Pasqualetti, M. Cieslak, Q. K. T elesford, B. Y . Alfred, A. E. Kahn, J. D. Medaglia, J. M. V ettel, M. B. Miller , S. T . Grafton, et al. , “Controllability of structural brain networks, ” Nat. Commun. 6 , 8414 (2015). [63] S. F . Muldoon, F . Pasqualetti, S. Gu, M. Cieslak, S. T . Grafton, J. M. V ettel, and D. S. Bassett, “Stimulation-based control of dynamic brain networks, ” PLOS Comput. Biol. 12 , e1005076 (2016). [64] E. T ang, G. Chad, L. B. Graham, S. Gu, E. Pollock, A. E. Kahn, D. R. Roalf, T . M. Moore, K. Ruparel, R. C. Gur , R. E. Gur , T . D. Satterthwaite, and D. S. Bassett, “Dev elopmental increases in white matter network controllability support a gro wing di v ersity of brain dynamics, ” Nat. Commun. 8 , 1252 (2017). [65] E. T ang and D. S. Bassett, “Colloquium: Control of dynamics in brain netw orks, ” Rev . Mod. Phys. 90 , 031003 (2018). [66] C. S. Holling, “Some characteristics of simple types of predation and parasitism, ” Can. Entomol. 91 , 385 (1959). [67] C. S. Holling, “Resilience and stability of ecological systems, ” Annu. Re v . Ecol. Syst. 4 , 1 (1973). [68] J. Memmott, “The structure of a plant-pollinator food web, ” Ecol. Lett. 2 , 276 (1999). [69] M. Perciv al, “Floral ecology of coastal scrub in southeast jamaica, ” Biotropica , 104 (1974). [70] W . J. Rugh, Linear Systems Theory , 2nd ed. (Prentice-Hall, New Jerse y , 1996). 26
Original Paper
Loading high-quality paper...
Comments & Academic Discussion
Loading comments...
Leave a Comment