Dependence Structure Estimation via Copula
Dependence strucuture estimation is one of the important problems in machine learning domain and has many applications in different scientific areas. In this paper, a theoretical framework for such estimation based on copula and copula entropy -- the…
Authors: Jian Ma, Zengqi Sun
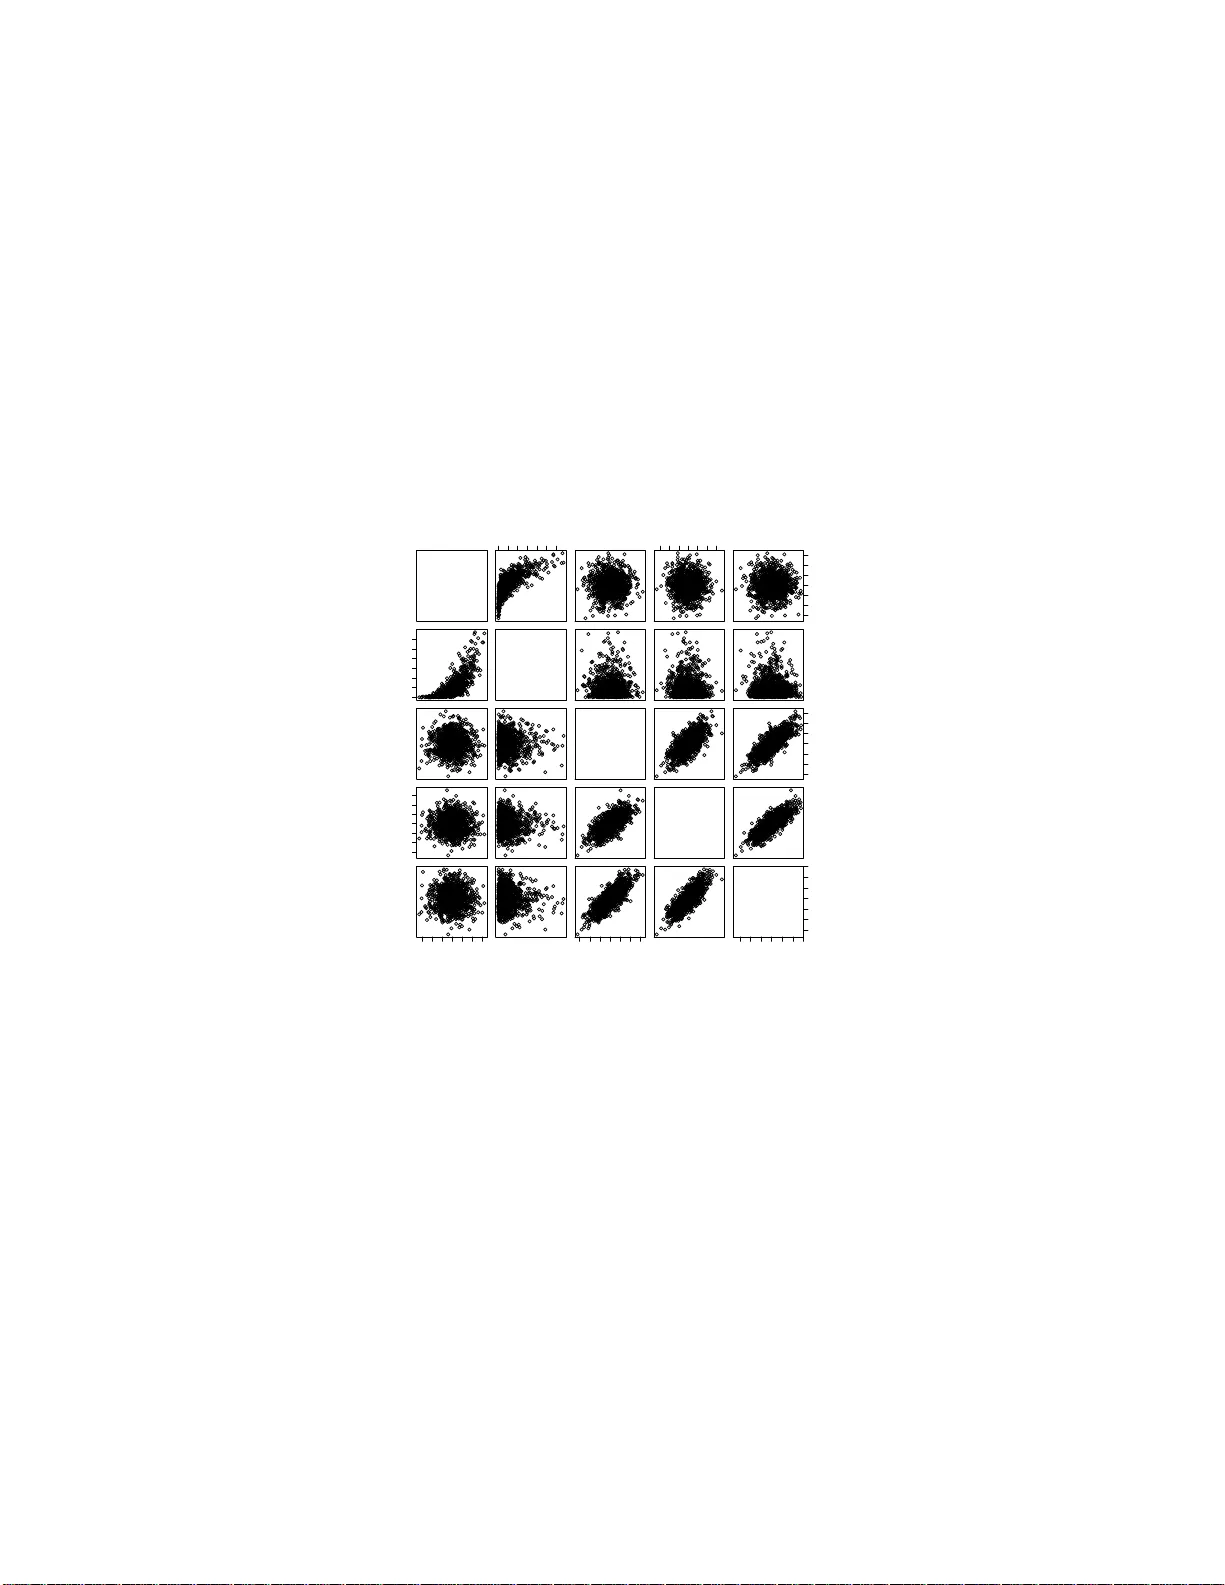
Dep endence Structure Estimation via Copula Ma Jian ∗ 1 and Sun Zengqi 2 1 Hitac hi (China) Researc h & Dev elopmen t Corp oration 2 Tsingh ua Univ ersit y September 1 0 , 2019 Abstract Dep endence strucuture estimation is one of the imp ortant problems in mac hine learning domain and h as many applications in different scien- tific areas. In this pap er, a theoretical framewo rk for s uc h estimation based on copula and copula entrop y – the probabilistic theory of rep- resen tation and m easur emen t of statistica l dep endence, is prop osed. Graphical mo dels are considered as a sp ecial case of the copu la frame- w ork. A metho d of the framewo rk for estimating maximum span n ing copula is prop osed. Due to copula, the metho d is irr elev an t to the prop erties of ind ividual v ariables, insens itive to outlier and able to deal with n on-Gaussianit y . Exp eriments on b oth simulate d data and real dataset d emonstrated the effectiv eness of the p rop osed m etho d . Key words : copula en trop y , structure learning, maximum spanning copula 1 In tro du ction Dep endence b etw een random v ariables is of significan t imp ortance since it ma y means essen tial statistical o r causal relationships within real w orld so- cial, phy sical, or biolog ical systems. As da t a are collected from differen t sci- en tific fields, analyzing and understanding them remains a c hallenge. Hence, ∗ Email: ma jian@hitachi.cn. 1 dep endence structure lear ning is b ecoming one of the most imp ortan t prob- lems in mac hine learning domain. The most studied statistical metho dology fo r dependence represen tation has b een gr a phical mo dels, or Bay esian net w orks [1, 2, 3 ]. With graphical mo dels fo rmalism, a probability densit y is represen t ed with a directed o r indi- rected graph, o f which eac h no de represen ts a random v aria ble, a nd eac h edge represen ts a conditional dep endence relation b et w een tw o random v ariables. Suc h represen tation lead to simplicit y of mo dels and hence mak es larg e-scale problem mo deling and inferring tractable. The assump tion of graphical mo d- els is mark o vit y o r conditional indep endence, whic h means only first order dep endence or pairwise dep endence is conside red in those mo dels. Ho w ev er, the assum ption may b e incorrect in man y real a pplications. Additionally , traditional learning metho ds for inferring gra phical mo dels in v olv e maxim um lik elihoo d where one should sp ecify par a metric distribution family with par ametric margins of individual v ariables implicitly . Mo del selection on marg ins is critical for structure learning to a large exten t, but there is usually short of pr io ri knowle dge needed for suc h selection. So w e are in terested in finding a method that can separate structure learning from parametric marginal sp ecification. Copula t heory is on the r epresen tation of m ultiv ariate statistical dep en- dence [4, 5]. According to Sklar theorem [6], an y multiv aria te probilistic dis- tribution can b e represen ted a s a pro duct of its margins and a copula function whic h represen ts dep endence structure among random v ariables. With cop- ula, o ne can separate the margins from their join t densit y distribution and dep endence structures, and therefore it is p ossible to study only statistical relationships without considering individual prop erties of each v ariable. Cop- ula has b een widely studied in finance [7], a nd ga in momentum in mac hine learning comm unit y [8 , 9]. Since copula is a unified theory on represen tation of statistical dependence, it is natural to build a univ ersal framew ork for structure learning with it. Apparen tly , copula represen t a tion cov ers all the represen tat ions of statistical dep endence, including graphical mo dels. Copula En tro py ( CE) is a recently introduced theory on statistical inde- p endence measu remen t [10]. It enjo ys man y prop erties which an ideal dep en- dence measure should hav e, including multiv ariat e, symmetric, non-negative (0 iff indep enden t), in v a rian t to monotonit ic transformation, equiv alent to correlation co efficien t in Gaussian cases . Ma a nd Sun pro v ed its equiv alence to Mutual Information (MI) and then prop osed a simple and elegan t estima- tion metho d [10]. With CE, one can infer statistical dep endence relationships 2 b et w een random v ariables without b othering mar g inal prop erties. The main con tribution of the pap er is in tro ducing a nov el f r a mew or k of structure learning based on copula and copula en trop y . Suc h framew ork pro- vides a unive rsal theory of structure learning. In the pap er, graphical mo dels is iden tified a s a sp ecial case of the framew ork, while the copula framew ork co v ers all t yp es of dep endence structure theoretically . P articularly , gra phical mo dels concerns only pairwise dependence, and has its coun terpart in copula theory , called pro duct copula. W e study estimating dep endence structure with CE. W e prop ose a metho d in whic h dep endence structure is first measured with CE and then infer max- im um spanning copula with Cho w-Liu [11] lik e MST algorithms on dep en- dence matrix. The most adv a n tage of CE is that it is a mo del-f r ee measure with non-parametric estimation. Moreov er, our metho ds can b e generalized to estimate muc h complex dep endence relationships. 2 Copula The o ry 2.1 Definitions and Theorem Copulas are the functions that mo del the dep endence relations among ran- dom v ariables, a nd is defined as follows: Definition 1 (Copula) . [4, 5] Given N r andom va ri a bles X = { X 1 , . . . , X N } ∈ R N . L et { u i = F i ( x i ) , i = 1 , . . . , N } b e the mar ginal distributions of X . A N -dimensi o n al c opula C : I N → I ( I = [0 , 1] ) of X is a function w i th fol lowing pr o p erties: • C i s gr ounde d and N-incr e asing; • C (1 , . . . , 1 , u i , 1 , . . . , 1) = u i . In tuitiv ely , copula can b e view ed as a cum ulativ e distribution f unction (CDF) stretc hed on to u = I N from t he CDF of X . The relation betw een CDF, margins, and copula is stated in Sklar’s the- orem [6]: Theorem 1 (Sklar’s Theorem) . Given a r ando m ve ctor X = { X 1 , . . . , X N } , its CDF F ( x ) c a n b e r epr esente d as F ( x ) = C ( u 1 , . . . , u N ) , (1) 3 wher e C is a c opula function, { u i } ar e mar ginal distribution functions of X . If { F i } ar e c o n tinuous, then C is unique. Sklar’s theorem is of cen tral imp ortance in copula theory . By applying deriv ativ e on (1 ), one can also represen t probability densit y function (PDF) via copula. Let us first define c opula density . Definition 2 (Copula D ensit y) . A N dimensiona l c opula density c c orr e- sp ondin g to N -c op ula C is define d as c ( u ) = d N du 1 , . . . , du N C ( u ) , (2) wher e u ∈ I N . With copula densit y , one can deriv e a corollary o f Sklar’s theorem: Corollary 1. The pr ob ability density function (PDF) p ( x ) of X c an b e r ep- r esente d as: p ( x ) = c ( u ) N Y i =1 p i ( x i ) (3) wher e { p i , i = 1 , . . . , N } ar e mar g i n al d e n sity functions of X , and c is c opula density. Remark 1. A c c or ding to Sk lar’s the o r em, dep endenc e structur e is indep en- dent fr om mar gins . This implies that it is p ossible that a sam e structur e is asso ciate d wi th differ ent distributions. These distributions ar e said to b e e quivalent in a sense of c o p ula. Th at me ans that diffe r ent di s tribution may c orr esp onds to sam e dep ende n c e structur e. 2.2 Pro du c t Copula As dependence represen ta tion, t here are man y t yp es of copula function and the metho ds for contructing copulas [5]. Here w e in tro duce a special t ype of copula, pro duct copula. Theorem 2 (Pro duct Copula) . The pr o d uct of c o p ula density of inde p endent variables is also a c opula density. 4 The theorem can b e represen ted as c ( u ) = M Y m =1 c m ( u m ) . (4) where { c m } are an y type of copula densit y , and u = ∪ M m =1 u m , and { u m } are v ectors of margins of random v ariables. If all the sub-copulas c m are biv ariate, it means that there is only pairwise dep endence exists. In this case, pro duct copula is equiv alen t to a gra phical mo del. Theorem 3. Any gr aphic al mo del is e quivalent to a pr o duct c o pula wi th only bivariate sub-c opulas. The theorem indicates that graphical mo del is just a sp ecial case of copula represen tat ion, named pro duct copula. More generally , h yp ergra ph can a lso b e form ulated to b e a sp ecial case of pro duct copula with eac h v ariable dimension sub-copula corresp onding to a sub-g r a ph. 3 Copula Entrop y 3.1 Theory Copula theory is ab out represe n tation of m ultiv ariate dep endence with cop- ula function [4, 5]. A t the core of copula theory is Sklar theorem [6] whic h states t ha t multiv ariat e probability density function can b e represen ted as a pro duct of its margins and copula densit y function whic h represen ts de- p endence structure among random v ariables. Suc h represen tation sep erates dep endence structure, i.e., copula function whic h con tains all the dep endence information, with margins of individual v ariables. Copula represen tation mak es it p ossible to measure statistical dep endence in copula function re- gardless of joint distribution a nd marginal distribution. This section is to define an statistical indep endence measure with copula. F or clarit y , please refer to [10] for nota tions. With copula densit y , CE is define as follow s [10]: Definition 3 (Copula En tropy ) . L et X b e r andom variables with ma r gins u and c op ula density c ( u ) . CE of X is define d as H c ( X ) = − Z u c ( u ) log c ( u ) d u . (5) 5 In information theory , MI and en trop y are tw o differen t concepts [12 ]. In [10], Ma and Sun prov ed that they are essen tially same – MI is also a kind of entrop y , negativ e CE, whic h is stated as follow s: Theorem 4. MI of r andom v a riables is e quivalent to ne gative CE: I ( X ) = − H c ( X ) . (6) The pro of of Theorem 4 is simple [1 0]. There is also an instant corollary (Corollary 2) on the relationship b et w een information of jo in t pro ba bilit y densit y function, margins and copula dens ity f unction. Corollary 2. H ( X ) = X i H ( X i ) + H c ( X ) . (7) The ab ov e results cast insigh t in to the relationship b et w een en trop y , MI, and copula through CE, and therefore build a bridge b etw een info r ma t ion theory and copula t heory . CE itself provides a mathematical theory of statis- tical indep endence measure and is a p erfect to ol for estimating dep endence structure. 3.2 Estimation It has b een widely cons idered that es timating MI is no t o riously difficult. Un- der the blessing of Theorem 4, Ma and Sun [10] prop osed a simple and elegan t non-parametric metho d for estimating CE (MI) from da t a whic h comp oses of o nly tw o steps: • Step 1: Estimating Empirical Copula Densit y (ECD); • Step 2: Estimating CE. F or Step 1, if giv en data samples { x 1 , . . . , x T } i.i.d. generated from r an- dom v ariables X = { x 1 , . . . , x N } T , one can easily estimate ECD as follo ws: F i ( x i ) = 1 T T X t =1 χ ( x i t ≤ x i ) , (8) where i = 1 , . . . , N a nd χ repres en ts for indicator function. Let u = [ F 1 , . . . , F N ], and then one can deriv es a new samples set { u 1 , . . . , u T } as data fr o m ECD 6 c ( u ). In practice, Step 1 can b e easily implemen ted non-parametrically with rank statistics. Once ECD is estimated, Step 2 is essen tially a problem o f en tropy es- timation whic h has b een con tributed with many existing metho ds. Among them, the kNN metho d [13] w as suggested in [10]. With rank statistics and kNN metho ds, o ne can deriv e a non-parametric metho d of estimating CE, whic h can be applied to an y situation without assumptions on the underlying system. Since the metho d f or estimating CE is non-par ametric, it can b e applied to a n y cases for estimating dependence structure. 4 Estimating Maxim um Spann i n g C opula 4.1 The F ramew ork based on Copula With copula, w e prop ose a framew ork for estimating dep endence structure regardless of prop erties of individual v ariables. In the framew ork, empirical copula is first estimated from data implicitly or explicitly , and then dep en- dence structure is estimated from empirical copula based o n dep endence re- lationships whic h is measured with CE. The f ramew ork is distribution free since one do no t ha v e to mak e assumptions on and inference the parametric form of individual v ariables under the risk of mo del missp ecification. The framew ork can b e implemen ted non-par a metrically since estimating CE in- v olv es only rank-based empirical copula and kNN en tropy estimation. In this w a y , the framew ork fo cuses on only dep endence structure a nd is inrelev ant to pro p erties of individual v aria bles. 4.2 Maxim u m Sp anning Copula Problem Supp ose we w an t to approx imate dep endence relatio ns with a t yp e of struc- ture T ( t ), where t is the pa r ameter sp ecifying T . Giv en a group of i.i.d. samples X generated from a N dimensional random v ector x ∈ R N ∼ p ( x ), an ob jectiv e function F can b e defined on it, and b e optimized to inference T with resp ect to t : arg max t F ( t ; X ) . (9) Here, t b elongs to the structure asso ciated with pro duct copula, and F is defined a s the dep endence information contained in t so tha t suc h dep endence 7 information in X are con tained in t as m uch a s p ossible. No w conside r a N dimensional copula densit y c of x . W e can derive its empirical estimation ˆ c from X , whic h contains all the dep endence infor- mation in data . One of the natural idea is to build a ˆ c cov ering the main dep endence relationships with pro duct copula (or gr aphical mo del). W e call suc h pro duct copula ‘ maxim um sp anning c opula ’ (MSC). The MSC appro x- imation of c in terms of biv aria te pro duct copula comp oses of a pro duct of N − 1 biv ariate copula. Then the ab ov e F can b e defined b y the sum of dep endence me asuremen ts on N − 1 subcopulas. The problem is how to find suc h a optimal pro duct copula to appro ximate the dependence structure among r andom v a riables. 4.3 Construction A lgorithm of MSC W e propo se a metho d for estimating from samples their MSC with Chow-Liu algorithm, whic h comp oses of tw o steps (Alg o rithm 1). First, a dep endence matrix is deriv ed from data, eac h elemen t of whic h is the v alue of CE b et w een a pair o f v ariables. Then based on dep endence measure matrix, a structure T on N rando m v ariables is built where the w eigh t of eac h edge is equal to dependence b etw een t w o v ariables. Constructing optimal pro duct copula equals to finding MSC of t from data . This is a w ell-defined pro blem, whic h can be solv ed b y Cho w-Liu a lgorithm [11 ]. Cho w-Liu algo rithm here is actually an appro ac h to construct Maximum Spanning T ree (MST) with CE as edge we igh ts. There are some establishe d MST algorit hms, suc h as Krusk al’s algorithm [14] and Prim’s algorithm [15]. Both algor it hms can find the solution in p olynomial t ime. W e adopt Prim algorithm in our metho d (Algorithm 2). It starts with a n empt y edge set E , and then eac h time add from the complemen t set of E one v ertex u and its corresp onding edge ( u, v ) with ma ximum w eigh t so that v / ∈ E has edge connection with E and ( u, v ) will ha s the maxim um edge w eigh t and mak e no lo op in new E , till E contains all the v ertex. Algorithm 1 MSC estimation Input: data x Calculate dependence matrix C x of x with CE estimation; Build dep endence structure T with Algorithm 2 based on C x . 8 Algorithm 2 MST a lgorithm Input: edge set E , matrix o f edge w eight W E T = {} ; rep eat Find the v ertex u whic h W ( u, v ) , v ∈ E \ E T is with maxim um we ight; Add u in to E T ; un til E T = E . 5 Exp e r i men t s and Resul t s 5.1 Sim u lated Data W e first test the prop osed metho d on sim ulated da ta. A dataset with 1000 samples are randomly generated from 5 random v aria bles, of whic h the first three ones are zero mean Gaussian and the others tw o ar e g ov erned b y Gaus- sian copula with margins as normal distribution and exponential distribution resp ectiv ely ( Figure 1). The algorithm 1 is run on the dataset and then a dep endence tree is deriv ed as illustrated in Figure 2, whic h sho ws the dep endence relationships of t he t w o v ariable groups are correctly estimated. 5.2 Real Datasets 5.2.1 Abalone Data Abalone dataset in UCI data rep ositor y [16] w as built to predict the ag e of abalone based on ph ysical measuremen ts of a ba lone b o dy , suc h as w eigh ts and heigh t. It comp oses of 4177 samples with 9 attributes. It w as usually treated as a regression problem of predicting a g e with physic al measuremen ts. Here w e fo cus on the dependence relations a mo ng the 9 attributes, whic h ma y b enefit unders tanding this prediction task. Figure 3 sho ws one of all the MSC of abalone data in the exp eriments , where edges ar e lab eled b y CE w eigh ts. Exc ept Sex and rings, other sev en attributes a r e link ed with relative ly strong w eigh ted edges. This dep endence relationships b etw een sev en attributes can b e interprete d as the reflection of abalone’s b o dy grow th. It can also b e learned that the edges b et w een these sev en attributes are the bac kb one of the estimated trees, while the no des fo r ‘sex’ and ‘ring’ are weakly attached to other sev en no des. That implies that 9 Cn 0 2 4 6 −3 −1 1 3 −3 −1 1 3 0 2 4 6 Ce G1 −3 −1 1 3 −3 −1 1 3 G2 −3 −1 1 3 −3 −1 1 3 −3 −1 1 2 3 −3 −1 1 2 3 G3 Figure 1: Simulated data.‘G1-3’ represen t Ga ussian v a r iables, and ‘Cn’,‘Ce’ represen t tw o copula v ar ia ble with normal and exp onen tial margins. 10 0.5 0.01 0.45 0.44 Cn Ce G1 G2 G3 Figure 2 : MSC of the simu lated exp erimen t. 11 0.12 1.91 1.75 0.95 1.71 1.49 1.69 0.49 S L D H ww sw vw sw R Figure 3: MSC of the Aba lo ne dat a set. all the phys ical measuremen ts increase as the abalones grow up, while ring and sex is not strongly related with these pro cess. In this sense, we a rgue that predicting ring or age with the other attributes may not b e reasonable. 5.2.2 Housing Data The Boston house price dataset in UCI data rep ository [16] is collected from a 1970 census, first published b y Harrison, D. and Rubinfeld [17], with the aim to study ho w to predict ‘Medv’ 1 from the other 13 attributes. It includes 1 F or the abbr . of 14 attributes of H ousing datas e t, please refer to U CI machine learning dataset websit [16]. 12 1.04 0.64 1.98 1.03 1.98 1.96 0.02 1.16 0.38 0.43 0.46 0.18 0.57 Cr Zn In Ch Nox Rm Age Dis Rad Tax Ptr B L M Figure 4 : MSC of the Housing dataset. 506 samples with 14 mixed type att ributes, including 13 con tin uous attributes and 1 binary one. Previous researc hes mainly treat it as a regression problem without considering the relationships b et w een attributes. In this experimen t, w e try to understand t he data by studing the dependence structure. The MSC algorithm w as run on the housing dataset. A dep endence tree w as generated, whic h is plotted in Figure 4. Exp erimen t a l results sho w ed that t w o groups of link ed edges including ‘Crim-Indus-Rad-T ax-Ptratio-Nox-Dis’ and ‘Medv-Lstat’, remain strong in the estimated tr ee. So predicting ‘Medv’ from a ll other attributes is problematic. 13 6 Discuss ion Our philo sophy of structure learning is that the more we kno w, t he b etter structure we can learn. Using copula, one can incorp orate a ll the dep endence information without mo del constraints and mean while all t he information is ab out nothing but dep endence relations. Then structure learning based on copula provides a general framew ork whic h can unify all the related structure learning metho ds. Another main adv an tage is suc h estimation is irrelev ant to pro p erties of individual v aria bles. Due to copula, MSC estimation has some adv antages. The first o ne is insensitiv e to outlier. F or instance, there are a few outliers in the abalone dataset. T raditionally , they should b e eliminated o therwise they ma y cause large deviation in the following dep endence measures calculation. But here it is unnece ssary b ecause estimation of CE is less susceptible to outliers. Comparing the original data (Figure 5) with its copula (Figure 6), one can learn that o utliers cause almost no effect o n empiric al copula and hence the estimation of MSC. Besides robustness to outliers, w e highligh t another adv antage made p os- sible b y copula, i.e., the ability to deal with non- Gaussianit y within data . It can b e observ ed fro m Figure 5 that a ll the at t r ibutes p ossesses non- gaussianit y to some exten t whic h is demonstrated in their join t densities with other attributes. While all the pa irwise copulas show a v ery similar de- p endency structure after marginal prop erties of v ar ia bles a r e separated from join t distribution a s illustrated in Figure 6. Copula also mak es non- linear transformation on data unnec essary . When learning structure, some researc hers prop osed to transform the data in to a suitable scale b efore further dep endence a nalysis, through monotonically increasing function, suc h as normalization, nonlinear exp onen tial/log func- tions. In our exp erimen t, it is unnecessary due to copulas in v ariant to suc h kind o f transformat ion. Dep endence represe n tation using only biv aria te dependence is limited. Giv en N ( N − 1) pair dep endence relations of N r andom v ariable, only N − 1 of relations comp ose of tree structure. How ev er, MSC can show the ske leton of dep endence structure within data, whic h reflect the main relationships. It w ould help to understand the dat a b etter at first. 14 L 0.0 0.4 0.8 0.0 0.2 0.4 0.6 0.2 0.4 0.6 0.8 0.0 0.4 0.8 H sw 0.0 0.5 1.0 1.5 0.2 0.4 0.6 0.8 0.0 0.2 0.4 0.6 0.0 0.5 1.0 1.5 vw Figure 5: Scatter plot of four att r ibutes in Abalone dataset.‘L’,‘H’,‘sw’,‘vw’ represen t Length, Heigh t, Sh uc k ed w eigh t, and Viscera w eigh t. 15 L 0 20 60 100 0 20 60 100 0 20 60 100 0 20 60 100 H sw 0 20 60 100 0 20 60 100 0 20 60 100 0 20 60 100 vw Figure 6: Empirical copula densit y of fo ur attributes in Abalone data set. 7 Conclus ion and F urther Directio n In the pap er, w e pr o p ose a fra mework for estimating dep endence structure using copula. Copula can repres en t all kinds of dependence relations among random v ariables, and mak es no additional assumption o n the underlying distributions. Graphical mo dels is considered a s a sp ecial case in the cop- ula fra mework, named pro duct copula. In this framew ork, w e prop o sed a metho d for estimating MSC with a Cho w-Liu lik e metho d based on CE. The prop osed metho d w as demonstrated on sim ulat ed data and tw o real data set to estimate their dep endence structure. Exp erimen t al results show ed that the estimated MSC can b enefit us understanding the data b etter and that the copula f ramew o rk can estimate dep endence represen t a tions whic h are margin-free, robust to outlier, and inv aria nt to increasing transformation. Theory of copula and CE are ab o ut represen tation and measuremen t of statistical dep endence resp ectiv ely . The y provide a sound theoretical base for further researc h. The problem of structure learning is to infer the underlying dep endence relationship. F o r structure learning with copula, man y problems 16 remain to b e tac kled. F or example, ho w to choose differen t structures (or family when in a parametric w ay ) f o r applications? MSC represen ts the simple dep endence relations. In the further, w e will study the estimation of more complex dependence structures thro ugh copula. This can imply many real applications in biological, so cial, a nd ph ysical sciences. References [1] Hec k erman D, Geiger D, Chic k ering D M. Learning Ba y esian netw orks: The combination of knowle dge and statistical data. Machine learning, 1995, 20(3): 197-24 3. [2] Buntine W. A guide to the literature on learning proba bilistic netw orks from data. IEE E T ransactions on know ledge and data engineering, 1996, 8(2): 195- 210. [3] Jordan M I. Learning in graphical mo dels. Klu wer Academic Publishers , 1998. [4] Jo e H. Multiv aria t e mo dels and m ultiv aria t e dep endence concepts. CR C Press, 1997. [5] Nelsen R B. An in tro duction to copulas. Springer: New Y ork, 1998. [6] Sklar M. F o nctions de repartition a n dimens ions et leurs marges. Publ. inst. statist. univ. P aris, 1959, 8: 229-231. [7] Bouy´ e E, D urrleman V, Nikegh bali A, et al. Copulas for finance-a read- ing guide and some applications. Av a ilable a t SSRN 103253 3 , 2000. [8] Ma J, Sun Z. Copula comp onen t a na lysis. International Conference on Indep enden t Comp onen t Analysis a nd Signal Separation. Springer, Berlin, Heidelberg, 2007 : 7 3-80. [9] Kirshner S. Learning with tree-a v eraged densities and distributions. Ad- v ances in Neural Information Pro cessing System s. 200 8: 761-768 . [10] Ma J, Sun Z. Mutual infor ma t io n is copula en trop y . Tsingh ua Sci- ence & T ec hnology , 2011, 1 6(1): 51-54. See a lso a rXiv preprin t, arXiv:0808.0845, 2008. 17 [11] Chow C, Liu C. Appro ximating discrete proba bilit y distributions with dep endence trees. IEEE transactions on Information Theory , 1968 , 14(3): 462- 467. [12] Cov er T M, Thomas J A. Elemen ts of information theory . John Wiley & Sons, 199 1. [13] Kra sk ov A, St¨ ogbauer H, Grassb erger P . Estimating m utual informatio n. Ph ysical review E, 2004, 69(6): 0661 38. [14] Krusk al J B. On the shortest spanning subtree of a graph and the tra v- eling salesman problem. Pro ceedings of the American Mathematical so- ciet y , 1956, 7(1): 4 8-50. [15] Prim R C. Shortest connection net w o r ks and some generalizations. The Bell Sys tem T ec hnical Journal, 1957, 36(6): 1 389-1401 . [16] Asuncion A, Newman D. UCI mac hine learning rep ository . 2007. [17] Harr ison Jr D, Rubinfeld D L. Hedonic housing prices and the demand for clean a ir. Journal o f en vironmen tal economics and mana g emen t, 1978, 5(1): 81-102. 18
Original Paper
Loading high-quality paper...
Comments & Academic Discussion
Loading comments...
Leave a Comment