Feasibility of Using Automatic Speech Recognition with Voices of Deaf and Hard-of-Hearing Individuals
Many personal devices have transitioned from visual-controlled interfaces to speech-controlled interfaces to reduce device costs and interactive friction. This transition has been hastened by the increasing capabilities of speech-controlled interface…
Authors: Abraham Glasser, Kesavan Kushalnagar, Raja Kushalnagar
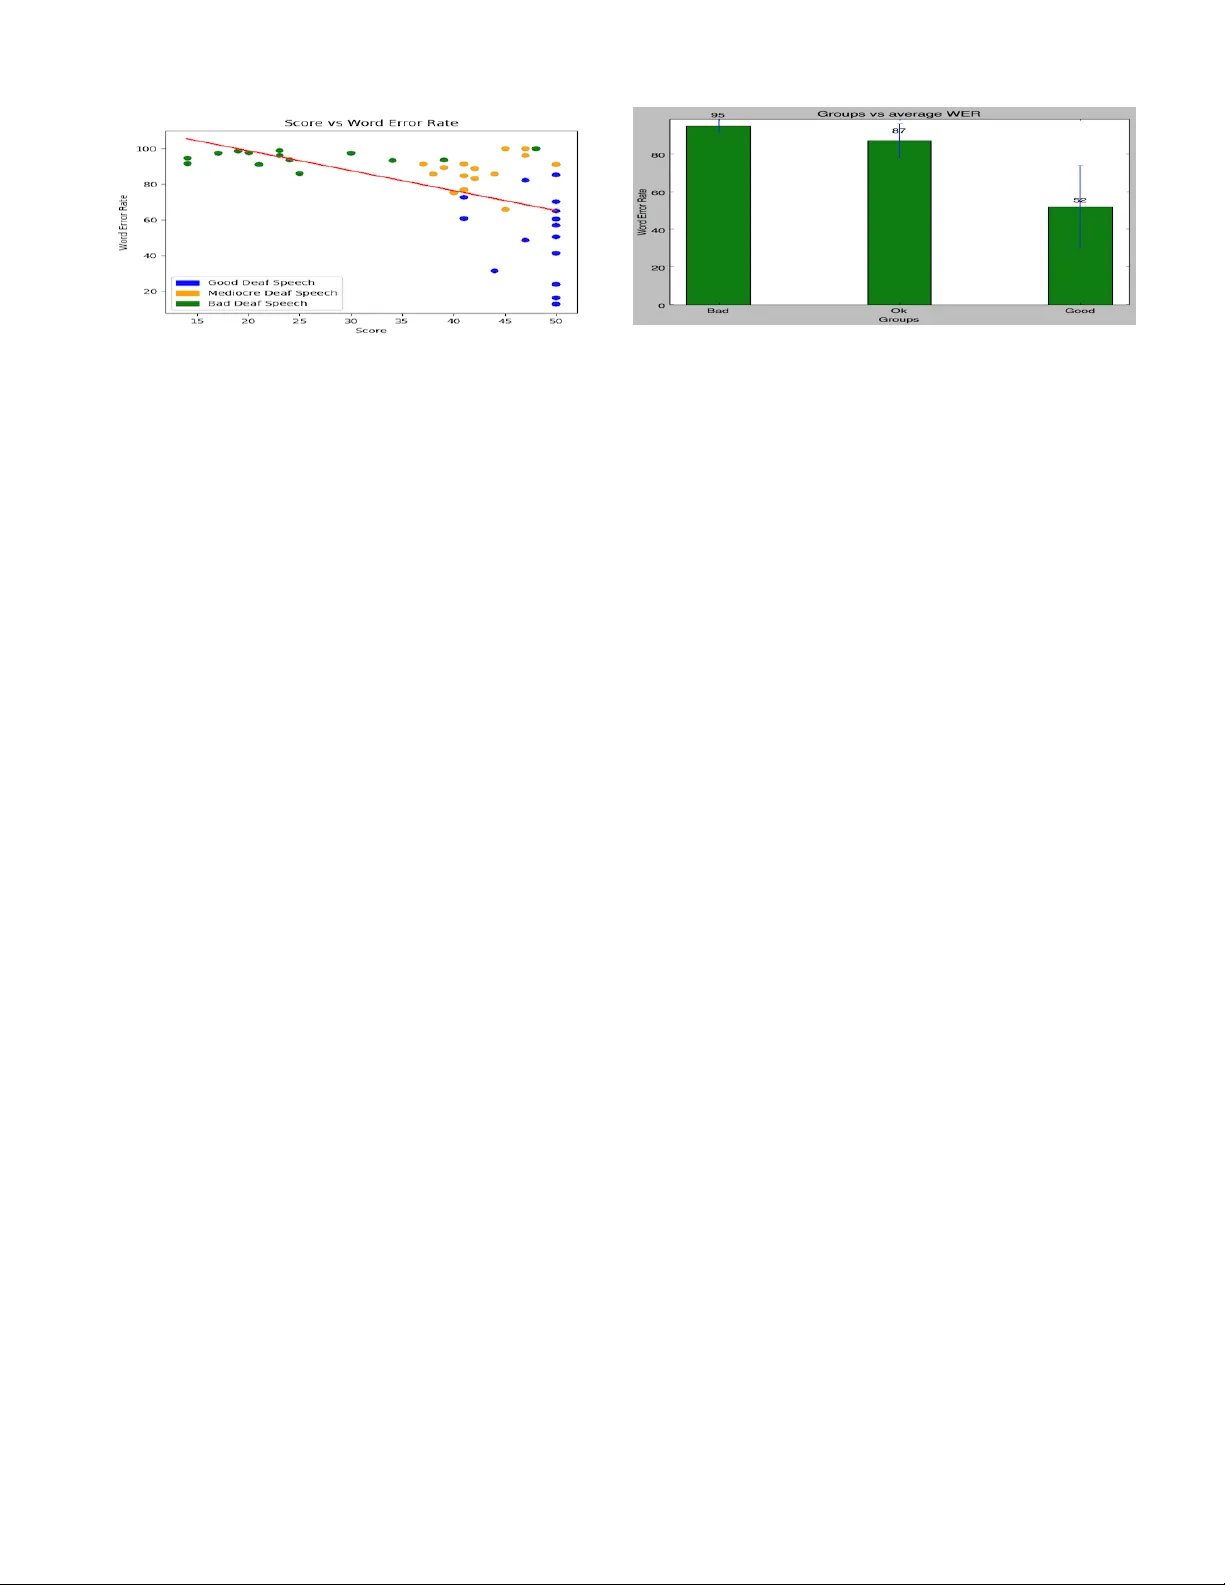
Feasibility of Using A utomatic Speech Recognition with V oices of Deaf and Har d-of-Hearing Individuals Abraham Glasser , K esav an Kushalnagar , and Raja Kushalnagar Rochester Institute of T echnology Rochester , NY 14623 {atg2036, kr k4565}@rit.edu, raja.kushalnagar@gallaudet.edu ABSTRA CT Man y personal devices hav e transitioned from visual-controlled in terfaces to speech-con trolled int erfaces to reduce costs and in teractiv e friction, supp orted b y the rapid growth in capa- bilities of sp eec h-controlled in terfaces, e.g., Amazon Echo or Apple’s Siri. A consequence is that p eople who are deaf or hard of hearing (DHH) ma y b e unable to use these speech- con trolled devices. W e show that deaf sp eech has a high er- ror rate compared to hearing sp eech, in commercial sp eech- con trolled interfaces. Deaf sp eech had approximately a 78% w ord error rate (WER) compared to a hearing speech 18% WER. Our findings show that current sp eech- con trolled in- terfaces are not usable b y DHH p eople. Based on our find- ings, significant adv ances in sp eech recognition softw are or alternativ e approac hes will b e needed for deaf use of sp eech- con trolled in terfaces. W e sho w that current speech-con trolled in terfaces are not usable by DHH p eople. CCS Concepts • Human-cen tered computing → Accessibilit y; Ac- cessibilit y design and ev aluation metho ds; K eywords Automatic Speech Recognition, Deaf Sp eec h, Hearing Speech, W ord Error Rate, Deaf, Hearing 1. RELA TED W ORK Prior research has inv estigated how the lack of a feedback loop for deaf p eople who cannot hear their own sp eaking results in po or sp eec h quality due vo wel errors, intonation errors, and length errors [1, 2]. ASR soft ware is generally trained with sp eec h samples from hearing p eople, whic h re- sults in very po or recognition of deaf sp eech. Ev en when used with limited p ossibilities, e.g., single digits, ASR for deaf speakers with po or sp eech intelligibilit y yielded a 13% W ord Error Rate (WER) [3], compared to nearly no errors for hearing sp eech [4]. Permission to make digital or hard copies of part or all of this work for personal or classroom use is granted without fee provided that copies are not made or distributed for profit or commercial advantage and that copies bear this notice and the full citation on the first page. Copyrights for third-party components of this work must be honored. For all other uses, contact the o wner /author(s). ASSETS ’17 October 29-November 1, 2017, Baltimore, MD, USA c 2017 Copyright held by the o wner/author(s). A CM ISBN 978-1-4503-4926-0/17/10. DOI: https://doi .org/10.1145/3132525.3134819 Figure 1: Distribution of Clarke Sentence Scores. 2. METHODOLOGY 2.1 Deaf Speech Dataset W e sampled from a subset of a large sp eec h dataset of 650 deaf and hard of hearing (DHH) individuals at the Na- tional T ec hnical Institute for the Deaf at Ro chester Insti- tute of T ech nology , which has an enrollment of around 1100 deaf and hard of hearing students. The dataset consisted of samples taken from DHH individuals who to ok the Clarke Sen tences intelligibilit y test [5]. The test has 60 sentence lists, eac h with 10 sentences of 10 syllables. The n um b er of w ords v aries across the sen tences and lists. Eac h audio file has one sp eaker speaking one list from the Clarke sen tence list. In eac h audio file, the sp eaker says the sentence num b er and then proceeds to say that sen tence, and rep eats unti l all the ten sentences are sp ok en. The audio files were recorded b y one individual, then the samples were sent to a sp eech pathologist. The speech pathologist assigned an int elligibil- it y score from 0 to 50. The score is computed by looking for 50 target w ords within the sample for credit. A score of 50 w ould indicate that the deaf p erson is generally intelligible to the sp eech pathologist, while a score of 30 means difficult to understand, and a score of 0 means completely unintelli- gible. Ab out half of all deaf individuals had scores of under 40, which is usually unintelligible to p eople not used to deaf speech, as shown in Figure 1. Figure 2: Intelligibilit y rating vs W ord Error Rate 2.2 ASR and WER Analysis W e used the Microsoft T ranslator Speech API to create transcriptions for eac h audio file. This API is used by busi- nesses for transcriptions. As a commercial level softw are, it matc hes other similar transcription softw are [6, 7, 8]. W e also used the National Institute of Standards and T echnol- ogy Speec h Recognition Scoring T o olkit (SCTK) V ersion 2.4.0.4 for the W ord Error Rate calculations [9]. 3. ANAL YSIS RESUL TS 3.1 WER for Hearing Speakers W e calculated the ASR transcription and WER analysis results for fiv e hearing sub jects who read v arious lists from the same Clark e Sen tences database, The sp eec h samples w ere recorded with a cell phone in a noisy environmen t with bac kground noise in a lab with man y p eople sp eaking and computers, which is similar to common use-case scenarios in using phone ASR services. The av erage WER was 18%. While the sp eech recognition was not close to p erfect for hearing people, it was still passable. These n umbers are expected from the current state of the art technology . The ma jority of v oice command interfaces are currently found in cell phones and home assistan ts, which are often used in noisy en vironmen ts. If we had repeated these recordings in the same setting as the deaf sp eec h samples, we w ould expect an ev en low er WER. 3.2 WER for Deaf Speakers W e ran a sample of the deaf sp eech database through the Microsoft T ranslator Speech API. W e used 45 total samples that were c hosen b y a naiv e listen er who determined 15 goo d samples (40+), 16 mediocre samples (30-40), and 14 p oor files (10-30). The error rates were extremely high o ver all samples at 77%, including 53% WER for the goo d samples. The av erage WER and standard deviation was calculated for eac h group, as shown in Figure 3.2. The av erage WER for the go o d speech group w as significantly less than either the mediocre group or bad speech groups; a t-test comparison betw een the go o d and medio cre groups yielded p < 0.01. 4. CONCLUSIONS The current WER of Microsoft T ranslator w as to o high for comfortable use. They were significantly p oorer in perfor- mance compared to hearing people under similar conditions. There are a num b er of factors that hav e an impact on the accuracy of automatic sp eech recognition systems with deaf Figure 3: Group vs av erage WER speech. The results also show muc h greater v ariance among deaf sp eakers, compared with hearing sp eakers. In order for ASR systems to recognize deaf speech as well as it do es hearing sp eech requires a huge database of deaf sp eakers. While conceptually simple, it is still challenging. The deaf population is relatively small compared to the size of the hearing population, and hav e far more v aried bac kgrounds. ASR systems are trained using huge hearing sp eaker datasets. The results show that even d eaf speakers with “go od” sp eech ha ve worse accuracy compared with the a verage hearing speaker. Although the Clarke Sen tence test is useful for speech pathology ev aluation, it is less useful for providing more feedbac k to DHH p eople ab out the usabilit y of curren t ASR interfaces, since the top rating of 50 do es not distin- guish b etw een DHH sp eakers with high ASR accuracy and those with l ess ASR accuracy . It w ould be helpful to dev elop an automated t est that pro vides feedbac k to DHH people on their use of ASR services such as Siri or Alexa. 5. REFERENCES [1] M. S. Thirumalai and S. G. Ga yathri. Sp ee ch of the he aring imp air ed . Central Institute of Indian Languages, 2004. [2] Mary J. Osb erger and Nancy S. McGarr. Sp eech production charact eristics of the hearing impaired. Journal of Sp e e ch, L anguage and He aring R ese ar ch , 8:221–283, 1982. [3] C Jey alakshmi, V Krishnamurthi, and A Rev athy . Deaf speech assessmen t using digital processing techniques. Signal & Image Pr o c essing: An International Journal (SIPIJ) , 1(1):14–25, 2010. [4] George R Do ddington. Phonetically sensitive discriminan ts for impro ved sp eech recognition. In A c oustics, Sp ee ch, and Signal Pr o c essing, 1989. ICASSP-89., 1989 International Confer enc e on , pages 556–559. IEEE, 1989. [5] Vincen t J. Samar and Dale Ev an Metz. Criterion v alidit y of sp eech intelligibilit y rating-scale pro cedures for the hearing-impaired population. Journal of Sp e e ch, L anguage, and He aring R ese ar ch , 31(3):307–316, 1988. [6] Ric hard Eck el. Microsoft researchers achiev e sp eech recognition milestone, Sep 2016. [7] Google’s sp eec h recognition technology now has a 4.9% w ord error rate, Ma y 2017. [8] George Saon. Reaching new records in sp eec h recognition, Mar 2017. [9] National institute of standards and tec hnology , June 2017.
Original Paper
Loading high-quality paper...
Comments & Academic Discussion
Loading comments...
Leave a Comment