Load Forecasting Model and Day-ahead Operation Strategy for City-located EV Quick Charge Stations
Charging demands of electric vehicles (EVs) are sharply increasing due to the rapid development of EVs. Hence, reliable and convenient quick charge stations are required to respond to the needs of EV drivers. Due to the uncertainty of EV charging loa…
Authors: Zeyu Liu, Yaxin Xie, Donghan Feng
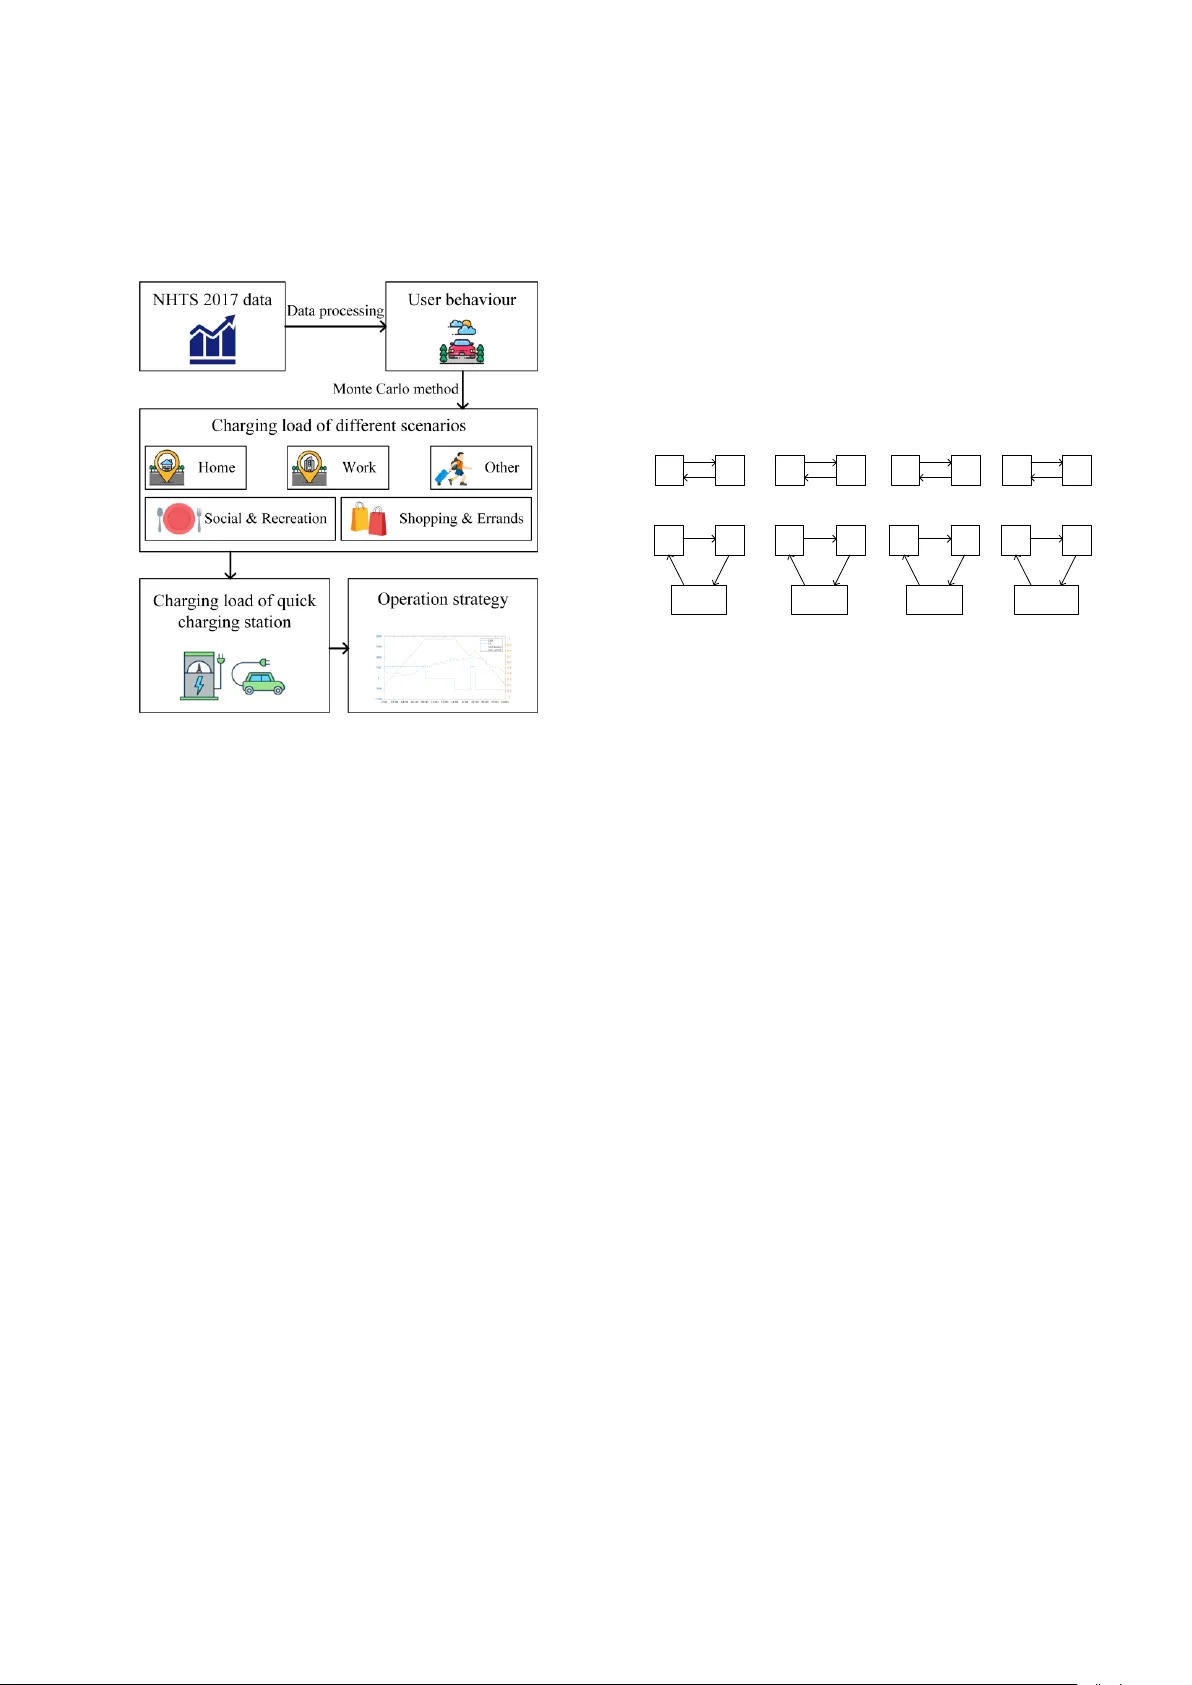
This article has been accepted in the 2019 Internatio nal Conference on Renewab le Power Generat ion (RPG 2019 ), Shanghai, Chi na, Oct ober 24-25, 2 019. 1 LOAD FORECASTING MODEL AND DAY-AHEAD OPERATION STRATEGY FOR CITY-LOCATED EV QUICK CHARGE STATIONS Zeyu Liu 1 , Yaxin Xie 1 , Donghan Feng 1* , Yun Zhou 1 , Shanshan Shi 2 , Chen Fang 2 1 Key Laboratory of Con trol of Power Transmi ssion and Con version, Ministry of Ed ucation, Depa rtment of Electrical Enginee ring, Shanghai Jiao Tong University , 800 Dongch uan Rd. , Shanghai, Ch ina 2 Electric Power Research Institute, S tate Grid Shanghai Mu nicipal Electric Po wer Company, 171 Handan Rd., Shanghai, China *seed@sjtu.edu.cn Keywords : ELECTRIC VEHICLE , QUICK CHARGE STATION, CHARGE LOAD FORECASTI NG, TRIP CHAIN, OPER ATION STRAT EGY. Abstract Charging demands of electr ic vehicles (EVs) are sharply increasing due to the rapid develop ment of EVs. Hence , reliable and co nvenient quick charge stations are req uired to respond to the needs o f EV dr ivers. Due to the u ncertainty o f EV charging loads, load forecasting becomes v ital for the operation o f quick charge stations to formulate the d ay -ahead plan. In this paper, based on trip chai n theory and EV user behaviour, an EV charging load forecasting model is established for quick charge station operators. This model is capable of forecasting t he charging demand of a city -locate d quick charge station during t he next day, where the Monte - Ca rlo simulation method is applied . Furthermore, based on the forecast ing m odel, a d ay- ahead p rofit-oriented operation strategy for such stations is derived. The simulation resul ts support the e ffectiveness o f this forec asting mod el and t he operation strateg y. The conclusions o f this pap er are as follows: 1 ) The c harging load forecasting model e nsures operators to grasp the feature of the chargin g load o f the next day. 2) T he revenue of t he quick charge statio n ca n b e dramatically increased b y ap plying the pr oposed da y-head operation strategy. 1 Introduction The usage of conventio nal internal-co mbustion e ngine vehicles is causing environmental pr oblems such as air pollution and global warmi ng as well as the concern of the shortage of fossil fuel. Electric vehi cles (EV s) are regard ed as a solution to these problems [1]. W hile the charg ing of E V batteries has brought challen ges to the operation of po wer system [2 -3], the adva ntages of EVs are b ringing t he rapid develop ment of EVs and the promotion o f EVs by governments around the world. EVs are considered as a kind of green vehicles, which is not only becau se they avoid producing fossil fuel po llution, but also becau se of their ability to consume sustainable energies, which are environmental-friendl y [4]. The us age of EV s requires the coordination of su pporting facilities, among w hich th e charging s tations are th e m ost important ones. At present, still a considerable percentage of the EV owners ha ve no private charging posts, which indicates the tre mendous need for public c harging facilities as the EV market grows [ 5]. The load forecasting o f a ce rtain char ging station is i mportant information to t he station oper ator. Some related studies include load forecasting for sites with general functions, b ut are not realistic enough for a real station [6]. A load forecasting met hod for q uick chargin g stations i s propo sed in this paper. For ordinary charging station s where EVs are charged in slow charging mode, the statio n operator s are able to integrate EVs into power s ystem b y d emand response. The o verload o f power system can b e relived b y d ischarging EVs during peak hours, where the statio n operato rs ca n also ear n profit [ 7]. Other profit source for load aggregators i nclude the d ay ahead scheduling in the day-ahead electricity m arket [8] and the ancillary services such as par king [9 ]. However, quick charging stations are not capable of participating i n the de mand response since t he EVs are seeking pro mpt charging service here. The small-scale load of a quick c harging st ation is not ad mitted in t he electricit y market, either. Ho wever, in so me regions, the peak-valle y electricity pr ice i s ap plied for char ging facilities, which ca n be made use o f to maximize the pro fit of the station [ 10 ] . Based on this, a day-ahea d operati on strategy for ESS (energy storage system) -equipp ed quick charging stations is proposed in this paper . The main contents of this paper are shown in Fig 1. The main contributions o f this paper are as follo ws: (1 ) Offer a detailed data processing pro cedur e for NHTS 2017 database, and extract the behaviour characterist ics of household vehicles. 2 (2) P ropose a Monte Carlo b ased charg ing load forecasting method for quick charging stations with which the chargin g load curve in the next 24 hours is predicted . (3) Present an operation strat egy for quick c harging stations charged by valley-pea k price. The ESS is involved in th e optimization. Fig 1. The main content s of this pap er 2. Methodology 2. 1 NHTS data processing In the scenario o f a city, the EV s can b e divided into sever al types by their us e, incl uding household EVs, passenger EVs, freight EVs and EV s for other spec ial purpo ses such a s post al purpose and touristic purpose. Among these EV s, passeng er EVs and freight EVs are p robably charged in passe nger stations or freight stations, and other EVs for special purposes ar e pro bably charged in co rresponding charg i ng facilities. However, a consid erable propor tion of household EV owners have no private chargin g post. In addition, t here is a possibility that house hold EVs require urgent char ging during t he trip , since household EVs are not as scheduled a s other EVs. Therefore , household EVs ar e t he major cu st omers of cit y-located quic k charge stations. Taking this fact into consideration , the char ging load of q uic k charging stations is mainly relate d to househ old vehicles, which requires t he research on household EV behaviour. Since household EVs are used for similar purposes as household petrol vehicles, it is n atural to assume that the behaviour of household EVs are similar to petrol vehicles. The destination of every household EV trip can be divided into 5 classes, wh ich are H (home), W (work), SE (shopping & er rands), SR (social & r ecreation), and O (other) [4]. Further, for a household EV, the owner’s home is a p lace where the EV periodically arrives. T herefore, the trips can be artificially separated by the moment when the EV arrives home. He nce, the trips of EVs for m closed chains where the owner’s ho me is included , which is called home-based (HB) trip chains. HB trip chai ns can be divided into se veral classes by t he number o f trips included in the chain and the midwa y sites, among which trip chains with 3 or fewer trips are mainly focused on. This is because t he trip chains with 4 or more trips in a da y usuall y contain stop -by trips suc h as dropping childr en at sc hool, where it is unlikely for the d river to get EV charged. Trip chains with 3 or fewer trips are divided into simple chains ( with 2 trips) and com plex chai ns (with 3 trips), and further divided int o several t ypes b y midway site s. The classificatio ns for trip chains are shown in Fig 2. Simple chains Complex chains H W SE/SR/O H SE W/SR/O H SR W/SE/O H O W/SE/SR H O H SR H SE H W Fig . 2 Classi fication of trip chains In this paper, N HT S (National Ho usehold Travel Survey) 2017 statistics ar e applied to analyse household EV behaviour. NHTS is cond ucted by t he Federal Highway Administration of America , a nd is the authoritative source on the travel behavio ur of the American public [ 11 ]. In NHT S 2017 data, t he ‘ trippub.csv ’ d atabase is used, which contains abo ut 9235 00 records of household trips, where necessary information of each trip is r ecorded. T he m ain information used in this research include the ID of the famil y and the vehicle, the trip date, the starting time, the endi ng time, the duration, the lengt h, the desti nation and whether it is a home-based trip. Based on NHT S 2017 statistics, the features of household EVs trips are anal ysed in following steps. Step 1. Read the data of the current travel recor d. For every vehicle, reco rd the concerned data. Step 2. When all necessary data for a closed trip chain is recorded, add it to the data set for t he corresponding trip chain type. Step 3. Accumulate t he data for every trip o f every type of trip chains i n the data sets, and fit the m with kernel density estimation method. From this d ata processi ng proced ure, following i nformation is obtained: (1) The distribution of a) starting/ending time b) trip d uration c) trip length d) av erage velocit y in every trip of every type o f trip chains. (2) T he distribution of staying duration at every midway site of every type of trip chains. (3) The pr oportion of every type of trip chains. 3 2. 2 Load forecasting mo del Based on the in formation o btained by data pr ocessing, a Monte-Carlo-based lo ad forecasting method is established . The whole trip chains of EVs are simulated in a way t hat is designed to be close to the real usin g scenarios. In the simulation, necessary p arameters are generated accor ding to the fitted distribution. a) Ending time o f trip 1 : considering t hat the start time of a day’s schedule is r elatively fixed (e.g. ti me for work, appointments with clie nts o r friends), the first m ome nt to be generated is set to be the ending time o f trip 1. b) Length & average velocit y : for ever y trip, the length is determined b y the distance bet ween the star ting site a nd the destination, and is the major influence factor on electricit y consumption, w hile the tr ip d uration is affected by several factors . The average v elocity, which is a ffected b y factor s including weather and traffic congestio n, is the determinant for trip duration when lengt h is fixed . c) S taying d uration at midway sites : t he duration at the midway site is another i mportant data in user b ehavior (e.g. work hours in a n H-W -H trip chain). The above parameters are obtained b y r andom extr action accor ding to the f itting distribution of corresp onding data set. d) Charging dema nd : the principle of charging is to en sure the usage o f EVs. T herefore, the EVs are set to be charged when the SO C ( state o f charge) is inadeq uate for the next trip . Considering a security redundancy of 30% SOC rem ained after the next trip, the char ging condition is expressed as: / 0.3 nn SOC ul p (1) The EV’s SOC at the n th site can be calculated b y 11 n n n SOC SOC ul (2) where the initial SOC ( 0 SOC ) is set to b e 1 if the user o wns a private chargin g po st, or a ran dom value in [0.5, 1] if the user does not. When a n EV is charged at a site , the char ging po wer of it is added to the charge load of the quick charge station at this site during the whole charging duration. The chargin g duration at site n is the minimum bet ween sta ying time a nd the necessary charging ti me till the EV is fully charged. , m in , ( 1 ) / ch arg e n sta y n T T S O C c p (3) The sim ulation pr ocedure can b e expressed as the flow chart in Fig. 3. Though the charging load features or all 5 kinds of sites are extracted by the above proced ure, in reality, a location in a city cannot be simply clas sified as a single -function ed site such as a home site or a work site. T he comm on situation is that a quick c harging station is surrounded by reside ntial buildings, office buildings, malls, hospital s, which indicates that certain propor tion of functions o f the ci ty a re accumulated in the effect ran ge of the station. The final lo a d of the station is 5 1 station i i i p p r (4) where i p and i r are th e load and the proportion of 5 site properties in the studied area. For instance, if the p roportion of H site is 1 0.04 p , 4 % of the city residents live in the affective area of the statio n. Enter original data i = i +1 i = 0 Generate private cha rge pi le ownership and chain type. Generate the ending time, length, ve locity of tri p 1 Generate length and vel ocity of t he ne xt t rip Charging needed? Add the charging l oad t o the midway site Arrived home? Charging needed? Add the charing load to H site i = N? End Yes Yes Yes Yes No No No No Fig 3 Flow chart for Monte Carlo simulation procedure 2. 3 Operation strategy In m a ny countries and regions, the time- of - use elec tricity tariff is applied for EV charging station s, which means that the elec tricity pr ice for station operator s is higher during t he peak hours . Since the p eak of char ging demands tend to be reached during the peak electricit y price hours, a quick charging station will probably have to pay a higher electricity bill without proper operation strateg y. T o solve this pr oblem , an oper ation strategy for E SS-equipp ed q uick charging stations is propo sed. During the valley hours, the electr icity price is lo wer than that in peak hours. T herefore, th e total electricity co st for charging station operato rs will be lo wer if the ESS is charge d 4 during va lley hours and discharged to co ntribute to the charging of EVs. This requir es the o perator to schedule t he charging and discharging of the ESS. Assume that the electricity price i n a day is () mt , the capacity of the ESS is ES S c , the m aximal chargi ng and discharg ing power of the ESS are , ESS c p and , E SS d p , the charging po wer of EVs is EV p , the charging po wer of ESS is () ESS pt , w hich is minus when the ESS i s discharging. Hence, t he total load of the station is ( ) ( ) ( ) ch ESS EV p t p t p t (5) The object function is to minimize the electricity bill during the whole 2 4 hours in a day. Constraint s include (1) power limits: the c harging and d ischarging po wer of ESS do es not exceed the limits; (2) capacity l imit: the SOC of ESS does not exceed 1. Therefore , th e proposed optimization m odel can be expressed as min ( ) ( ) ch p t m t ( 6) ,, s.t . ( ) ES S d ES S ES S c p p t p (7) 0 ( ) 1 ESS SOC t (8) 1 ( ) ( ) i ESS ESS ESS k c SO C t p t (9) 3 Case study 3.1 NHTS 20 17 data processing results According to the data pro cessing pr ocedure, the trip features of household vehicle s ar e extracted. Several features are observed in the results. In F ig 4, the histogram o f the ending time o f trip 1 in the H- W-H trip chai ns is drawn in blue, and the CDF (prob ability density function) of the fitting distribution is dra wn in red. It can be seen fro m the histogram that it is diffic ult to tell wh ich typical distribution the ending time of tip 1 o beys. T o handle this problem, ker nel estimation method is applied in the d ata fitting. Kernel d ensity estimation is a non-para metric estimation method which is capable of fitting the dat a completely based on the proper ties of d ata itself, instead of fitting with a d efault distribution t ype, which is the reason this met hod is applied in data fitting. The results prove that kernel d ensity estimation has a remarkable e ffect in the data fitting. 0:00 02:00 04:00 06:00 08:00 10:00 12:00 14: 00 16:00 18: 00 20:00 22:00 24:00 4000 3500 3000 2500 2000 1500 1000 500 Frequency 0 1 2 3 4 5 6 -3 10 Probability F ig . 4 Ending time of trip 1 in the H-W -H trip chains The distributions o f the ending time of trip 1 and midway s ite staying duration in simple tr ip chains are illustrated in Fig 5 . According to the distributions shown in Fig 5 (a), the probability of an EV being charged at the W site in H -W- H trip chains is obvio usly hi gher in 06 :00 -09:00, while t he p eak of H- SE -H, H- SR - H, H-O- H are reached at around 11:00, 18:00, 08:00 , which is basi cally consiste nt with the life experience. The distribution o f sta ying duration at midw ay site is shown in Fig 5 (b). T he sta ying duration at W site in H -W-H chains are m ost probably between 8 to 10 hours, while the midway duration of other four chains ar e relatively shorter, which is usually no more than 4 ho urs. It is observed that the endi ng time of ever y trip and the staying duration are o bviously related to trip chain types, which ill ustrates the rationalit y and the neces sity of introducing different trip chai ns. 0:00 02:00 04: 00 06:00 08:00 10:00 12: 00 14:00 16:00 18:00 20:00 22:00 24: 00 0 1 2 3 4 5 6 -3 10 Probability ( a) 0h 2h 4h 6h 8h 10h 12h 14h 16h 0 0.002 0.004 0.006 0.008 0.010 0.012 Probability Staying duration ( b) Fig 5. (a) The distribution of the ending time of trip 1 , (b) the distribution of midway site staying duration in simple trip chains 3.2 Load forecasting In the Monte Carlo simulation, a 48 -hour d uration is considered. Since the first 24 hours ar e under the effect of initial conditions, only the res ults d uring t he la st 24 hours ar e taken. The in put information includes the percentage of EV uses owning pr ivate c harging posts own p , the EV number in the 5 studied area EV n , the charging p ower ch ari ng p , the capacity of EVs EV c , the electricit y co nsumption p er kilometre u and the propo rtion of the 5 site pr operties of the station i n the studied area pro q . The simulation input is s hown in Tab le 1 . Table 1 Inputs of the forecasting model Parameter Value own p 50% EV n 10000 ch ari ng p 60 kW EV c 40 kWh u 0.2 kWh/km pro q [0.04 0.1 0.2 0. 1 0.1] The charging load of the 5 sites are sho wn in Fig 6. And the forecasting result of the c harging load of the quick c harging station is shown in Fig 7. 1000 500 0 0:00 02:00 04:00 06:00 08:00 10:00 12:00 14:00 16:00 18:00 20:00 22: 00 24:00 1000 500 0 1000 500 0 5000 2500 0 20000 10000 0 Charging load/kW Fig 6. Charging load during a day at 5 sites 0:00 02:00 04:00 06:00 08:00 10:00 12:00 14:00 16:00 18: 00 20:00 22:00 24:00 0 100 200 300 400 500 600 700 800 900 1000 1100 Charging load/kW Fig 7. The charging load o f the station In Fig 6., t he 5 curves are t he charging load of H, W, SE, SR, and O sites in a da y respec tively. The exi stence of h uge difference among the load curves at 5 sites can be observed. The different c harging load curves have different time features, for instance, the ho me site had the peak charging load at around 1 8:00, which is the usual ti me when EV user s finish a day’s schedule and drive back ho me, while t he peak charging demand at the work site is reached at a ro und 08 :00, which is the usual start of work hours. Besides, it is observed that the char ging load at H site is much larger than t hat o f other 4 s ites, which indicates th at the chargi ng sta tions located in residential areas tend to have larger charging de mands. Based on the forecastin g results of 5 sites prese nted in Fig 6, the forecasted chargi ng load of the fictitious c harging station shown i n Fig 7 is acq uired by (4). The op eration strategy for the next day is solved based on the load forecastin g. 3.3 Op eration strategy results In this section, the e ffectiveness of the operation strategy is supported by the simulation results. The parameters of t his station ar e listed in Tab le 2. The price infor mation i s li sted in Table 3, which is taken from G uangzhou, G uangdong Province, China [1 2 ]. Fig 8 s hows the o ptimal str ategy in the seco nd day for a 3 - day inter val op eration o f t he station. It can be see n t hat t he ESS is charged in 00:00 -08:00 and 17 :00-18:00, an d discharged in 14:00 -17:00 and 18:00- 24: 00. Table 2 Station parameters for case stud y Parameter Value ES S c /kWh 5 445 , ESS c p / kW 5 45 , ESS d p /kW 5 45 Table 3 Electricity price in a da y Hours Price/(¥ /kWh) 00:00-08 :00 0.3338 08:00-14 :00 0.6380 14:00-17 :00 1.0282 17:00-19 :00 0.6380 19:00-22 :00 1.0282 22:00-24 :00 0.6380 0:00 02: 00 04:00 06:00 08:00 10: 00 12:00 14:00 16:00 18: 00 20:00 22:00 24:00 - 1000 - 500 0 500 1000 1500 2000 0 0.1 0.2 0.3 0.4 0.5 0.6 0.7 0.8 0.9 1 Fig 8. Operation of ESS -equipped quick charging station 6 According to the simulation results, generally, the ESS is charged when t he electr icity price is low and discharged when the price is relatively high. However, it is noticed that the ES S is not simply charged during valley hours and discharged during peak hours, which see ms to be the m ost economic strategy for a single day. The char ging scheduling of the ESS is a long-term process where the compro mise of the short -term pro fit is needed. According to the profit of the fictious station d uring the 3 -da y interval, which is sho wn in Table 4, in the 3-day interval, a 24.51% reduction in electricity cost is realized by applying the proposed strategy. Table 4 Pr ofit of the 3-day interval in di fferent situations Without ESS/¥ Scheduled operation /¥ 60855 45937 4 Conclusion Based on the trip c hain theor y, an EV char ging load forecasting model is established for quick charg ing statio ns, where the NHTS 201 7 data is applied in the analysis o f user behaviour. A detailed data p rocessing proce dure for NHTS 2017 is proposed in this pap er, which gi ves the method of user behaviour analysis based on this database. The analysis result revea ls the feat ures o f user b ehaviour. T he Mo nte- Carlo-based load forecasting method is capab le of forecasting the charging load of a quick charging station during a whole 24 hours, which is suppo rted by simulat ion results. Furthermore, an operation strategy for q uick charging stations considering the usa ge of ESS and peak -valle y price is proposed in this paper. The simulation result s hows that, the reasonable application of ESS provides a considerab le reduction on station o perator’s electricit y cost. The most i mportant contribution o f this p aper is that, it provides the load forecasting method and the o peration strategy for quick charging stations, which is rarely mentioned in existin g resear ches. Furt her r esea rches may involve more tar geted data of electric vehicles, which provides m ore detailed information about the EV trips. For instance, the influence factors of electricity consu mption and a more refined modelling o n the location o f the station can be the next research d irection. 5 Acknowledgements The authors gratefull y ac kno w ledge the supp ort from t he Shanghai Sailing Pr ogram under Grant 19 YF1423800 , the Technology Progra m of SGCC under Grant 520940 18002P , and the Particip ation in Research P rogram ( PRP) of Shangh ai Jiao Tong University under Grant T 030PRP 35071. 6 References [1] Tavakoli, A., Negnevitsky, M., Nguyen, D. T., et al.: ‘ Energy exchange bet ween electric vehicle load and wind generating utilitie s ’, IE EE Transactio ns on Po wer Systems, 2016, 31, (2), pp. 1248 – 12 58 [ 2] Qian, K., Zhou, C., Allan, M., et al.: ‘ Mod eling of Loa d Demand Due to EV Battery Char ging i n Di stribution Systems ’, IE EE Transactions on Power Systems , 20 11, 26 , (2), pp. 802 - 810 [3] Xu , S., Yan, Z., Fe ng, D. , et al.: ‘ Dec entralized c harging control strategy of the electric vehicle aggrega tor based on augmented Lagrangian m ethod ’, International J ournal of Electrical Power and Energy Systems, 2019, 104, (1), p p. 673 - 679. [4] Zhou, Y., Yan, Z., Li, N. : ‘ A novel state of charge ( SOC) feedback strategy in wind p ower smoothing based o n short - term forecast and scenario anal ysis ’, IEEE Transactions on Sustainable Energy, 2 017, 8 , (2), pp. 870- 879 [5 ] Yang, T ., Long, R., Li, W ., et al.: ‘ Innovative Applicatio n of the Public – Private Partnership M odel to the Electric Vehicle C harging I nfrastructure in China ’, Sustainabilit y, 2016, 8 , (8), pp. 738 -755 [6] Chen, L., Nie, Y., Zhong, Q .: ‘ A Model for Electric Vehicle Charging Load Forecasting Based on T rip Chains ’, Transactions of China Electr otechnica l Societ y, 2015, 30, ( 4), pp . 216- 225 [7 ] Han, B., Lu, S., Xue, F., et al.: ‘ A T wo-Stage Electric Vehicles Schedul ing Strateg y to Address Eco nomic Inconsistency Issues of Stake holders ’. 2017 IEEE Intelligent Vehicles Symposium , Redondo Beach, USA, J une 2 017, pp. 1904 -1909 [8 ] Sh afiullah, M., Al - Awami, A . T .: ‘ Maximizing the pro fit of a Load Aggregator by Opti mal Schedulin g of Day ahea d Load with EVs ’, 2015 IEEE International Co nference on Industrial T echnology (ICIT) , Seville, Spain, March 201 5, pp . 1342 - 1347 [9 ] Guo, Y., Xiong, J ., Xu, S., et al.: ‘Two -stage Econo mic Operation of Microgrid- Like Electric Vehicle Par king Dec k’, IEEE Transactions on Smart Grid, 2016, 7(3), pp.1703 -1712 [ 10 ] ‘Notice on the Electr icity P rice of New Ener gy Automobiles’, http://d rc.gd.gov.cn/ywtz/conte nt/post_8338 57. html, accessed 25 Ma y 2019 [ 11 ] ‘National Household Travel Survey’, https://nhts.orn l. gov/, accessed 25 May 2019 [12 ] ‘The Electricity Price of Guangzhou ’, http://d rc.gd.gov. cn/ywtz/content/post_83 3857.html, accessed 25 Ma y 2019
Original Paper
Loading high-quality paper...
Comments & Academic Discussion
Loading comments...
Leave a Comment