Economic Evaluation of the Portuguese PV and Energy Storage Residential Applications
In the residential sector, energy micro-generation and its intelligent management have been creating novel energy market models, considering new concepts of energy use and distribution, in which the prosumer has an active role in the energy generatio…
Authors: Ana Foles, Luis Fialho, Manuel Collares Pereira
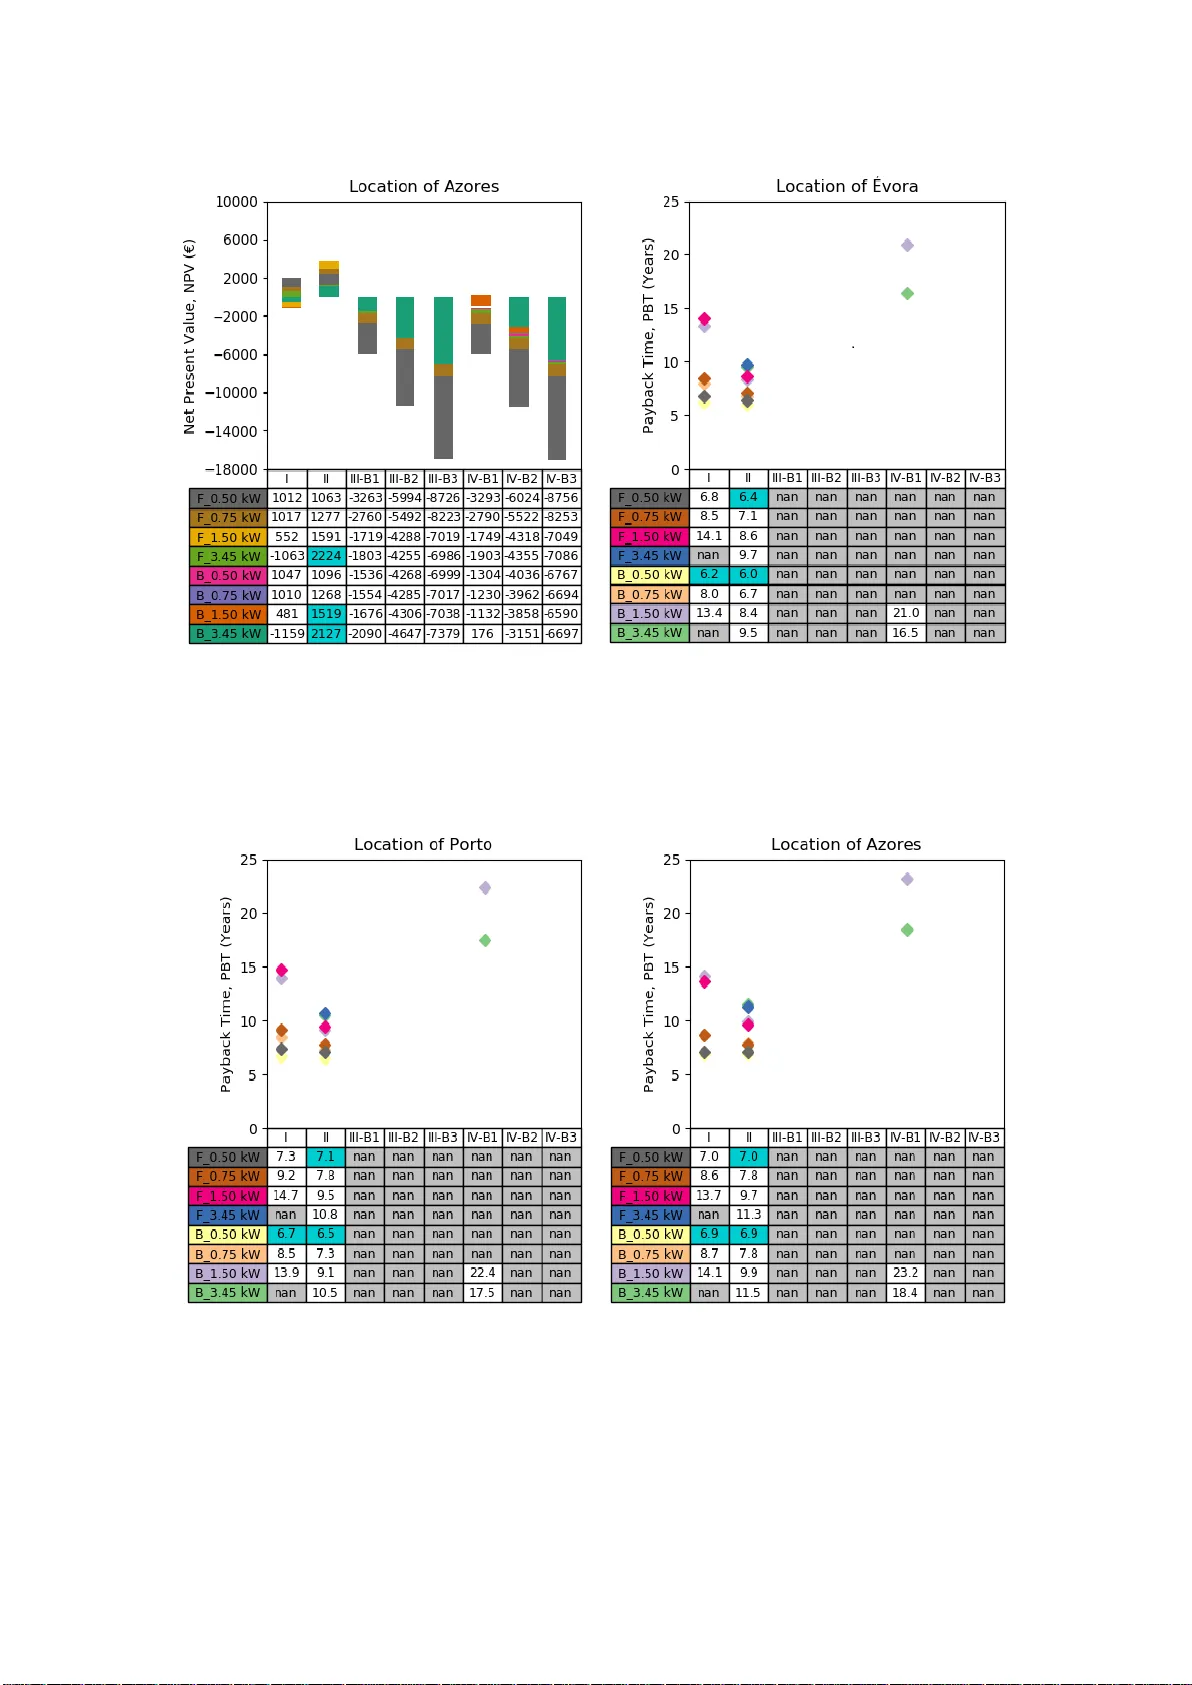
1 Economic Evaluation of the P ortuguese PV and Energy Storage Residential Applications An a Foles a,b ,1 , Lu ís Fial ho a,b ,2 , M anuel Coll ares-Per eira a,b ,3 a Renewable Energies Chair, University o f Évora, 7000 -651 Évora, P ortugal b Institute of Earth Science s, Univer sity of Évora, Rua Romão Ramalho, 7000-671, Évora, Portugal 1 anafoles@uevora.pt 2 lafialho@uevora.pt 3 collarespereira@uevora.pt Abstract In the residen tial sector, en ergy micro-gen eration an d i ts intell igen t mana ge men t ha ve been creatin g n ovel e n e rgy market m ode ls, con siderin g new conce pts of ene rgy use an d distrib ution, in which th e prosumer ha s an active role in the energy g en eration and its self- con s u m pti on. The confi gura tion of the sola r ph otovoltaic syste m wi th a b attery en erg y storage in Portu gal is un c le ar in t h e techn ical, e n ergetic an d mostly in t h e econo mical poin t of vie w . The en ergy generati o n and con s umption mana gement , join t ly w ith t h e battery ope ration , have a great in fl u ence in t h e configu r ati o n ’s profita bility v alue . T h e presen t wo rk evalu ates differen t photo voltai c con fig u r ati o ns with and with out en ergy storage for the n ormal low voltage C con s u m er profil e, for a con t ra c ted po w er o f 3.45 kVA , to e v al uate th e sy stems’ cost-effe ctiven ess, framed in th e regulation in force in Portugal - the decree-la w 153/2014 -, whi c h promotes th e m ic r o-gen eration a n d self-con s u m pti on. T h e an a ly sis consist s of th ree diffe ren t geograph ical locati o ns in t he coun t ry, con s i derin g di stin ct el ect ric tariffs . The se are rele van t parameters in the c h oice of th e con figuration , c on cludin g t ha t al thou g h the sola r pho tovolta ic syste m by i tself is already economical presen tly, its in tegration wi t h battery ene rgy storage i sn’t in most of th e c on figu ration s, how ever it is alread y po ssibl e to fin d profita bl e PV+battery c on figuration s , consid ering all t he most rele van t cr i teria, and s up ported by g oo d ene r gy man agem en t. Highlights • PV -only c on figuration s are m ore p rofitabl e than PV +battery in Po rtugal • Mo s tly in Évora an d Porto PV +battery con figura tion i s beco min g profi tabl e • In average its 2 2% more econ om ic to inve st in a grid-conn ected in stall ation in Évora • Best LCOE occu rs w ith th e biggest an d sma l l est PV in stalla t ion s 2 Keywords Sol ar Photovolta ic Battery Ene rgy Sto rage Resid e n tial Self-Con s u m ption En ergy Gen eration Econ omic Asses smen t Portu g u ese Legisla t i on List of Abbreviations, Acronyms, Initials and Sy mbo ls An a ly sis Period, N - th e amoun t of ti me or th e period an an a ly s is co v er s . B/C – Ben efit- to -Co st Ra tio. Base Ye ar - Ye ar to wh ich all cash fl ow s are con verted. BTN – No rmal low v ol tage. BU – Battery use – quan tifies the use of the battery in c ompari s on w ith t he su m of th e energy loa d profile, in on e y ear. Cash Flow - F - Net in c ome plu s amoun t char ged off for deprecia t i on , depleti on, amortizati o n , and extrao rdin ar y cha r ges to rese rv e s . CE – Certi ficate o f Expl oitation , n eeded in some of the PV con figuration s, de fine d in t h e Portu g u ese curren t legislati o n. Con tracted Po w er – On e of the defin ed par amete rs in th e electricity con tr act , w hi c h defin es th e maximu m pow er nu m be r of househo ld a pplian c es wh ic h a re generally u s ed simul taneously , in the do m estic s ec t or. DGEG – Di rector Ge n eral of En ergy and Geo log y. Discoun t Rate - Th e rate used f o r c o m pu ting p resen t valu es, wh ich reflects the fact t h at th e valu e of a c ash f l ow depends on t he time in whi ch the flow occ u rs . Discoun t r ate, d – Mea su re of t h e t i me valu e, which is the price put on the time that an in vestor w aits for a retu r n of an in vestment. DL – De cree-La w. DSO – Di s tri bution Sy stem Opera tor. 3 Ele c tricity T ariff – Pri c e pay ed by th e con s u m er for the electricity which is consu m ed fr o m th e electricity company , gene r ally expressed in €/kW h. ERSE – Regu latory En tity of En ergy Se r vices. Fee d-in tariff (FIT) – Fixed ele ctricity price s paid to RE produ c er s , for each unit of en ergy produ ced an d in jected into th e electricity grid (kWh). Th e paymen t is estab lish ed for th e ana ly sis peri od, regardi ng the lifeti me of th e pro j ect. In flation Rate, a - T h e rise in price levels caused by a n increase in availa ble c u r ren c y and credit w ithout a proportio nate increase i n avail able goods an d s ervices of equ al quality . In flation does n ot in clude real escal ation. Inflati on is normall y expressed in terms of an annua l percen tage chan ge. In vestmen t Year - The yea r in whi c h a c ap ital or e q u ipment invest m en t is ful ly c on structed or in stalled an d p l aced in to service. In vestmen t , I - An expen d itu re for wh ich retu r n s are exp ected t o e xten d bey ond 1 y ear. IRR – In ternal Rate of Re t u rn (%). LCOE – Level ized cost o f el ectricity (€/k W h) . Life -Cy c le Cost, LCC - The presen t value over th e analy s is peri od of the system res ul tant costs. Mi BEL – Iberian Ma r ket fo r Elect ricity. Net-mete ring t ari f f - In c en tive wh ich allows th e stori n g o f en ergy in t h e electr ic grid . T h e surplu s ele ctricity gen erated by solar m od ules is s en t to the grid, an d when the produ cer doe sn’t produ ce enou g h ele c tricity to c ove r i ts nee ds, pu r ch ases electricity fro m the g rid . The bal a n ce is a cr ed it, wh ic h i s discoun ted in the el ectr icity bill . NPV – Ne t p resent valu e (€) . OM iP / OM iE – Portugu ese/Span is h bran c h of MIB EL. perspec t i ve in the b ase ye ar. PVOM - Pre s en t valu e of all O&M c ost s (€) . REN – Na t i on al Electric G rid. RES – Re newa b le En erg y Sources . SCR - Sel f-c on sumptio n rat e. SLR – Su pplier of Last Re sort. SM R – Sa v ed mon ey rate. SSR – Se lf-s u pply rate. 4 Stan dard Devi ation - A statistical te rm that measu res the variabi lit y of a set of observa t i ons from th e mean of the di s trib u t ion . Tax Rate - Th e rate appl ied to tax abl e in c ome to de t er m in e federal and state in come ta xes. TLCC – Total life cy c le cost (€) . TSO – T ran smission System Ope r ator . UPAC – Sel f-con sumption Produ ct i on U ni t . UPP – S m al l Produ ction Unit. - Sum v al ue of the a nnu al cash fl ow s ne t annu al costs (€); - Electrici t y bill of on e ye ar, for each location a n d electricity t ari ff (€); – Ele c tri c ity bill savin g s with t h e st u died con fig u r ati o n (€); - Ene rgy sen t to th e ba ttery (kWh ) ; – Su m of th e en erg y lo ad pro file, for on e year (kW h ) ; - Sup plie d energy in kW h , i n mon t h ; - Net cash flow , i n y ear n; - average Iberia n el ectricity gross market closin g price ( OM IE) for Po r tu g al in €/kW h , in month ; - En ergy gen erated th r ou g h t he PV system w hich is self-con sumed ( kW h) ; - Total g en erated e nergy f ro m th e PV syste m (kW h ); - E ne rgy ou t pu t or sa ved, in y ear n ; - S old e n erg y price in € , in m on t h ; - Non discoun t ed in c remen tal in vestmen t co sts (€); – Operatin g and main tenance cost s (€ ); 1. Introduction In con t rast to fo ssil fuelle d energy g en erati on, ren ewabl e e ne r gy (RE) source s are cha r acteriz ed by abundan c y i n the environ men t a nd l ow er pollution . Devel oped co un tries are evol vin g in the sen se of diversi fyin g th eir energy sou rc e s , i n t egrati n g micro- gen eration i n th eir low voltage (LV) n etworks , s h aping m ic ro-grids (MG). Mi c ro- grids c ou ld be designed for 5 RE to ful ly m eet th e lo cal con sumpti on l oads, con siderin g the use of a stora g e un it to bal ance th e supply a n d deman d, c on siderin g the control of th e energy f lo ws, wh ic h can requi re the gen eration of en ergy o r th e shi ft in g of th e con s u mption load s in the resi den t ial l oad dia g ram. Ele c tricity gene ration fr o m RE sou rc es can be describ ed as dispa tch able or non-dispatcha bl e ren e w ables, r e g ardi ng the abil ity of the e ne r gy sou r ce to be con t rol le d g ivin g respo nse t o syste m requ irements, such as the con sume r load s in t h e reside n t i al s ecto r. The first grou p in clud es t h e hyd r oe le ctric, geoth erm al and biomass pow er, an d the s econ d the wind , sola r pho tovolta ic (PV ), con cen trated s ol ar pow er (CSP) an d w ave and ti dal power. RE i ntegrated in t he powe r grid requi r es chan ges in t h e existin g ne tworks, s i n ce allows bidirectio nal f l ows of ene rgy t o ensure gr id s tab ili ty ; effici ent grid mana g emen t m e c h anis ms to improve g rid flex i bili ty , respo n s e a n d secu rity of su pply; imp r ov e m en ts in the inte rconnecti ons (in cr ea sin g capab ility, relia b ili t y a n d s tabi lit y ), in t rodu c in g device s an d m eth ods of operati on to ensu r e stabil it y and control (volta g e, f r equ en c y , pow e r b al ance) ; introd uction of e n erg y storage (ES) aimin g the syste m flexi bility and secu rity of su pply [1]. The i n tegrat i on of sola r PV modul es at a resid en t ia l sc al e allows th e e n ergy efficien cy ac h ievement, in c reased l ocal reli ability, redu ction of en ergy losses, an d easy archi t ecture in tegration . Cost-co mpetiti ven ess of so lar PV an d reduction of supp ort schemes ha d made possi bl e new b u si ne s s models to eme r ge , mostly in northern Europe. PV electricity generates revenu es th r ou gh t h e in jection into th e grid or by opti mizati on of self-consu m pti on , allow ing th e redu ction of th e el ect ric bil l and t h e growin g of n ew energy flow m od els for th e h ouseh o ld er/b u s in essman. The price dec re ase of sola r PV modu les and ES techn ologies will in crease competi tion on the decen tr ali z ati o n of en ergy gene ration /c on sumpti on m od el s. En ergy consumers are curren tly in tereste d to play an active rol e n ot only in the use of RE sou rces, b u t also i n th e generation o f RE. Th ese con s u m ers are referred as prosu m ers and are motivated by the energy b i ll r edu ct i on an d high er control , m ore accu rate respon se and environ m en t sustain abili t y, wi t h c le a n a nd c h e ap ele c tricity , con sumin g l ocal and supp ortin g t h e grid ope ration . Storage op eration creates flex i bl e m arke t s, da ta acces s an d mana gement, coope r ati on be t we en TSO an d DSO [2]. Ele c tric b a t te ry tech n o lo gies will pl a y a significan t role in Europ e’s En ergy Uni o n fram ew ork. Regardi ng the te n k ey action s de sign ated in th e SET - Pla n , it is e stabli shed to “become competi tive in t h e global ba ttery sector to drive e -mobi lity an d ES f orw ard” [3]. Electri c i ty storage in volves th e con vers io n of ele c tri c ity in ano ther f or m of en erg y and i s c u rren t ly exe cute d through techn o lo gies whi c h differ in perfor mance, characteri stic s and ope r at ion. ES can b e con d u c ted by pu m ped-hy dro stora ge, co m p r es s ed-air ES , ele ctric batte ries, sup erc on ductin g magnets, fl ywh eel s , supe r -capa c i tors, ch emical storage an d th ermal storage, or can be obtain ed th r ou g h end -u s e techn ologie s, su ch as plu g -in electric vehicl es [1]. New and cost-effective s tora ge tech nologie s are bein g de v el o ped . Apa r t from miti g a t in g powe r fluctu at i ons, ES syste ms can play other roles with PV technolo g ie s , su ch as loa d - shi ft in g (storin g en ergy du r in g low demand period s and discha rg in g in h igh d eman d p eriods). 6 Compared to oth er s tora g e opti on s, m en tioned abo v e, batterie s ha v e beco m e p opu lar in reside n t ial ap plian ces due t o gene r al simp li c ity , materia ls avai labili ty , techno logy m at urity and r el atively low c ost. Accordi ng to BNE F, the average p rice o f lithiu m -ion b attery tech nol og y wa s 1 160 $/kWh in 201 0, 176 $/kWh in 20 18, and for 203 0 th e e xpe cted val ue is 62 $/kW h [ 4] . The battery t echn ologie s and the most used correspon den t applicati o ns ar e shown in Table 1. Table 1 - Battery te chnologies and grid applications [5]. Application/ Technolo gy Lithiu m- ion Lead Acid Sodium- sulphu r Flo w batteries Load shi fting – reduc ing exces s renew able energy curtailm en t Suitable Suitable Suitable Suitable Frequency r estoratio n reserve s Suitable Unsuitab l e Unsuitab l e Unsuitab l e Capac ity re serves Suitable Suitable Suitable Potent ially suitabl e Transm i ss i on an d distribut i on system up grade de f erra l Suitable Suitable Suitable Potent ially suitabl e Voltage s u pp ort Potent ially suitabl e Unsuitab l e Unsuitab l e Unsuitab l e Spinnin g re s er v e Potent ially suitabl e Suitable Potent ially suitabl e Potent ially suitabl e Chin a is the lea der in PV s ol ar en ergy in stallati ons, foll owed by USA, J ap an, Ger m any and Italy . As m a r ke t le ade r, Ch ina h as in force exclu sively photovolta ic p olicies a s th e “13 th Solar En ergy Develop men t Five Y ear Plan (2016- 2020 )” imple m en ted in 8 th Decembe r 2016 , in whi c h committed to rea c h to 105 GW of solar ph otovoltaic c ap acity. Sin ce 2010, a progra mme pro v i des u pfron t subsi dies for grid -con nected r oo ftop an d BIPV [6]. Spain ha d Roya l Decree 9 00/2 015, b u t c u rr en tly th e Roya l Decree Law 244 / 2019 is i n force, a nd accou nts with d ifferent self-c on sumption sch emes, defin es commu nal self -con sumpti on, simpli f ie s th e re mune r ati o n related w ith surp lu s en ergy for PV installed powe r no l arger th a n 100 kW (month ly net-meteri ng) [7] . The “ Na ti onal Renew a bl e Energy Act i on Plan 2011 - 20 20” defin ed a 20.8 % s h are of g en erated renewab le energy s ou rces in gr os s final e n ergy con s u m pti on [6]. Fran c e w orks almost exclu s ivel y with f ee d -in tari ffs, an d it do es n ot have a self-con sumption sche me, al t h ough a communi t y po wer sch em e ha s been studi ed . Th e pho tovolta ic feed-in ta riff is i n force since 20 06, last up dated in 20 16, and h as tw o m ai n varian ts: bu ildin g installation s small er than 100 kW, an d it is ad j u sted eve r y s e m e s ter ; an d ten ders for bu i l dings instal lations larger than 100 kW an d g roun d-m ou nted plan ts . Targe t ed a 32 % o f RES in gro ss f i n al e n ergy consu m pti o n , estab li s h ed in July 2 015 , 40 % in electricity and 15 % in tran s po r ts. Italy has made a storage sy stem re g u lation in 2015 i dentifyin g tech ni cal specification s to i nclude storage into the n at i onal ele c tricity , an d the “National En ergy Strategy ” approved in 2017 promote s th e integrati on of stora g e systems t o accommod ate the gro w in g pen etration of RE sou rces. T h e sola r p hotovol taic fin ancial in centives wh ich s tar t ed in 10 th Ju ly 2012 were c u t in 25 th Jun e 2014 . MiS E h as prese n t ed 7 provisi on s wh ich will grant fin a n c i al in c en tives to pu rc h ase ele ctric or h ybrid vehi c l es, or low carbon emission ones, up to th e end of 2021 [8]. In 1 st Ma rch of 20 16, Germany h as s t arted a subsidy for solar ph otovoltai c in s tal l ations wi t h battery storage for resid ential install ation s: th e sc h eme offer s soft loan s u p t o 2000 € / kW for solar ph otovol t ai c syste m s an d capital gran t coveri ng up t o 25 % of the eligibl e solar panel . T h ese valu es are upda ted (down wards) every six mon ths. T h e Nation a l En erg y Action Plan in force i n Ge rmany was imple m en ted i n 2010 and has the 2020 targets for 18 % of ene rgy gene r ated from RE , throu gh 37 % of ele ctricity and 13 % for transpo rts comin g from RE S. Un ited Kingdo m s ta rt ed a feed-in tariff for ren e w able electricity , includin g solar ph otovoltai c, in 2010 and last upd ated in 201 5, for small- scale (less than 5 M W ). Targets in 2020 are that RES represen t 15 % in g ro ss fin a l e ne rgy sou r ce, 31 % of e lectricity an d 10 % of en erg y deman d [6]. In Ind ia, The Uttar P rade s h Ele c tricity Regulato r y Commission defin ed net -meterin g regula t ion s for rooftop solar pho tovolta ic, ru nnin g f or 25 ye ars. The tariff is set to 7.08 INR/k W h an d ha s en tered in forc e on 20 th of Ma rch 20 15. In dia’s Mi nistry of New and Ren ewable En erg y c o mm i tted to a ta r ge t of 1 75 G W i n 2022, w h ere 100 G W co m e s fro m s ol ar ph otovoltaic, 6 0 G W fro m w ind and 1 6 GW from bio m ass and small hydro [6] . T h e Depa r tmen t of th e En vironmen t and Ene rgy of Au s tral ia 2016 provid es fu nds for c o mm u nity grou ps in region s across the coun tr y t o install rooftop sola r ph otovolta ic, s ol ar h ot wa t er an d solar -con nected battery syste m s. The Rene wable E n erg y T ar get (RET) is designe d t o deli v er a 23.5 % share f or renew ables in Au s tral ia ’s electricity m ix by 20 20 [6]. The number of RE app lication s in Portugal is in cr ea s in g accordi ng to the licen s e requ ests. In March 2 018 the electricity g en erati on from RE w as bi gger than t h e effective consu m pti o n of ele c tricity in Portugu ese contin ent. T h e c u rre n t Portu g u ese Secretary of State of Energy ann oun c ed t he Portu gal’s first de dica ted auction for 1.35 GW for m id-20 19 an d 700 MW by 202 0, tendin g to 50- 100 MW for dispa tch able renew a bles, clai m ing Portu gal urgen t n eed to move tow ards sto r age techn olo g ie s . Two specifi c ph otovolta ic au ctions promote the in tegration of PV techn o l ogy fr om 572 MW in 2018 to 1.6 GW by 2021 and 8.1 G W to 9.9 GW by 2030 [9]. The main s up plie r and distribu tor of electricity in Portu gal, EDP, is goin g to buil d the first P V pl an t, 3.8 M W , cou pled wi t h lead-acid ba t terie s storage, c on ceived fo r self- con s u m pti on, in Ca s tanh eira do Riba tejo and Az am bu j a [10]. It be c o m e s urgen t to w ork fu rthe r in the PV+batte ry marke t, whi c h has la c k of stan dards an d safety rule s, especial ly in th e residen tial sector. The Portu g u ese electrical s y s te m is divide d in t h ree main act i vitie s: gen eration o f ele ctricity , tran smission of electricity through very high and h ig h voltage gr i ds, distri bution of electri city th rough h ig h , m ed ium and low voltage grids an d the supply of electricity to c on sumers. Th e gen eration of ele c tricity is divided i n to ordinary regime, whi ch correspon ds to thermoelect ric plan ts, a nd s pe cial regime, w hich includ es th e gen eration throu g h RE sou rc es , cogen eration and small prod uction an d g en eration rel ated to othe r speci al regi mes [11]. The tran smission 8 is carrie d out under an exclusive public service conce ssion con tract made wi t h the Portu g u ese State and t h e RE N - “ Redes En erg éti c a s Naci onais, SGPS , S.A. – (TSO ). TSO must conn ect al l the en tities to i ts netw ork if th e conn ect i on i s fea s i bl e tech nically and econ omically , a nd i f the applican t s ati s fie s the requi r emen ts for c on nection . Regardin g sup p ly , th ere are two regi mes: 1. Fre e market sup ply to eligibl e consu m ers – El igible consumer s sin ce 4 th Se ptember of 2006 ; the supply is made by free markete rs u sin g freely negoti ated conditi o n s (except s o m e ER SE ’s Regu lation terms); 2. Su pplier of last resort (SLR) – T h is sup plier ha s a supply licen se and m u st en sure specifi c c on sumers w ith regula ted t ari f fs ( ru led ann ual ly by ERSE). Thi s s u pplier must bu y all t h e special regime gene r ati o n at fixed and r egul ated prices de pen d in g of th e gene r ati o n technol og y ( un der fee d - in tariffs sch em e) . Thi s do esn ’ t p r even t the SLR gen erators to sell th eir ene rgy to oth er supplie rs. In a free market regime, the particip ants involved in the production ca n sell the produced ele c tricity and the on es wh o nee d electricity can buy it, wh atever the fin ality. Portu g al a n d Spain ha v e be e n i n tegratin g thei r el ect rici ty markets in to one , th e MIBEL (Iberia n Electrici ty Market). T h ey have a sh ared spot market operato r, th e OM IE, wh ich ope rates s in ce Ju ly 2007 , and a forw ard market ope rato r, the OMIP , since July 200 6. The MIB EL market is ba sed in a group of con tractin g modal iti es whi ch c omp le m en t each othe r . The OMIE spot marke t is regu lated by Spani s h legisl ation and OM IP by Portu gue s e legi s la t i on ( un der the MIBE L I n tern ational Agree m en t), bein g ackn owledged by the legi s la t i on of the ot h er coun t ry . ERSE es tabl ishe s regu la tions, an d of th ese t h e m o s t importan t regu lation s to con s id er are abou t c o mm er c ia l r el ations, tari f f s, q u ality of s er v ice, acces s to netwo r ks and interconn ect i on s a n d netwo r ks ope ratio n . DGEG and independ ent regul atory entitie s are respon sible b y t h e regul ation enforcemen t . The ir r espo nsibili t i es are issu in g, a m en di n g an d with drawin g li censes for ele c tricity gen eration, main taining r e gist ries of ele c tricity su pply , and supe r visin g the securi ty of supply . REN ow n s and maintain s on an exclu s i ve b asis th e e lectricity tran smissio n s y st em i n the Portu g u ese con tinen t . T h e distrib ution system ope rato r of th e high and m ed iu m v ol tage is the EDP – Distri bu tio n SA and ha s the con c es sion of m ost low voltag e muni c i pal distributi o n sy stems . I n Azores the distrib ution op erator is “El etricidad e dos A çore s” (EDA ) , an d in Madeira is “Emp r es a de Ele c tricid ade da M a de ira” (EEM). Su ppl y i s car ried ou t by s everal co m pan ies, the m ai n sup p li er of last resort is EDP Servi ço Uni versal in the co n tinen t , and in Azores and Madei ra are th e same as m en tioned f or di s tribu tion . The ele ctricity produce d by Po rt u g al i s enou g h to meet the con sumption ne eds, b u t for commer c ia l reason s , Portugal imports elec t rici ty f ro m Spain . I n 2017 Portugal imported 3,0 72 GWh. The su r plu s prod uction from Po rtugal is exported to Spa in . T h e electricity gene ration from RE sou rc e s h as c on tribu ted significantly t o an expo r ter bal a n ce, in th e last few years . 9 Natu ral g as and c oa l are the main foss i l sou rc es of ene r gy g en eration in Portu g al , nu clea r doe s n ot exist and the RE production h as i n cr ea s ed in the la st few years. [11]. I n the past th ere were su pport m e c h anisms for RE t echnolo gies based on feed- in - tariff syste m, tax ben efits an d in vestmen t subsid ies. Curren tly the re are no supp ort mech anisms, ex cept for offsho r e w i nd and wave e n erg y ( new techn ologie s ) and small cogen eration. T h e Direct i ve 200 9/28 /EC promote s t h e ene rgy from RE , settin g a t ar g et of 20 % sha re of fin al energy con s u m pti on in 2020 (PNAER 2020), an d 10 % of tran s po rt f u els comin g from rene wable sou r ces by 2020. On 30 November 2016 , Eu ropean Comm is s i on pub lished a propos al for a revised RE Dire c tive to make th e EU a gl oba l leader in RE an d en sure tha t th e targ e t of at lea s t 27 % renew ables in t h e final e n ergy c on s u m pti on in t h e EU by 203 0 is met. Recen tly , Eu ropean U n io n (EU) ha s s ettle d an a t least 32 % sh are of final ene rgy consu mption in 203 0 as glo bal lead er . In 201 5 Portu gal h as made a strate g ic plan , the “Gree n Growth Commitmen t 2030 ” , whi ch quan tifies the target s for 203 0, n am el y the 31 % of RES in g ross fin al energy con s ump tion by 2020 and 40 % by 2030 , beside s man y m ea sures to in c rease s u s tai nability and ener gy efficie ncy. Po rtugal 2013 -2016 energy plan was s et by t h e PN AEE 201 6 docu ment (Plan of Action for Ene r gy Efficiency) and c u rre n tl y is set b y PNAER 202 0 (Nation a l P lan o f Act i on fo r Rene wable Energies 2013- 202 0, app roved by Mini s ters’ Coun cil Resolu t ion No. 20 /2013 of Apri l 10. Portu guese Govern ment ha s c o mm i tted in tern ation ally to redu c e its green h o u s e gases emis sion s to ach ieve c arbo n neu t rali ty b y 205 0. Thi s h as ri s en as a for m of r ep ort a s “ Rotei ro para a Neu t ral idade Carbón ica ” – Carbon Neu trality Road Map. Besid es Port ugal bein g a small c ou n t ry , the ot h er main obstacle t o deve lop renew able ene rgy is the lac k of in terconn ections of t h e Iberia n Peninsul a (Portugal and Spain) and other Eu r op ean Countrie s or t h e North of Afri ca. In Portu g al 2013 (Order from th e Director of En ergy and Geolo gy from 2013 , Dece m be r 26 ) a f ee d- in -tariff scheme was i mplemen ted for micro an d m i n i g en eration , whi c h is c u rren tly sup ers ed ed by the Law on Self-consu m pti o n Decree- Law 153 /2014 [12], in force sin ce th e 20th October of tha t yea r . T h is Decree-La w establ ishes th e legal regimes of the RE self- con s u m pti on, c on siderin g two type s o f un its – th e UPP (S m al l Production U ni t) – wh ich in clud es th e forme r m i cr o an d min i gene ration systems u p to 2 50 kW p, and whe r e th e ele c tricity produ c tion i s exclu sively sol d to the g rid operator , an d th e install ation con s u m pti on is exclu s i vely s u pplied by RESP - and t h e UPAC (Self-C on sumption Produ ction Uni t) – which con s id ers th e sel f -con sumption based on ren e wable technolo g ie s , m a king p oss i bl e to s ell to th e grid the s u rplus ene r gy gen eration . When the gen erated en erg y by UPA C m ee ts the deman d, the produced ene rgy supp lies th e con sumpti on point, when the gene r ate d ene r gy isn ’t e n ough , the RE SP supplie s t h e cons u mption poin t . T h is decree law defines some li c en ses, in stallati o n audits and pay in g regime s of th e electricity sold to the grid. DL 153 /201 4 h as establ ished a distrib u t ion g en eration m ode l, w hich promotes th e d ecen tralization - 10 gen eration of en ergy n ear th e con sumption po in t -, th e gen erati on of en ergy b y RE , th e in crease of the competi tion and the secu rity in supply , the reduction in pea k p ower requi rem en ts, the en cou r agemen t of the PV in d u str y grow in g as we ll as the commu niti es. Regardi ng the two decen t raliz e d el ectr i c en ergy g en eration i n forc e in Portugal , the UPP i s based on a sin g le gen eration techn ology and total in j ection in RE SP . The UPA C, as PV RE , allow s th e c on nection of t he sy stem with t he grid (RES P ), givin g priority of its c on sumption in the installa t i on, st i ll h avin g t h e opp ortunity of sellin g the surplu s , when applicable. The possib ili ty of conn ecting t h e UPA C to t he grid should be studie d, to con c lu de its profi t ab ility and decide whethe r to conn ect it or no t. Becau se this regime is the obj ect of study of thi s w ork, the gen eral regu lation for UPA C will be de t ai led, which establish es: ▪ Conn ect i on pow er bein g less o r e q u al t o 100 % of th e con tracted pow er o f the con s u m er in stallation ; ▪ The gen erated ele c tricity fr o m UPA C sho uld be n ear of the con s u m pti on p oin t i n t h e in stall ation; ▪ If it is c on n ect ed to the ele ctric grid, the instan ta n eous g en eration surplu s c ou ld be sold to SLR; ▪ The con sumer c an in s tal l a n UPAC for each electric i nstall at ion , consu m e the gen erated ene rgy or ex port its s u r plu s t o the grid. The Pro du ct i on Un it (UP) is in stall ed in th e s a m e site o f consu m pti on . T h e consu m er c ou ld ha ve mul t i ple registere d UP s , alth ough ea ch in stall ation i s asso ciated w it h a singl e UP. ▪ If a 1 . 5 kW UPAC is conn ected to the ele c tric grid , th e con sumer is obli g ed to h ave a ded icated ele c tricity m ete rin g equ ipmen t , to accou nt th e in j ected el ectricity . The con tract sh o ul d be con clud ed with a ma ximum term of 10 ye ars, r en ewed for peri ods of 5 yea r s. If t h e UPAC in s talle d powe r is h igher than 1.5 kW an d is c on nected to RESP , the con s u m er h as a mon thly fixed co m pe n s ati on for th e fir s t 10 y ears a f te r re c ei v in g th e certifica te of expl oita t ion (CE). Th e licen sing proces s is made t h rough e l ectron ic r egist er in th e SERU P site (UPs registe r), mana g ed by t he DG EG au thority , s u bmitted b y the propri etary of th e installa t ion , and i ts summ ary is given i n Figure 1. Tabl e 2 presen ts the fee cha r ges of th e DL 15 3/2014 of th e UPP and UPAC re gimes. Figure 1 – Resume of DL 153 /2015 regimes, the UPP and t h e UPA C. Table 2 - Fee charges applicable to UPAC reg i me w i t h and without grid injection, rega rd in g t he ins talled power in kW – DGEG (Portaria 14/2015) rem un er ation *. Insta lled Power Capacity UPA C charges with grid injection UPA C charges without grid injection 11 < 1.5 kW 30 € N/A 1.5 k W – 5.0 kW 100 € 70 € 5 k W – 100 k W 250 € 175 € 100 kW – 2 50 k W 500 € 300 € 250 kW – 1 000 k W 750 € 500 € *These fees are no t cu rren t ly c h arged; its en d or great redu c tio n is exp ect ed in futu re versio ns of the Portu g u ese legisla tion given t h e approved Europ ean U ni on Directive (RED II) 1 , provi din g the exemption of fee s an d cha rges for small s el f -con sumption f aci lities (up to 30 kW) and th e possib i l ity f or commu nities to g en erate, store an d sell t h e s u rp lu s gene ration . Throu g h th e con sulted works, re gardin g thi s topic, [13] pre s en t a te c h no-econo m ic stu d y based in fu t u re p rice s cen ario whi ch considers th e app l i cation of PV and ba ttery en ergy storage in t h e Azores island , with t h ree battery sizing for each battery techn o lo g y , t he li t hiu m- ion an d van adi u m r ed ox flow . The aim is the min imiza t ion of th e c o s t of electricity g en eration , and th e u sed econ omic indi cators are the NPV an d ROI . I n [14] an econ omic an alysi s is made con s id ering lithiu m -ion and lead-aci d battery techn o l ogies with differen t RE sources app lied in India wit h net-meteri ng , ad dressin g th e advan t ages of in tegratin g en ergy s torage in the n etworks, an d con sidering real loa d and resource p rofil es d ata and compon ent prices , con c lu d in g that lithiu m -ion b atterie s are mo r e via ble to ap ply in those case s . In [15] an ana ly sis was made fo r Al m eri a, Spain , a nd Li ndenb erg , Ge rmany, as sessin g i mpa cts of orien tation an d tilt angl es in t h e self- con sum pti on , with stora ge. High er load profil es s ho wed better resu lts in self-con sumption , trade-o ff in self-consu m pti on increase an d cost redu ction of in vestment, in t h e residen t ial sector, an d fr a m ew ork regu lati o n s. Applie d in Austral ia, [16] stud y the PV+battery confi g u ration, usin g NPV, IRR an d LCOE in appl icati o n in Australi a, con c lu d in g th at PV only s y stems are profitabl e, instead of the PV +battery, an d that th e econ omic lo sses of addin g a ba ttery can only balance th e benefi t s th at it bri n gs to th e grid. In [17] a residenti a l an a ly s i s is m ade fo r three USA lo c ati ons, wi t h t h e co n figuration PV +li thiu m -ion b attery , c on cludin g that can compe te w ith grid prices w ith adequate sizin g i n th ose locati o n s , usin g the LCOE indi c ato r. In [18] m on o-cr y stallin e PV s y stems cases and th ree lead -acid battery c a ses are stu died, to be applie d in It al y, withou t subsidi es, c on sidering also lead -acid batteries. Re leva n c e of the disc ou nte d cash-flow s (DCF) i s h igh l i g h ted, j oin t ly with NPV, g ivi ng rele v an ce to the variabl es of PV and electricity, associa t ed costs, profil es and batterie s . In [19] five diffe ren t ca s e s of stora g e w ith n et-m ete rin g are st u died. M a in in dicators are for t h ree location s in Italy, PV an d battery sizin g and instal l ati o n costs. It con clud es tha t econ om i c f ea s ib ility is far, an d losses gen erated by storage are a disa dvan tage. Re gardi ng the Portu guese con text, s o m e relevan t ap proache s h a ve be en made con siderin g curren t legisla t ion , such as th e work o f [20] w hich carr i es a compl ete econ omic an alysis usin g the NPV, LCOE, BCR and I RR as e c on omic in dicators to eval u ate 1 Directive (EU) 2018/20 01 of the Eu r op ean Parlia m en t a n d of the Coun c il of 11 Dece mbe r 201 8 on the pro motion of the u se of en ergy fr o m re n e w able sou rces. 12 fou r confi gurati o n s of PV an d OPzV g el batt erie s (le ad-acid), on a 25 year lifeti m e analy s i s , u s in g PV kits, and con c lu d in g that m ost of the co n figurati ons we r en ’ t econo mical. In [21] econ omic in dicators DPB an d IRR a r e u sed, an d le g isl ation in P ortu g al is clari fied . A n ana ly sis is c on ducted f or differe n t sectors and three differe n t location s ( Li s bo n , Porto and Faro), wi th PV syste ms wi th differen t azi m u t h and til t angles, evalu atin g self-con sumption , remar k in g th e importan ce o f the tariff, load profil e and PV su rplus gene ration. In [22] PV +battery impac t is studi ed, consi derin g tw o stora ge con trol st rategies an d tariff fee cha r ges, sh owin g th at all th e configu rations are pro fitab le w ith a payback bel ow 10 y ears . Fro m the literatu re revision made, vari ous studi es h ave be en con ducted to estimate op ti m al PV +battery con figu r ati ons, based in th e m os t used econ omic i ndicators, for appl ication in th e Portu g u ese conte xt, for th e residen tial case . Re cogn ising the importan t work do ne, t h e presen t w ork stan ds out in th e way o f evalu ating the PV con fig u rations in th r ee differen t loca tion s in Portu g al , for tw o electric en e rgy tariffs , wi t h c u rrent justifie d mar k et p r i ces. Detai led Portu g u ese ele c tricity sector re marks are g iven an d legisl atio n for en ergy micro- gen eration is clarifi ed, to c on tribute to a better in t egrati on of PV-only and PV+battery con f i gurati o n s in t he resid e n tial sector in Port u gal. Presen t w ork i s structu red as fo ll ows . Th e second s ectio n aims to clarify the used metho dol og y for the econo mical an d ene rgeti c as sessmen t. Thi r d se c tio n presen ts the c ase stud y justificati o n a nd explan at ion co n text. Fou rt h s ectio n presen ts the results of thi s w ork . Sectio n five sh o w s the main conclu sions of th is r esea rch. 1.1. UPAC Characterization As ex plaine d, th e li c en sing s c h eme of m o st in stall at ion s in clud es th e pro duction unit regi s try in the SERUP databa se [23], w hich has made avai labl e some da t a abou t t h e con cl ud ed an d rejected RE in stallation s. Regardi ng PV in s tal la tions in t he UPAC and prior commu nication (MCP ) regi mes, the data m ade avai la ble is fro m Ma r ch to Dece m ber of 201 5, Janu a ry to Dece m ber of 2016 and fr o m J an u ar y t o July of 2017 . T h e correspon den t data comp r ise s 184 3 UPAC in s tal lation s with 95,995 MW and 12363 M CP in stallati o n s wit h 10,84 5 kW, comprisi ng a to tal of 106.8 MW of i nstall ed pow er in Po rtugal, a n d can b e observed i n Fig u re 2 an d Figure 3. 13 Figure 2 - Insta ll ed power distribution of the Portuguese UPAC registered installations from t h e available data of th e SERUP database [23], wi th 100 b ins . Figure 3 - Probability de nsi t y o f t h e logarith m MCP i ns ta lled power (W), made availabl e from the SERUP database [23] , with 150 bins. A domestic costu m er with a suitable sized p h otovoltaic s y st e m in t he UPAC r egi me produ ces ene rgy and can use it to exclu sively supply his load s , ge neral ly called e xclu sive s el f - con s u m pti on. Since t h e produ ced en ergy by t h e PV system i s vari abl e throu g h the day , season s and yea r s, u s u ally for the hou se ho ld c on sumption the ele c tricity gene r ate d by the pho tovolta ic sy stem h as a s u r plu s or isn ’t en ough t o total ly satisfy the do mestic l oads. In the 14 first case, the energy surplu s can be cu rtail ed, i n j ected i nto the grid, or st o red i n batteri es for late r c on sumptio n. If th e g en erated ele ctricity isn ’t enough to total ly su pply the loads, t h e resul ta n t con s u m ption n eeds must be supp l i ed from t h e electric grid or from othe r ene rgy sou r ce. 2. Methodology A c o m pl ete tech nolo g y or project inve stmen t assess men t is an annu a l investmen t an alysi s, con s id ering all the r el evant costs, revenu es, taxes and r ates . The ob jective of making an econ omic an alysi s is t h e pro vision of rel evant information to make a j u dge men t or a d e cision [24]. Presen t work based th e analy sis in a 25 y ears lifetime. The econ omic f i gures us ed in th is work are th e Net Presen t Valu e ( NPV ) , th e T ota l Life Cycle Cost (T LCC ), t h e Le v el i ze d Cost of En ergy (L COE ) , the Simple Payback P e r io d (SPB), th e In tern al R ate of Re t u rn (IRR) and th e B enefit- to -Co st Ratio (B/C ra tio). Al th ough t h e i m portan ce of th e e conomic asses sm en t in t h e decision making, u sing ene r gy in dicators is also cru cial . Despite these last paramete rs b ein g used in s malle r t i me perio ds ( for exa m pl e in the analy s is of a singl e e ne rgy strate g y ) , we decided to calcula te some en ergy parameters for one yea r , for on e y ear of gen eration and consumptio n. Th e evalu at ed key pe rforman c e indi cators, o n ly physically tan g ibl e a fter th e pay back time, are th e self-con sumpti on rati o, th e self-supply rati o, th e battery use, an d la stly a grid in depen den c y rate based on t h e achie ved savin gs . 2.1. Measures The NP V exa mines th e ca s h flow s associ ate d w ith a pro j ect, over the durati o n of th e pr oject. It is th e v al ue in t he ba s e y ear (usua l ly t he pre sen t ), an d can b e ex pressed a s foll ows in Eq . (1), (1) wh ere is th e net cash flow , in y e ar ; is the pe riod of the pro j ect; is the annu al d i scoun t rate. T h is p arameter is g en erally recommend ed t o evalu ate the cha racteristics an d decision s of the investmen t, and s oci al cost s. T h e NPV valu e can have some v a riation s , as t h e calcu lus in clud es or n ot t h e after-t ax es valu es a nd being in c u rr en t or c on stant euros. If the NPV value is posi tive th e proje ct is con sidered econ om ical and can be accepted; i n con trast, if th e NPV valu e is n egative, th e proje ct isn ’t econ omical, mean in g th at retu rns are w orth less th an t h e initi a l i n vestm en t, bein g an indi cator of a no -good decisio n . I n t h eory, if the NPV valu e is null, th e investor s h ould be indi fferen t wh ether to acc ep t th e pro j ect or no t. The appli c ab i lity of thi s 15 in dicator s h ould be carefully a n a ly s ed , since t h ese c on sideration s aren ’ t val id fo r all app licati ons. The T LC C eval uate s d ifferen ces in c osts an d t he timin g o f c o sts, betwe e n al ter nati v e project s. These cost s are referred to the as se t a c qu isition , c ost s in its li fe c y cle or in the peri od of in terest to t h e in vest or . Only the relevan t costs a r e c on sidered , an d are discoun t ed to a base y ear, recurrin g to the presen t valu e analy sis. TLCC has three v a riation s, con s id ering n o taxes, after tax dedu ctions or before-tax reven ue requi r ed . In thi s wo r k, th e more s u itable form is the n o taxes formul a, adequ ate to r e siden t ial / n on -profi t/governmen t app licati on, ex press ed in Eq. (2), (2) wh ere is th e in it ia l in v est ment, an d is the prese n t valu e of all O& M c osts, a s can be seen in Eq. ( 3 ). (3) The LCOE is t h e cost of ea ch uni t of ene rgy produ ced or sa ved by the sy stem, o v er t h e peri od of the a n a ly s i s, whi c h will equal t h e TLCC, discoun t ed back to th e base yea r . In othe r w ords, it c ou ld be exp lained as the cost o f one uni t of en erg y , whi c h is kept constant in the ana ly sis perio d, t h at provide the same n et presen t revenu e as the NPV co s t of th e syste m. The leveli zed cost of ene rgy is very useful to compa r e di ff ere n t scales of oper ation, in vestmen t s and /or operati n g perio ds. There a r e many ways of c al c u lati n g thi s para meter and the Eq. (4) w ill be used , (4) wh ere i s th e ene r gy outpu t or saved in y ear . In the case of PV+b attery con f i g u rations, th e analysi s w as carried ou t consi derin g the val ue as th e PV gene r ation (energy o u tput) plu s th e e n ergy sen t t o th e storage u nit and effe c tivel y used (save d), i n the yea r . The In ternal Rate of Re turn (IRR) the rate a t wh ich the NPV of the future cash flow is set to zero . W he n applie d, t h is rate brin gs the expen s es v al ues to the pre s en t, an d m a ke them equ al t o the return of th e investmen t v al ues. IRR obtai n e d valu e is gene rally compared with a “hurdle r ate”. It all o w s the comparison between m an y d iffe ren t investmen t activiti es. T h e rate is given by Eq. (5). 16 (5) The S PB is a fast an d simple wa y to co m pa r e i nvestmen ts . It is de fin ed as th e ti m e ( nu mber of yea r s) requ ired for the net revenu es asso c ia t ed wi t h an invest men t of a certai n project to be reco vered, w it h o u t acc ou ntin g the t i me value of money . I t cou ld be de scribe d as E q . (6) exp licit. (6) W h ere are the n ondiscoun ted incremen tal invest men t costs (in c lu d in g in crem en tal finan ce c h arges), an d is th e sum value of th e annual c ash f l ow s n et annu al costs. One of the main disadvan tages of u sing th is para meter is th e fact tha t i t i gno r es the value of the money over t h e peri od , wh ich implie s that th e in v estor doesn ’t h ave op portu nity cost. It also ig n ores th e return s after the payback year. On th e ot h er way, it is simpl e of c al c u late, imple m en t and explain . The Benefi t- to -Cost Ratio ( B /C ratio) ratio of the SUM of all discoun t ed bene f i ts a ccr u ed from an investmen t to the sum of dl associate d di s coun ted costs. It is u s ed to discover a t which leve l the benefits of a p r o j ect ex c eed the co sts. Th is i ndicato r is gen erally used f rom a soci al perspec t i ve. It can be de scribe d in Eq. (7) . (7) W h ere is t h e presen t valu e of all pos i tive cash flow s, and t he is the prese n t valu e of al l ne g ati ve cash fl ow s . En ergy indicators are st u died for one compl ete yea r . The self-consu m pti o n r ate (SCR) is a w ay of q u a n tif yin g how m u c h ene r gy is gen erated and self-con s u m ed locally. The S CR is gen erally given t h rou g h the formu la given by Eq. (8), (8) wh ere , is the energy g en erated t h ro u gh t h e PV s y st e m whi ch is self-con s u m ed , and is t h e total gene rated ene r gy fr om t h e PV sy s tem. The genera ted s ol ar pho tovolta ic ene r gy whi c h is consu m ed is obtain ed t h ro u gh t h e s u btr acti on of the “curtai lmen t” l osses o r in j ected i nto the grid. The sel f -su pply rate (SSR ) i s an en ergetic ind icator w h ic h quan tifies the degre e o f au tonomy from th e gr i d, an d is given by the follo wing formu la, g i ven by Eq. (9), 17 (9) wh ere , is the en ergy l oad profil e. The batte ry use (BU) can be describ ed as a w a y of qua ntifyin g th e usage of the battery , compari ng th e e n ergy cha r ged to the battery , and the e n ergy load. Thi s indicator can be given b y t h e followin g exp r es sion , presen te d by Eq. ( 10 ), ( 10 ) wh ere, is the en ergy sen t to the battery , in kW h . The saved money rate (SMR ) q u a n tifies the degree of au ton omy f rom the gr id in € . This in dicator on ly makes sen se to be calcul ated after th e pay back ti m e brea k-even is a chi e ved. The en erg y that was satisfied by th e grid be f ore t h e PV in stalla tion a nd now isn’t – th r ou g h self-con sumption , chargin g /disch arging th e battery and injection into the grid – is q u antified as mon ey saved, as th e Eq. ( 11 ) sh ows, ( 11 ) wh ere , in € , is the mon e y paye d wit h the studie d confi g u ration, comparin g wi t h the , in € , whi c h is the c urren t ele c tricity bill (only gr id consu m pti on), for ea ch location an d ele c tricity t ari f f, for on e y ear. 3. Case Study D e finition Thi s w ork ha s th e ai m of co m pari ng differen t photovol taic confi g u rations, eval uating it s econ omic f ea sibi lity in a variety of option s . Th e ana l y s is is m ade f or the Portu gu ese reside n t ial figu re c h aracterized throu gh the profile c on sumption BTN C an d for a con tracted powe r of 3.4 5 kVA. Fou r PV pow er in stallation s are stud ie d, na m ely 0.50 kWp, 0.75 kW p , 1.50 k W p an d 3.45 k Wp, for o ff-grid or g rid- c on nected con nection, for th ree diffe r en t Portu g u ese lo cation s – Évora, Porto an d in one island of the Azores archip elago. T h e two cho s en con t in e n ta l sites repre s en t a pprox im atel y th e P ortu g uese region s with r egard th e sola r resou rc e poten t i al a n d the Azores as an extreme Po rtugu ese lo c ati on , 1600 km W e st of P ortu g al, in t h e Atlan tic Ocean . The c h osen power siz i n g f or the studi ed cases w as con side red the most rele v an t for presen t work regardi n g the cu r ren t legisl ation in Portu gal , th e D L 1 53/2 014. For e ach o f these PV instal lations si zes, tw o ele c tri c ity tariffs were add ressed - th e flat tariff an d the bi-hou r ly tariff – con siderin g the di ffe ren t tari f fs in th e con t in e n t and Azores islan d s. In the s en se of the residen tial sect or , three differen t stora ge capaci ties were resea rc h ed, n am ely 3.3 kWh , 6.6 kWh an d 9.9 k W h for each of t h e stu died PV siz es. In th e n ext lines, a more de tail ed ex pla n ati on is given . 18 3.1. Legislati on – detailed case For th e c ase i n wh ich the g en erated energy by the UPA C is no t f u lly self-c on sumed an d is in ject ed in to the public g rid (RESP), the price of the ele c tricity sold to th e RESP is g i ven by 90 % of th e average I be rian electricity mar k et closin g price, an d can be expressed throu g h Eq. (12) , ( 12 ) wh ere is th e s ol d ene r gy price in €, in mon th ; th e i s th e suppli ed ene r gy in kW h, in m on th ; and the i s the average Iberian electricity gross m a rket closin g price (OMIE ) for Portu g al in €/kW h , in m on th . T h e avera ge month ly wholesale electricity prices for th e y ear of 201 8 are presen ted next, in Figure 4, data m ad e a v ai lable by OMIE [25]. Figure 4 - A v e rage monthly wholes ale electricity prices of the y ea r of 2018 for Portugal. For th e stu died c ase s wh ere th e electricity is i njected i n RE SP, th e a verage m on thly ele c tricity prices sh o w ed in Figure 4 a re u s ed . 19 3.2. Domestic Consumption Profile The econo m ic an aly s is was perfo rmed u sing the a v erage con sumptio n profi les of nor mal lo w voltage (B T N ) pro v id ed by EDP Distribui ç ão [26]. Th e com pa ny colle cted con sumpti on data from each fifteen m inu tes an d organize d it by sector of activity (A, B an d C), wh ic h made possib le th e est i mation of the electric con s u m pti on for the y ear of 2019, based in the previo u s y e ar’s Por tu gue s e continen t c on sumption . Residen t i al s ector - BTN C (con tracted pow er less th an or equ al to 13.8 kVA and annu al con sumpti on less th an or e q u al to 714 0 kW h ) - , da ta u s ed in t h is s tu d y is sh own below in Figure 5. Figure 5 – E s timated electric domestic consu m ptio n p rofile of BTN C for 2019, made ava i l able by EDP D is tr ibui ç ão [26]. 3.3. Solar Photovoltaic Irradiati on Profi le Three loca tion s were c ho s en to study the applicati o n of PV -o n ly an d PV+battery con f i gurati o n s : Évora , Por t o and Azores islan d, an d i ts geograph y can be seen in the map of Portu g al in Fi gure 6. Évora is t h e capi tal o f Alente jo, a re gion in t he cen t re-sou th o f Port u g al , a city c h aracterized by a n average ann ual su m valu e of g l oba l horizon tal irradiation (GHI) of 1846 kWh/ [27], d efin ed as on e of th e b est l ocatio n s re gardi ng sol ar ir radi ation availa b ility in t h e South of Europe. Porto is th e secon d biggest city of th e Port u guese con ti nen t a nd is descri bed as t h e c i ty that w as in th e origin of Portu gal . As a coastal regio n in t he n ort h of Portu g al , ha s interest of stud y t h r ou g h its average ann u a l GHI n ear of 1 706 kW h / [27]. Azo res is a Portu g u ese archi p el ago w it h nin e i s l and s , an d althou g h bein g th e region o f t h e se th ree with the lowest annu al GHI, nea r 1 307 kW h/ [27], it i s a region wi t h lack o f r egi stered 20 reside n t ial sola r PV i n s tal la tions as can be observed in T ab le 3, an d is relevan t to eval u ate a case w ith d i fferen t electrici ty tariffs from th e co n ti nen t. For each of th e s ite s, a simul ation in SISIFO [28] on line simu lator was carri ed out, consi derin g sou th orienta tion and optimu m in clinati o n for each region , a n d t h e h ourly i rradia tion for e ach month of the y ear w as extracted. The a verage val ues w ere considere d and used in t he pre sen t simu la tion. Figure 6 - Solar g l ob al hori zo n ta l irradiation (GHI) map of Portugal territory [29] Table 3 - Electricity generation balance in the Azores, from January to De cember 2018 [30]. Sourc e A zores Contine nt Fossil 61 % 47 % Geothermal 26 % 0 % Hydroelectric 3 % 24 % Wind 8 % 22.5 % RSU 2 % 0 % Bio 0 % 5 % Solar 0 % 1.5 % 3.4. Electricit y residential tariffs The el ect rici ty pr ice in Portu gal is structur ed with three tariff regimes, n amely t h e flat, bi- h o u r ly and tri-hou r ly tari ffs. Fla t tariff mean s the loa d consumpti on is equ a l for every h o u r of th e day, indicatin g tha t the tariff is in dependent f ro m t h e peri od of c on sumption . Bi-hou r ly and t ri -h ourly tariffs distin g ui s h es , r e spectivel y, two a n d thre e peri ods of c on sumptio n, by attribu ting two or three e le c tric t a riffs, for off-peak an d pea k hou rs. For the bi-hou r ly and tr i- 21 h o u r ly tariffs, two main varia n t s e xi st, the da ily c y cles an d th e w eekly c y cles, an d th ese di ff er in the time of the year. T h e bi-h ourly tariff con siders th e w e ekly cycl e tariff, wh ic h has variati ons in summ e r an d win ter legal times, and t he daily c y c l e tariff is constan t th rou g h all th e y ear. Th e t ri-h o u rl y c on siders th e weekly c y cle, with variation s on t h e summer an d win ter legal times, so a s th e daily c y cle. In this w or k, w e ch oose to w ork wi t h dai ly cy cles in t he low voltage netw ork. For th e locatio ns of Évora and Porto, lo cated in t h e Portu gue s e con ti nen t, th e u sed tariff is from EDP Co mercial c o mpany [31] and f or th e Azo res island is u sed the EDA tari ff [32] , [33] . Figu re 7 presen ts the da ily c ycl es u sed in thi s w ork . Figure 7 - Peak a n d off -pe ak perio ds of the daily cycles, indiffere n t ly for su mmer and winter legal times [34]. Regardi ng t h e stored ene r gy , it i s valua t ed at the v al id price on t h e momen t of i ts u se (us u a lly in a late r perio d of the day), depen di n g on the c on sumer con t ract an d on t h e time at whi c h th e con s umptio n occurs. Gene rally , for bi and tr i-hou r ly ta riffs th e pea k period s are associ ated with highe r tariffs, conve rsely of the off -peak one s . I n th e st o rage sizin g , spe cial care m u s t be given to the nu m ber of cha rge and disch arg e c y c l es over the li f eti m e of th e battery , and the difference of t h e outpu t of t h e chos en tariff. Con c ernin g the tariffs used in th is work , T ab le 4 p r esen ts the ele c tricity tariffs for the c on tinen t an d i sl a n d u sed i n th is work. It shou ld be no t iced t h at sin ce th e work addresses t h e da i ly cycl es, wh en workin g with a bi - h o u r ly tariff, th e legal time f ro m summe r to win t er or vice -ver sa don ’t h ave influen c e in t h e resul ts , sin ce it is off-pea k ti m e i n the time-shi f t h o u r. Table 4 - Flat and bi-hourly tariffs of EDP Comercial o f the P ortu g uese continen t a n d f rom EDA in the Azor es, for the year of 2019 . Tariff Flat Bi -hourl y Location Évora/P orto Az ore s Évora/P orto Az ore s Regim e Normal Normal Peak Off -peak Peak Off -peak 22 Contract ed Pow er (€/day) 0.2187 0.1648 0.2282 0.2282 0.1694 0.1694 Energy ( € /k Wh) 0.1493 0.1607 0.1867 0.1098 0.1908 0.1000 As a s i m pl ification a n d in order t o be able to as sign a val u e t o the el ectr ici t y i n off-grid syste m s, it was con s i dered for t h ese in stallati o n s the same ene rgy cost an d tariff structu r e as tho s e c on n ect ed to th e gr i d. 3.5. Energy Stor age and In verter s The stu died cases c on sisted o f three lith iu m- i on battery capacitie s, n am el y B1 w ith 3. 0 kW/3 .3 kW h , B2 w ith 3.0 kW/ 6.6 kWh a nd B3 wi th 3 .0 kW/ 9.9 k W h. Re siden t i al ene rgy storage market h as in c rea sed in recen t y ears , g iven place for n e w , more e fficien tly and mo re en vironmen tally friendly technolo g ie s to arise. An exa mple of th is a r e the lithium-i on batteri es, whi c h ade qua t ely fit in thi s application an d ha ve g ood cy c le effi cien cy. In t h is wo r k, w e c ho s e to w ork with mark et avai la ble li t hiu m -ion batteries, m ai nly due t o the tr ad e-o ff of efficie ncy, ene rgy den sity and cu rr en t marke t price. Regardi ng the battery specifi c ati on s , special atte n tion must be g iven to its capacity li f etime degrada t i on , dep t h of discha r ge and lifetime. T o calcu late the e ne r gy tha t is stored in the battery st ora ge syste m an d is th en e ffectively u sed by the prosu m er, s o m e a spects must b e con s id ered, as t h e powe r electroni cs e fficie ncy , th e battery efficien c y (ch arge a nd disch a rge) con s id ering the yearly battery degrada tion , an d f in ally the dep t h of dis cha r ge. T h e c h osen battery characteris t i cs give n by th e manufactu rer are s h own in Tabl e 5. For the smalle s t PV confi gurati o n s, the batteries capaci ties are un fit, comparin g wi t h th e biggest PV pow er in stallati o n s . Althou g h t h is con s ide r ati on, the sm al lest PV pow er in stall ations with s torage are s een no t as a foll owing c a se, bu t only as c o m pa r iso n case s with t h e biggest PV in st al lation on es. Table 5 - Lithiu m -ion battery characterization data, given by the manufacturer [35]. Battery Identification B1 (3.0 k W/ 3.3 k W h) Model METERBOOST- 48 -LTO6-3.3 Nominal Voltage (V) 48.0 Maximum/minim u m Voltage (V) 32.0-58.4 Nominal Capacity (Ah) 63 Nominal Capacity (kWh) 3.3 Nominal Power (k W ) 3.0 W e ight (Kg) 17 Length x W id t h x Height (mm) 430x360x76 Useful lif e- c y c le (y ears ) >17 23 Mi cr o-in v erter s were cho sen in some cases, on e with 0.50 kW of nomin al power: the APS YC 500 m icro - in verter; an d one with 0.25 kW of no min al powe r: the APS 250. The hy brid in verter is th e Sola x SK-SU30 00E X-HYBRI D SERIES G2. 3.6. Proposed Scenarios and Economic Consi derations The presen t w ork h as stud ied fou r main s ce narios , s u mm ari zed in T ab le 6. All th e di f feren t con f i gurati o n s are si mul ated for each scen ario. Table 6 - Summary o f the proposed scenarios. Case Photovoltaic System Grid Consumption Storage Surplus Electricity ( P riority) Off -grid Grid- connected Yes No Yes No Battery Grid Waste I x x x x II x x x x III x x x x IV x x x x ▪ Case I – The domestic p rosumer has a ph otovol t ai c sy stem used t o perform ex clu sive self-con sumption . T h e surplu s of t h e solar pho t ovol taic gene r ate d electricity is w asted. For th e period s in which t h e pho t ovol taic gene r ati o n is no t en o u g h to su pply th e c on sumer’s load diagra m , b ein g off-gri d th e c on s u m er w ill be wi t h out power sup ply (at n ight) an d/or sh oul d do a carefu l load man agem en t . ▪ Case II – In th is scena r io , t h e prosu m er’s solar ph otovol t ai c syste m is grid -con nected, and self-con sumpti on is u s ed . The su r plu s of the gen erated el ect rici ty is sold t o t h e grid. In the period s wh en t h e g en eration isn’t en o u g h to su pply t h e loads, t h e prosu m er con sumes e le ctricity from the grid. ▪ Case III – The domestic c on sumer has a ph otovoltaic syste m wh ich performs self- con s u m pti on. The e lectricity surp lu s is stored in the battery, the storage use is a prio rity. If th e battery reache s its maxi m u m s tate of cha rge, th e s u rplus el ectricity is curtai led . For period s withou t s ol ar radia tion and with a depl eted battery , bein g an off-grid s y st e m , en erg y /power con st rai n t s are like th e case I. ▪ Case IV – T h e prosumer has a grid- co nnected pho t ovol ta i c syste m and s el f - con s u m pti on is m ad e. T h e s u rplus electricity is sent to the battery storage, wh ich h as prio rity, rega r di ng the in ject i on in the gr id . If the ba t tery achieves th e maxi mum state of cha r ge, the su r plu s electr i city is sold to th e grid. In periods wh ere the g en eration isn ’t en ough to supply th e lo ads, the prosume r consu m es el ectricity f ro m th e grid. The fou r prop osed ca ses en erg y flows are su m mariz ed in Fi g u re 8. 24 Figure 8 - E n e rgy flo ws of th e proposed ca s e scenarios . Cases I II an d IV s i m u late t he use of a PV+b attery setu p. A simpl e demon str ati on of the sol ar pho tovolta ic en ergy f l ows in these scena rios for 1.50 kW PV powe r in st al lation in Évora is given i n Fi g ure 9 . (a) (b) Figure 9 – E x ample of the Évora 1.50 kW PV in stalled power wi t h the (a) Case III, energy stored with a 3.3 kW h ba ttery , and (b) Case IV, e n ergy stored to the 3.3 kW h b attery a nd/or exchanged with the grid. For each con figurati o n , an in vest men t asse ssmen t w as carrie d o ut. Ca s es II an d I V, the g rid- conn ected photo v ol t ai c con figurati ons, consid er th e con tr acted pow er cost in the econ om ic asses sm en t, with the aim of m a k i n g a real compariso n amon g th e st u died cases. The asses sm en t is m ad e con sidering gen eral aspects to all t he cases, wh ich are given in Table 7. Th e com po n e n t prices are given in Table 8 . Table 7 - General co nsi de rations of the cas e study. Variable Value Photovolt ai c unit Power (Wp) 250 25 Photovolt ai c Module (€/Wp) 0.35 Power of t he Module in year 25 (%) 80 Battery Degradation Capacity (%/year) 2.0 Discount Rate (%) 3.0 Inflat ion Rate (%) 2.5 Table 8 - Components pri ce s and considered rates, for th e year of 201 9. Case I Case II Case III Case IV Identification PV1 PV2 PV3 PV4 PV1 PV2 PV3 PV4 PV1 PV2 PV3 PV4 PV1 PV2 PV3 PV4 Structure s (€) 50 50 200 300 50 50 200 300 50 50 200 300 50 50 200 300 Micro-In verter or Inverter (€) 199 324 597 1393 199 324 597 1393 1833 1833 1833 1833 1833 1833 1833 1833 Cable s and Others (€) 50 50 100 100 50 50 100 100 50 50 100 100 50 50 100 100 Installation (€) 100 150 200 3 00 100 150 200 3 00 100 150 200 3 00 100 150 200 3 00 Battery (€) N/A N/A B1 – 1625€; B2 – 4060 €; B3 – 5370 €. B1 – 1625€; B2 – 4060 €; B3 – 5370 €. Obligations fees by DL -153/2014 (€) 0 0 0 0 30 30 30 100 0 0 0 0 30 30 30 170 PV1 to PV4 is the sele c ted in s tal led PV pow er (PV1 = 0.50 k W; PV2 = 0.7 5 k W ; PV 3 = 1.50 kW an d PV4 = 3.45 kW) and the B1 to B3 r ep resen t the several battery capaciti es. All the compon ent prices were ob t ain ed from tw o Portugu ese su ppliers an d r efl ect t h e current rea l Portu g u ese market pri ces [36 , 37], ve r i fied w ith th e initial market pri ce su rvey. Pote n t ial discou n t s asso ciated wi t h t he purcha s e of m u ltiple equipmen t, e .g. severa l microin verters, w ere no t co n sidered due t o t he hi g h sub ject i vity ass oci ated with t he se commercia l discoun ts . An average v al ue for in stallation c ost wa s also consi dered, wh ich m ay have a substa ntial variab ili ty associated wi t h the selected instal ler bu t w i ll tend to be more ho mogen eous (and possibly lower) wi th t h e growth a n d increased c o m pe t iti v en ess of th e market. T h e pho tovolta ic m od u le prices evolved rapidly in t he l ast y ears, whi c h justifie s the u se of PV spot marke t price s, wi th s mall approxi mation s reflectin g th e real costs in Portu gal [38] . A rema r k must be made re gardin g th e bidi r ection al wattmeter. EDP Di stribu ição is curren tly replacin g th e previou s anal og ue w att me t er s an d d epl o yin g n ew digital version s w ith bidirectio nal meteri n g capabi l i ties, i n a ll Portu g u ese t errit ory, ensu r in g a 8 0 % repl acemen t rate un ti l 2020 (Eu r op ean Union d irective fro m 2 009). In this way , presen t analy s i s ign ored the b idi rectiona l coun ter ac q u isition costs, ob li g ed b y DL 153/201 4 wh e ne ver it s ap pl icable . 4. Re sult s The econ omic an d energetic an alysis were m ade using the in teractive compu tation al softwa re MA T LAB . In the followin g t ab les, t h e resul t s are s h own, with t h e three/fou r best resul ts hi g hli g h ted wi t h a b lu e col o u red c el l. Regardin g the s e figures, the initi al letter “F” correspo n ds to th e f l at tari ff, an d the le t ter “B” c or r e spon ds to the bi - hou r ly tariff. In t h e 26 pay back presenta t ion t ab les , “nan ” v alu es c or respon d to payback pe riod s bigger th an 25 y e ars (th e con s id ered project li fetime) an d are inte rpreted as un in t eresti n g resul ts f or econ omic analy s i s. (A) Econo mic Ana lysis Figure 10 – R esults o f t h e NPV econ om ic indicator for the 8th st u d ied configura tions, f or th e location of Évora. Figure 11 – Eco nomi c indicator NPV for th e location of Porto, for all the st u d ied configurations. 27 Figure 12 – Locati on of Azore s NP V results, for eac h of the studi ed config u rat ions. Figure 13 – R esults o f t h e PBT, f or the location of Évora , for the configurations studi ed. Figure 14 – R esults o f t h e PBT f or all the configurati ons studied, for the location of Porto. Figure 15 – Obtained r esults of t h e PBT economic indi cator for all the s t udied con f igu r ations, for the region of Azores. 28 Figure 16 – R esults o f t h e LCOE f or the location of Évor a, f or th e s tud i ed c onfigurations. Figure 17 - Results o f the LCOE for the location of Porto , for the studie d configurations. Figure 18 - Obtained LCOE results for the location of Azores , for all the studi ed configuratio ns . (B) Energy An a ly s is The foll owin g tables present the energy analy s i s m ad e for the three c h osen locati ons, for each of the scena r io s . For the SMR ( Sa v ed Money Rate) indicato r the used compariso n case 29 w as th e grid-conn ected (wi thout battery or PV sy st e m) , for al l the four con sidered con f i gurati o n s (I to IV). Table 9 - Energetic analysis for the Évora site . Insta lled PV Power (kW) / Parameters SCR (Self- consu m ption Ratio) SSR (Self- supply Ratio BU (Batte ry Use) SMR (Saved Money Rate) Case I and Case II Case I Case II Tariff independen t Flat Bi -hou rl y Flat Bi -hou rl y 0.50 0.7601 0.3230 N/A 0.2439 0.2529 0.2713 0.2787 0.75 0.5797 0.3695 N/A 0.2790 0.2831 0.3506 0.3510 1.50 0.3238 0.4128 N/A 0.3117 0.3126 0.5413 0.5309 3.45 0.1450 0.4253 N/A 0.3211 0.3213 0.9884 0.9559 Insta lled PV Power (kW) / Parameters SCR (Self- consu m ption Ratio) SSR (Self- supply Ratio BU (Batte ry Use) Saved Mon ey Rate (SMR) (€) Flat Bi -hou rl y Flat Bi -hou rl y Case III, Case IV Case III Case III, Case IV Case III Case IV 0.50 B1 0.7601 0.3230 0.0697 0.2965 0.2814 0.2965 0.2814 0.50 B2 0.7601 0.3230 0.0697 0.2965 0.2814 0.2965 0.2814 0.50 B3 0.7601 0.3230 0.0697 0.2965 0.2814 0.2965 0.2814 0.75 B1 0.5797 0.3695 0.1833 0.4173 0.3961 0.4173 0.3961 0.75 B2 0.5797 0.3695 0.1833 0.4173 0.3961 0.4173 0.3961 0.75 B3 0.5797 0.3695 0.1833 0.4173 0.3961 0.4173 0.3961 1.50 B1 0.3238 0.4128 0.4388 0.6429 0.6101 0.7021 0.6662 1.50 B2 0.3238 0.4128 0.5760 0.7465 0.7084 0.7465 0.7084 1.50 B3 0.3238 0.4128 0.5760 0.7465 0.7084 0.7465 0.7084 3.45 B1 0.1450 0.4253 0.5341 0.7243 0.6874 1.1420 1.0837 3.45 B2 0.1450 0.4253 0.5747 0.7550 0.7164 1.0522 0.9985 3.45 B3 0.1450 0.4253 0.5747 0.7550 0.7164 0.9035 0.8574 Table 10 - E n e rgeti c a n a lysis for th e location of Porto. Insta lled PV Power (kW) / Parameters SCR (Self- consu m ption Ratio) SSR (Self- supply Ratio BU (Batte ry Use) SMR (Saved Money Rate) Case I and Case II Case I Case II Tariff independen t Flat Bi -hou rl y Flat Bi -hou rl y 0.50 0.7901 0.2964 N/A 0.2238 0.2356 0.2448 0.2556 0.75 0.6070 0.3416 N/A 0.2579 0.2659 0.3165 0.3219 1.50 0.3489 0.3927 N/A 0.2965 0.2998 0.4906 0.4853 3.45 0.1569 0.4061 N/A 0.3066 0.3082 0.8852 0.8606 Insta lled PV Power (kW) / Parameters SCR (Self- consu m ption Ratio) SSR (Self- supply Ratio BU (Batte ry Use) Saved Mon ey Rate (SMR) Flat Bi -hou rl y Flat Bi -hou rl y Case III, Case IV Case III Case III, Case IV Case III Case IV 0.50 B1 0.7901 0.2964 0.0538 0.2644 0.2509 0.2644 0.2509 0.50 B2 0.7901 0.2964 0.0538 0.2644 0.2509 0.2644 0.2509 0.50 B3 0.7901 0.2964 0.0538 0.2644 0.2509 0.2644 0.2509 0.75 B1 0.6070 0.3416 0.1512 0.3720 0.3531 0.3720 0.3531 0.75 B2 0.6070 0.3416 0.1512 0.3720 0.3531 0.3720 0.3531 0.75 B3 0.6070 0.3416 0.1512 0.3720 0.3531 0.3720 0.3531 1.50 B1 0.3489 0.3927 0.3889 0.5901 0.5600 0.6338 0.6015 1.50 B2 0.3489 0.3927 0.5011 0.6748 0.6404 0.6748 0.6404 1.50 B3 0.3489 0.3927 0.5011 0.6748 0.6404 0.6748 0.6404 3.45 B1 0.1569 0.4061 0.5249 0.7028 0.6670 1.0599 1.0059 3.45 B2 0.1569 0.4061 0.5939 0.7550 0.7164 0.9545 0.9058 3.45 B3 0.1569 0.4061 0.5939 0.7550 0.7164 0.8825 0.8375 30 Table 11 - Energetic a n a lysis for th e location of Azores. Insta lled PV Power (kW) / Parameters SCR (Self- consu m ption Ratio) SSR (Self- supply Ratio BU (Batte ry Use) SMR (Saved Money Rate) Case I and Case II Case I Case II Tariff independent Flat Bi -hou rl y Flat Bi -hou rl y 0.50 0.8664 0.2829 N/A 0.2314 0.2449 0.2432 0.2568 0.75 0.6748 0.3305 N/A 0.2703 0.2789 0.3126 0.3223 1.50 0.3958 0.3877 N/A 0.3171 0.3177 0.4731 0.4789 3.45 0.1841 0.4147 N/A 0.3392 0.3368 0.8229 0.8375 Insta lled PV Power (kW) / Parameters SCR (Self- consu m ption Ratio) SSR (Self- supply Ratio BU (Batte ry Use) Saved Mon ey Rate (SMR) (€) Flat Bi -hou rl y Flat Bi -hou rl y Case III, Case IV Case III Case III, Case IV Case III Case IV 0.50 B1 0.8664 0.2829 0.0298 0.2558 0.2648 0.2558 0.2648 0.50 B2 0.8664 0.2829 0.0298 0.2558 0.2648 0.2558 0.2648 0.50 B3 0.8664 0.2829 0.0298 0.2558 0.2648 0.2558 0.2648 0.75 B1 0.6748 0.3305 0.1089 0.3594 0.3722 0.3594 0.3722 0.75 B2 0.6748 0.3305 0.1089 0.3594 0.3722 0.3594 0.3722 0.75 B3 0.6748 0.3305 0.1089 0.3594 0.3722 0.3594 0.3722 1.50 B1 0.3958 0.3877 0.3702 0.6199 0.6419 0.6339 0.6564 1.50 B2 0.3958 0.3877 0.4048 0.6482 0.6712 0.6482 0.6712 1.50 B3 0.3958 0.3877 0.4048 0.6482 0.6712 0.6482 0.6712 3.45 B1 0.1841 0.4147 0.5259 0.7693 0.7966 1.0368 1.0736 3.45 B2 0.1841 0.4147 0.5853 0.8179 0.8469 0.9732 1.0077 3.45 B3 0.1841 0.4147 0.5853 0.8179 0.8469 0.8543 0.8847 5. Discu ss ion As a g en eral c ommen t, case s I and II , which con s id er t h e PV- only configu rations, are the most profitabl e. PV+bat tery con figurati ons are alrea dy profi table in very specifi c con d iti o n s, and only with t h e con fig u r ati o n whi c h has the hig h est PV pow er in s tall atio n (3.45 kW ), b eing sligh tly b etter w ith th e bi-hou rl y tariff. The bi -hou rl y tariff i s th e most profita ble e lectric ta ri f f to u s e in all the cases . Gen erally, th e Azores site con figura tions are th e less profi t ab le and th e Évora s ite are the m o s t profitab le, mostly due to the avail able s ol ar irradiation le v el s and con s equ e n tly hi g he r PV pow er gene ration. Al thou gh energy mana gemen t strategie s are rele van t for PV+b attery confi gurati o n s profitab ility, the geograph ical location and electric tarif f cho ice are essen tial fact o rs in the confi g u r ation ’s e con om ic an d ene r getic viab ili ty. The 25 y e ars an aly sis peri od con s id ers the invest men t in two batteries uni t s over t h at t i me pe r io d. Thi s deci s ion was made con side ring the u s eful lifecy c l e of th e li t hiu m -ion batterie s avail able in d icate d in the con s ul ted bibliograph y and warran t y by the ba tt ery m an u f actu rers . In the followin g, the m ain three obtained econ omic indicators are discu ssed. Regardi n g NPV, th e th r ee locati o n s ha v e si m il ar scena r io s , in the sen s e of a go/n o go decisi on regarding th e in vestmen t , as c an be ob served in Fi gure 10 , Fi g u re 11 an d Figure 12 . Case II is profita ble in all confi g urati o n s regardles s of the ele ctricity t ari f f or locatio n , al t h ough in some lo c at ions th is result is m ore po s iti v e than othe r s. In c lu ding a ba ttery is only econ omical ly v ia b le wh en th e gen erated PV en erg y is the biggest, na m ely in t h e IVB1 c on f i gura tion w ith 3 .45 kW 31 in stall ed PV pow er, and only f or the by - h ourly tariff. Case I pre s en ts on e unvia b le project, th e 3.45 k W size, re g ardl ess tariff, sin ce the oversi zin g of th e in s tall ation . Pay back time i s depi c ted i n Fi g u re 13 , Figu re 14 and Figu re 15 . As gen eral remark, th e pay back ti m e is po sitive for cases I an d II, an d mostly negati ve for c ase s III an d IV . W it h the con s id ered con dition s , case III i s u nprofi tabl e i n all l ocations. This case doesn ’t con s id er th e poten tial additional costs of a RESP conne ction, gene r ally associa ted wi th off -grid conn ections ( sin c e off-grid con f i gurati o n s are u sually ch aracterized by bein g distan t fro m th e avai labl e grid poin t of conn ection ) , and which w ould ha ve had i mpact in the econo mic in dicators in all the s tu died location s . T h e be s t PV+ba t te r y scen ario f or the Évora s ite is th e bi -hou rly tariff wi th 3.45 kW PV in s tal la tion IVB1, alth ough stil l consi dere d slightly high - 16 y e ars - compared wi t h a 25 years in vestment . An interestin g aspect is the differen c e betwe en th e obtain e d resul t s of c a se I V i n Évora, Po r to, an d in Az ores, be c au se of the di fferen t (hi g he r ) ele c tricity t ari f f in this last loca tion, and even t hou gh associated with t he smal lest sola r resource , presen ts th e worst scen ario s , c on cludin g th at a lth ough havin g a high er ele c tricity tariff still can’t compen s ate the l owe st solar irradi ation. Case I avera ge pay b ack i s 9.5 y ears f or th e l ocation o f Évora, 10 years fo r Porto an d 9.8 years for Azores. C ase II average pa y back is 7.8 y ears for Évora, 8. 6 ye ars for Por to an d 9.0 years for Azore s. T h is resul t show s that the g rid -conn ected instal lation s in Portu g al have bette r pay back, loca tion in depen dent, d u e t o the increased in co me of s el ling the energy su r plu s t o th e grid . Th is mean s th at in average, its 22 % more eco no mic to in vest in a grid-conn ected in s tallati o n (case I I) in Évora, 16 % in Porto an d 9 % in Az ores. Con sidering all sites, in some of the stu died situ ation s grid-parity is ach ie ved, observin g th e obtain ed LC OE valu es (Figu re 16 , F igu re 17 a n d Fi g u re 18 ). The lowe st val ues, a nd s o best resul ts , are obse rv ed in c ases I an d II, for a ll PV c on figu ration s a n d all t he locati o n s . T h e u se of the batteries presen t s posi t ive econ omic in terest in case IVB 1 for the 3.45 k W P V in stall ation. T h e low est PV+battery e n ergy profit occ u rs in Azo res. The m o st strikin g econ omically un v iable cases are th e case s cen arios II IB3 an d IV B3 0.50 k W , du e to the low u s age of the battery c ap abiliti es , an d high cost (inexi s ten ce of a ba lan c ed trade-off). The same commen t regard in g the case III b ecause of th e ab s en ce of additi o n a l costs a ssocia ted with the conne ctions with RESP , r el at ed t o off-grid con figurati ons , whi c h a r en ’ t consi dered in th is w ork. The IRR obtain ed results are prese n ted in Table A. 1 , Table A. 2 and Table A. 3., a n d a ge n e ral comment can be done regarding the high obtained values in the unprofitable conf igu ration’s cases. The B/C ratio, present in Table A. 4 , Table A. 5 and Table A. 6 , an d the hi g he r value, th e better pro j e ct viab ili ty. T h e in dicator cor r ob orates th e th r ee main discussed econ omic in dicators in this an alysi s. The energy analysi s m ad e, pre sente d in Table 9 , T ab le 10 an d Tabl e 11 allows a m o re detail ed a n alysis of the gene r ated en erg y use. T h e SCR dec reases with th e increase of th e 32 PV in stalled pow er, w hi ch con f irms th e existin g trad e -off betw een PV g en eration an d effecti v e consu m pti on of this energy . SCR indi cator is showin g how m u ch of t h e produced ene rgy is effectivel y self-consu m ed an d is alway s dep end e n t of the load diagram and PV gen eration. In Évora case I, S CR i s low er than the one in P orto, and Az ores h as the high est becau se the PV genera tion is th e low est , so th e ene rgy ratio is m ore in f luen c ed , c o m p ared to th e oth er locations. SSR in cr ea s es w ith the increase of the PV in st all ed powe r, becau s e th e biggest th e PV gen erated electricity , the bigges t th e con s u m ed en ergy, an d consi derin g th e ene rgy load con stan t. Th e BU i nd icator h e lp s in the evaluation of n eed of a battery syste m , an d its valu e is h igh when its use is h igh. In the case s III an d IV, th e BU in dicator con f i rms th at th e 0.50 k W an d 0.75 kW PV instal led power, the PV gen eration is too low to justify a bat t ery acqu isition, so its size is irre le vant in the fina l gross of ene r gy, in the th ree loca tion s . W i t h th e 1.50 kW an d 3 .45 kW P V install ed power, th e u se of th e battery increases a lot and h e lp s the energy indep e ndency . For mo st o f th e lo cation s , SMR is smal le r for the bi -hou rly tariff cases. Thi s indicator co mpare s the energy saved with the c urren t con f i gurati o n , con s i derin g the ene r gy price s at whi ch the ele ctricity is e ffecti vely s ol d, and th e electricity b ill , in one ye ar, after the payb ack ach ie vemen t. The releva n ce of the in troductio n of this indicato r is mostly to r epresen t the m ajo r di fferen c es amon g the use of diffe ren t electric prices an d di fferent electric compan ies’ prices o f the con tracted pow er and of en ergy ( EDP co mm er cial an d EDA). Th e fact tha t Az ores has a distin c t t ari ff is well observed in t he SMR indicator, becau s e it ha s t h e low est PV genera tion , but th e h ighe st remun eration for the ene rgy makes it ha v e some of the best SM R v alu es. For th e case IV, it is n oticeable t h at values ab ove th e unity m ea n s tha t one is earnin g m on ey with th e con f i gurati o n , even thou g h t he con f igu ration is alrea dy pai d . T h e 23 rd article of the DL 153 /201 4 doesn’t establi s h a limit for the UPAC ’s in j ecti on in RESP, s o this confi gura tion is very in terestin g . The bi g gest diffe rences be tw een cases III an d IV is promin ent in the hig h er PV i n stalled pow er , as the gri d in j ecti on r emu neration is v ery low. 6. Con cl usion The m ai n aim of thi s study was the ev alu ation of th e v i abili ty of di fferen t solar PV con f i gurati o n s in differen t situ atio n s. Four ca s es were in vest i gated, two ca ses w it h PV -only con f i gurati o n s, differin g fr o m each othe r by t h e in jection of the s u r plu s to th e gr id , and two PV +battery c on figu ratio n s which d i ffer also fr o m the injected s u rplus, an d t he inclu sion of batteri es. The m ost profi tabl e PV -on ly configu r ati o n s for the locati on s of Évora, Porto an d Azo res is the c ase II ( 0.50 kW PV pow er with bi -hou rly tariff). T h ese are foll owe d in a gen era l w ay by case I (0.50 kW PV po wer). The m o s t profita bl e PV+battery con f i gurati o n f or Év ora, Porto an d Azores is case IVB1 ( 3 .45 kW PV install ed pow er + 3 . 3 kWh battery ). Althou g h th ese are ve ry p ositi ve resu lts fro m a PV-only confi g u ration perspe ctive, most o f th e studi ed 33 cases of PV +b attery are n ’t pro fitable , bu t th e sc en ario show s a very po sitive fu t u re perspec t i ve. T h e bi - h ourly tariff presents b etter results, wi th the u sed lo ad profil e, whi c h doe sn’t have a profil e w ith s trikin g lo ad v ari ation s . T h e en ergy mana g emen t strate g y use d i n th is st u dy w as t h e s impl est, but the u sage of an intelligen t ene r gy m an agement s tra tegy c an , by itself, i m pro ve th e resu lts obtain ed in this stu dy, particul arly con sidering a m u l ti opti m iza t i on strate g y . Cu r ren t average price of the batte r ie s c on sidere d in this study is 492 €/k W h , w hich is still a very high valu e, an d make s th e CAPE X of t he PV +batter y con figurati on a competiti v e v alue, compared wi t h oth er alterna tives. Fu rther decr ea s e of the battery costs whi c h are expected in the followin g yea rs w ill be nee ded to impro ve the profita bi lity o f PV re siden tial applicati o n s , alth o u g h t h is study is a rema r k of that beginn ing . Ind epen dent of the techn ology chosen , battery en ergy storage h as bee n qui ck ly evol vin g , wi th techn ical improve m en ts bein g ach i eved, as for th e capaci ty , pe r forman c e, efficien c y and the r espo n s e that m anu factu rers are givin g to th e market . All t h e con f igu rations implemen t ed self-co nsumption , con side red to be the c u rr en t most ade qua t e conte xt to imple men t PV solar ene r gy in Portu gal in t h e residen tial sector , regardin g the legislati on in force. A re vision of the cu rr en t DL is on going du e to the evolu tion th at PV tech nol og y and batteries ha ve been s h owin g si nce 2014 (ye ar of th e DL prevale nce) , foll o win g th e ex ample of diffe ren t an d more profi tabl e reside ntial sche m e s, as net-mete r in g or commun it y sha ring P V gen eration , fro m an econ omic , e n erg eti c a n d social w ell-being poin t of view. Acknowledgements The pro ject AGE RAR ( Re f. 007 6_AGERA R_6 _E) is co-fin a n ced by the Eu ropean Regiona l Devel opment Fund ( ERD F), within the IN T ERRE G VA Sp ain-Portugal coope ration progra mme ( POC TEP). List of References [1] IEA-E TSAP an d IRENA, “Ren ewa ble Ene r gy Inte gration in Powe r Grids, Techn ology Brie f,” 2015. [2] Sol arPowerEuro pe, “Gl oba l Ma rket Outl ook for Sol ar Pow er 2017 - 2021,” 20 17. 34 [3] N. Oma r , “Fu ture an d Emergin g Te c h nolo gies, Work sho p o n Future Ba ttery Techn ologies for En erg y S torage,” T h e Publicati o n s Office of th e Euro pean Un ion, 2018. [4] L. Gol di e- Scot, “Blo omber gNEF ,” [On line]. A vail able: h t tps://abou t.bn ef.co m/blog/beh ind- scen es-take-li thium-ion -battery-pri ces/. [5] IRENA, “Inn ovation Landscape for a ren ewabl e-powe r ed f utu re: Solution s to in t egrate variab le renew ables,” Abu Dha b i, 20 19. [6] IEA, “In ternation a l E nergy Agen c y ,” 2019 . [On line]. A vaila ble: h t tps://ww w.iea .org/poli c ie s an dmeasu res/ren ewableen erg y /. [7] P. S. Mo lina , “pv magazi n e,” 2019. [Onl ine]. Avail able: h ttps:// w ww . pv- magazi ne.com/201 9/04 /08/spai ns-new-rul es-for-self- con s u m pti on - come-in to-f or c e/. [8] E. Bel lini, “pv m a g az in e,” [On line ] . Avai la ble: h t tps://w ww.pv- magazi ne.com/201 9/04 /08/i taly-offer s -in c en t i ves-for-ev s/. [9] J. R. Ma r tín , “Exclu s ive: Po r tu g al in energy storage p u s h as PV au ction cal end ar buil ds, ” PV T ECH , 2019. [10] E. Bel lini, “pv ma g az in e,” 20 19. [Onlin e]. Availa b le : h t tps://ww w. pv - magazi ne.com/201 9/04 /11/ed p - to -bu ild-portu gals-first- mw -size d- pv -plan t- cou p l ed- with -s torage/ . [11] M. C. Pache co an d J. M. Men des, “Electri c ity Regu la tion in Portugal : ove rview , Practi c al La w Coun tr y Q& A 6- 564 - 1565,” T h om son Reuters, 20 19. [12] O. d. T. e. E . Min istério d o Ambie n t e, Di ário d a Rep úbli c a, 1. ª série — N . º 202 — 20 de outub r o d e 20 14, 201 4. [13] G. Loren zi , R. d. S. Vi ei ra, C. A . S. Sil va and A. M artin , “Tech no - econ omic ana ly sis of u t ility- scale en ergy st orage in islan d settin gs,” J ou rnal o f En erg y Storag e, pp. 691-705 , 201 9. [14] S. Dhun d h ara, Y. P. Ve rm aa and A. Willi ams, “Techno -econ om i c an alysis of the lithiu m - ion a n d lead- acid ba t tery inmicrogrid systems,” Ene r gy Conve rs i on and Mana gement, vol. 17 7, pp. 12 2 -14 2, 2 018. [15] A. La hna oui, P . S tenz el an d J. L in ss en , “Techn o -econo mic an alysi s of p hotovol taic battery system con figu ration a nd locati o n ,” Ap plie d Energy, pp. 497-5 05, 20 18. [16] D. Sh aw- W il liams, C. Susi law ati and G. Wal ker, “Value of Reside n t ial I n vestmen t i n Ph otovoltaics an d B atteries in Netwo r ks: A Techn o - Eco n omic A n alysis,” energi es, 201 8. [17] E. T er vo, K. Agbi m, F. DeAn g el is, J. Hern ande z, H. K. Ki m an d A. Odu k o m aiy a, “ An econ omic an a ly s is of reside n t ial photovol taic sy stems wi th lithiu m ion battery s torage 35 in the Uni t ed State s,” Renewable and Su stai nable Energ y Revie ws, p p. 1057-10 66, 201 8. [18] F. Cucch iell a, I. D'Adamo an d M . Gastal di, “Pho t ovol taic en ergy s y st ems wi th battery storage fo r resid ential are as: an econ omic a naly sis,” J ou rnal of C leaner Prod uction, pp. 460 -474, 20 16. [19] G. C. Abdin an d M. Nou ss an , “Ele ctricity storage compa red to n et m ete ring in reside n t ial PV appli cation s ,” J ou rnal of C lean er Produ ction , vol. 176 , pp . 175-186 , 2018 . [20] F. M. Ca milo, R. Cast r o, M . Almei da an d V. F. Pires , “Econo mic assess m en t of reside n t ial PV sy stems wi th s el f - c on sumptio n a n d storage in Portu gal,” Solar Ene rgy, vol. 15 0, pp. 35 3 -36 2, 2 017. [21] C. H. Vil lar, D. Ne v es an d C. A . Si lva, “So lar PV sel f -con sumpti on : An analysi s of in fluencin g ind icators i n the Port u g u ese c on text,” Ene rg y S trateg y Re views, vol. 18, pp. 224 -234, 20 17. [22] J. Solan o, M. Bri t o a nd E. Ca amaño- Ma rtín , “Impa ct of fixed ch arg e s on the viabili ty of self- con sumption p h otovoltai c s,” Ene rgy Po li cy, vol. 122 , pp . 322-331 , 20 18. [23] DGEG, “Direcção - Ge ral de En ergia e Geol ogia,” 201 9. [On line ]. Availa ble: h t tp://w ww.d geg.gov.pt/ . [24] W. Sh ort, D. J. Pac key and T. Hol t , “A M anu al for t h e Econ omic Eval uation of En ergy Efficie ncy and Ren e w able Ene r gy Techn ologies,” NRE L, 199 5. [25] OM IE, “OMIE ,” 201 9. [On line]. Avail able : h t tp://m.o m ie.e s/report s /in dex.php ?m=y es&report_id=3 11#. [26] EDPD istribu ição , 201 9. [Onlin e]. Availab le: https://ww w.ed p di s tribu icao.pt/pt -pt/perfi s- de -consu m o. [27] EC, “PV g is , ” [On line ]. Avail able : http://re .jrc.ec.eu ropa.eu /pvgis/apps4/p v es t .ph p#. [28] “Sisifo ,” [On line]. Availa ble: https://w ww.sisi fo.in fo/pt/defa u lt. [29] Sol arGIS, 201 9. [On line ] . Availabl e: https://sol argi s.co m /ma ps -an d-gis- data/d ownload/p ortu g al . [30] APRE N, “APREN ,” 201 9. [Onl ine]. Availa ble: h t tps://w ww.ap r en . pt/pt/en ergias- ren ovaveis/produ cao. [31] ERSE , “Tarifas e Preço s pa ra a En ergua Elétrica e ou tr os s e rv i ços 201 9,” Lisbo a, 2018. [32] EDA, “P r eçá rio 201 9,” 201 8. [33] EDA, “Pe ríodos e Ho r á rios,” 201 8. [34] EDPC omercia l, 201 9. [On li n e]. Availa b le : https:/ /ww w .edp .pt/particu lares/apoi o- clien te/pergun t as-frequ entes/tarifa rios/o-qu e-preciso- de -saber -para- c on tratar/o-qu e- e-a-opcao -h oraria - e-qu al-a -melh or- pa r a- mim/faq- 4823. 36 [35] “METER BOOS T Da tashe et,” Lisbo n , 20 19. [36] “Ecosi st,” 20 19. [Onl ine]. Availa ble: https:// www .ecosist.n et/. [37] Sol arIm pac t, “Sol arImpact ,” 2019 . [On line]. Avai la ble: h tt ps://lo j a. s ol arimpact.pt/. [38] M. Sch achin ger, “pv magazi n e,” [On l in e]. Avai lable: h ttps://www .pv - magazi ne.com/featu res/in ve stors/modu le-pri ce-ind ex/. List of Fig u res Figu re 1 – Resu me of DL 1 53/2015 regi mes, th e UPP an d the UP AC. .............................. 10 Figu re 2 - Instal le d pow er distribu tion of th e Portu g u ese UPAC registered in st al lation s fro m th e avail able data o f the SERUP da taba se (DGE G 201 9), w ith 1 00 bin s . .......................... 13 Figu re 3 - Prob abi lit y den sity of th e l ogarit hm MCP install ed powe r (W), made a vail able from th e SER UP da taba se (DGEG 20 19), with 150 bin s . .......................................................... 13 Figu re 4 - Ave rage mon thly whole sale el ectricity prices of th e year of 201 8 for Portu g al . .. 18 Figu re 5 – Estimated el ectric dome stic con s umpti on p rofile of BTN C for 2019 , m ad e avai labl e by EDP Di s trib uiçã o (EDPDi st rib u iç ão 2 019). ..................................................... 19 Figu re 6 - So la r globa l ho rizontal irradi ation ( GHI ) m ap of Po rtugal territo ry ( Sol arGIS 20 19) ......................................................................................................................................... 20 Figu re 7 - Pe ak an d off-peak perio ds of th e da ily c y c l es, i n d iffere n tly f or su mm er and win t er legal times (EDPCo m e rc ia l 2019 ). .................................................................................... 21 Figu re 8 - En ergy flow s of t h e propo sed case scen arios. ................................................... 24 Figu re 9 – Example of th e Évora 1.50 kW PV install e d powe r with t he ( a) Case III, en ergy stored w ith a 3.3 kWh battery , and ( b) Case IV, en ergy stored to the 3.3 kW h battery a nd/o r exch anged wi t h th e grid. ................................................................................................... 24 Figu re 10 – Resu lts of th e NPV econ omic i ndi c ator f or t h e 8th studi ed con f igura tion s , for th e loca tion of Évora. .............................................................................................................. 26 Figu re 11 – Econo m ic in d icato r NPV fo r th e locati o n of Porto, for all the stu died con f i gurati o n s. .................................................................................................................. 26 Figu re 12 – Locati o n of Azores NPV re s u lts, for ea c h of the stu di ed con f igu rations. .......... 27 Figu re 13 – Resu lts of the PB T, for t h e locati on o f Évora, for t h e confi g u rations stud ied. ... 27 Figu re 14 – Resu lts of the PB T for a ll th e confi g u rations stu die d, for th e locati on o f Porto . 27 37 Figu re 15 – O btain ed r esu lts o f the PBT e c on omic in dicator for a ll the s tudi e d c on f igu rations, for th e region of Azores. .................................................................................................... 27 Figu re 16 – Resu lts of the LC OE for th e locati o n of Évora, fo r the stu died con figurati ons. . 28 Figu re 17 - Resul t s of the LC OE for the l ocation of Porto, for the stu died con fig u rations. .. 28 Figu re 18 - Obtai ned LCOE resul ts for the locati on of Azores, for al l the st ud ied con f i gurati o n s. .................................................................................................................. 28 List of T ables Table 1 - Bat t ery techn ologies and grid a ppli c ati ons (IRENA 2019). ................................... 6 Table 2 - Fee c h arges appli c ab le t o UPAC regi me w it h and wi t h out grid i n j ectio n , regardin g th e in s talle d power in kW – DGEG (Po rtaria 14/2015 ) re mun eration*. ............................... 10 Table 3 - El ect rici ty gene ration b al ance in th e Azores, fro m Jan uary to Dece m be r 201 8 (APREN 201 9). ................................ ................................................................................. 20 Table 4 - Flat an d bi-hou rl y tariffs of EDP Comer c ia l of t h e Portu g u ese con ti n ent a n d fr o m EDA i n the Az ores, for th e ye ar of 20 19. ................................................................ ........... 21 Table 5 - Lithiu m -ion ba ttery c h aracterizati on data, given b y t he manu fac ture r (METER BOOS T Da tashe et 201 9). .................................................................................... 22 Table 6 - Su mm a ry of th e prop osed scen arios. ................................................................ . 23 Table 7 - Gen eral con siderati ons of th e case stud y . .......................................................... 24 Table 8 - Co m pon ents price s an d con s id ered rates, for th e year of 20 19. ......................... 25 Table 9 - En ergetic an alysis for th e Évo ra s i te. ................................ .................................. 29 Table 10 - En erg eti c an alysis for th e locati o n of Porto. ...................................................... 29 Table 11 - En erg eti c an alysis for th e locati o n of Azores. ................................................... 30 Table A. 1 - Re s u lts of th e Inte rnal Rate of Return econo mic in d icato r, fo r the stu di ed con f i gurati o n s cases, f or t h e lo c ati on o f Évora. ................................................................ . 38 Table A. 2 - Obtain ed resul ts regardi n g the IRR eco n omic ind icator, for the studi ed con f i gurati o n s cases, f or th e location of Porto. .................................................................. 38 Table A. 3 - In ternal Ra t e of R etu rn e conomic in dicator r esu lts, for the stu di ed c on figura tion s cases, for th e location of Azores. ................................................................ ...................... 38 Table A. 4 - Obtain ed resul ts of th e Be nefit- to -Cost Ra t i o econ omic mea sure, fo r ea c h of th e stud ie d confi gurati o n s, for th e locati o n of Évora. ............................................................... 39 38 Table A. 5- R e s u lts of th e BC Ra t i o, fo r ea ch of th e stud ied c on fi gurati ons, fo r t h e locati on of Porto. ................................................................................................................................ 39 Table A. 6 - Resul ts of the Bene f i t- to -Cost Rati o, for th e location of Azo r es , for the studied con f i gurati o n s. .................................................................................................................. 39 Appendices Table A. 1 - Results of th e In ternal Rate of Ret u r n economic indicator, for the studied c onfigurati ons cases, for the loca tio n of Évora. Location of Évora Electri c Tarif f Flat Bi -hourl y Configur ation 0.5 0.75 1.5 3.45 0.5 0.75 1.5 3.45 I 13.0 8.41 -2.42 -188 14.7 9. 65 - 1. 17 -115 II 14.0 12.0 8. 08 5. 78 15.6 13.0 8. 69 6.13 IIIB1 -200 -199 -194 -194 - 19 6 - 19 5 -78.0 -193 IIIB2 - 20 2 - 20 2 -200 -200 -201 - 20 1 -200 -200 IIIB3 -203 - 20 3 - 20 2 -201 -202 -202 - 20 2 -201 IVB1 -200 -199 -194 -195 - 10 6 -60.1 -19.0 - 4. 66 IVB2 -202 - 20 2 -200 - 19 9 - 20 1 -200 - 19 9 -85.6 IVB3 -203 - 20 3 - 20 2 - 20 1 -202 -202 -201 -200 Table A. 2 - Obtained results regarding the IRR eco n omic in d i cator, f or th e studied configurations cases, for the location of Porto. Location of Porto Electri c Tarif f Flat Bi -hourl y Configur a ti o n 0.5 0.75 1.5 3.45 0.5 0.75 1.5 3.45 I 11.3 6.96 -3.60 -191 13.3 8.49 -2.11 -187 II 12. 0 10. 1 6.27 3.72 13. 9 11. 4 7.04 4.17 IIIB1 -201 -200 -196 -195 -196 -196 -194 -194 IIIB2 -203 -202 -200 -200 -201 -201 -200 -200 IIIB3 -203 -203 -202 -201 -202 -202 -202 -201 IVB1 -201 -200 -194 -1 95 -194 -120 - 29. 5 -7.12 IVB2 -203 -202 -200 -198 -201 -201 - 19 9 -196 IVB3 -203 -203 -202 -201 -202 -202 -201 -200 Table A. 3 - Internal Rate of Ret u r n economic indicator results, for the studied con f igu r ations cases, for the location of Azores. Location of Az ores Electri c Tarif f Flat Bi -hourl y Configur a ti o n 0.5 0.75 1.5 3.45 0.5 0.75 1.5 3.45 I 12.2 8.08 -1.71 -83.4 12.63 8.02 -2.46 -184 II 12. 2 10.1 5.86 2.58 12.56 10.04 5.44 2.24 III B1 -201 -200 -195 -134 -196 -195 -194 -194 39 III B2 -203 -202 -200 -199 -201 -201 -200 -200 III B3 -203 -203 -202 -201 -202 -202 -202 -201 I VB1 -201 -200 -194 -191 -162 -74.19 - 38. 4 -9.72 I VB2 -203 -202 -200 - 19 9 -201 -200 -200 -197 I VB3 -203 -203 -202 -201 -202 -202 -202 -201 Table A. 4 - Obtained results of the Benef i t- to -Co s t Ratio econo m ic measure, for ea ch of t h e studied configurations, for the location of Évo ra. Location of Évora Electri c Tarif f Flat Bi -hourl y Configur a ti o n 0.5 0.75 1.5 3.45 0.5 0.75 1.5 3.45 I 4.35 3.42 1.97 0.97 4.76 3.65 2.08 1.02 II 1.34 1.54 1.78 2.07 1.41 1.58 1.80 2.08 III B1 0.59 0.79 1.07 1.02 1.06 1.07 1.14 1.05 III B2 0.38 0.51 0.83 0.75 0.68 0.70 0.85 0.77 III B3 0.28 0.38 0.62 0.58 0.50 0.52 0.64 0.59 I VB1 0.45 0.61 0.85 0.83 0.87 0.90 1.07 1.45 I VB2 0.32 0.43 0.70 0.64 0.61 0.64 0.78 0.99 I VB3 0.25 0.33 0.55 0.51 0.47 0.50 0.61 0.68 Table A. 5- Results o f the BC Ratio, for each of the studied configurations, for the lo cat i on of Porto. Location of Porto Electri c Tarif f Flat Bi -hourl y Configur a ti o n 0.5 0.75 1.5 3.45 0.5 0.75 1.5 3.45 I 3.99 3.16 1.87 0.93 4.43 3.43 2.00 0.98 II 1.21 1.39 1.61 1.86 1.29 1.45 1.64 1.88 III B1 0.53 0.71 0.99 0.99 1.03 1.04 1.08 1.03 III B2 0.34 0.46 0.75 0.75 0.67 0.68 0.79 0.76 III B3 0.25 0.34 0.57 0.58 0.49 0.50 0.59 0.59 I VB1 0.41 0.55 0.78 0.80 0.84 0.87 0.99 1.35 I VB2 0.29 0.39 0.64 0.64 0.59 0.62 0.72 0.89 I VB3 0.22 0.30 0.50 0.51 0.46 0.48 0.57 0.66 Table A. 6 - Results of th e Benefit- to -Cost Ratio, for the location of Azores, for the studied configurations. Location of Az o res Electri c Tarif f Flat Bi -hourl y Configur a ti o n 0.5 0.75 1.5 3.45 0.5 0.75 1.5 3.45 I 4.19 3.36 2.03 1.04 4.28 3.34 1.96 1.00 II 1.48 1.64 1.78 1.89 1.48 1.61 1.72 1.84 IIIB1 0.52 0.70 1.05 1.10 1.05 1.05 1.06 1.03 IIIB2 0.34 0.46 0.74 0.82 0.68 0.69 0.73 0.76 IIIB3 0.25 0.34 0.56 0.64 0.50 0.51 0.55 0.59 IVB1 0.43 0.57 0.87 0.93 0.91 0.94 1.01 1.33 IVB2 0.30 0.40 0.65 0.73 0.63 0.66 0.72 0.90 IVB3 0.23 0.31 0.50 0.58 0.48 0.50 0.56 0.62
Original Paper
Loading high-quality paper...
Comments & Academic Discussion
Loading comments...
Leave a Comment