A Semi-Automated Usability Evaluation Framework for Interactive Image Segmentation Systems
For complex segmentation tasks, the achievable accuracy of fully automated systems is inherently limited. Specifically, when a precise segmentation result is desired for a small amount of given data sets, semi-automatic methods exhibit a clear benefi…
Authors: Mario Amrehn, Stefan Steidl, Reinier Kortekaas
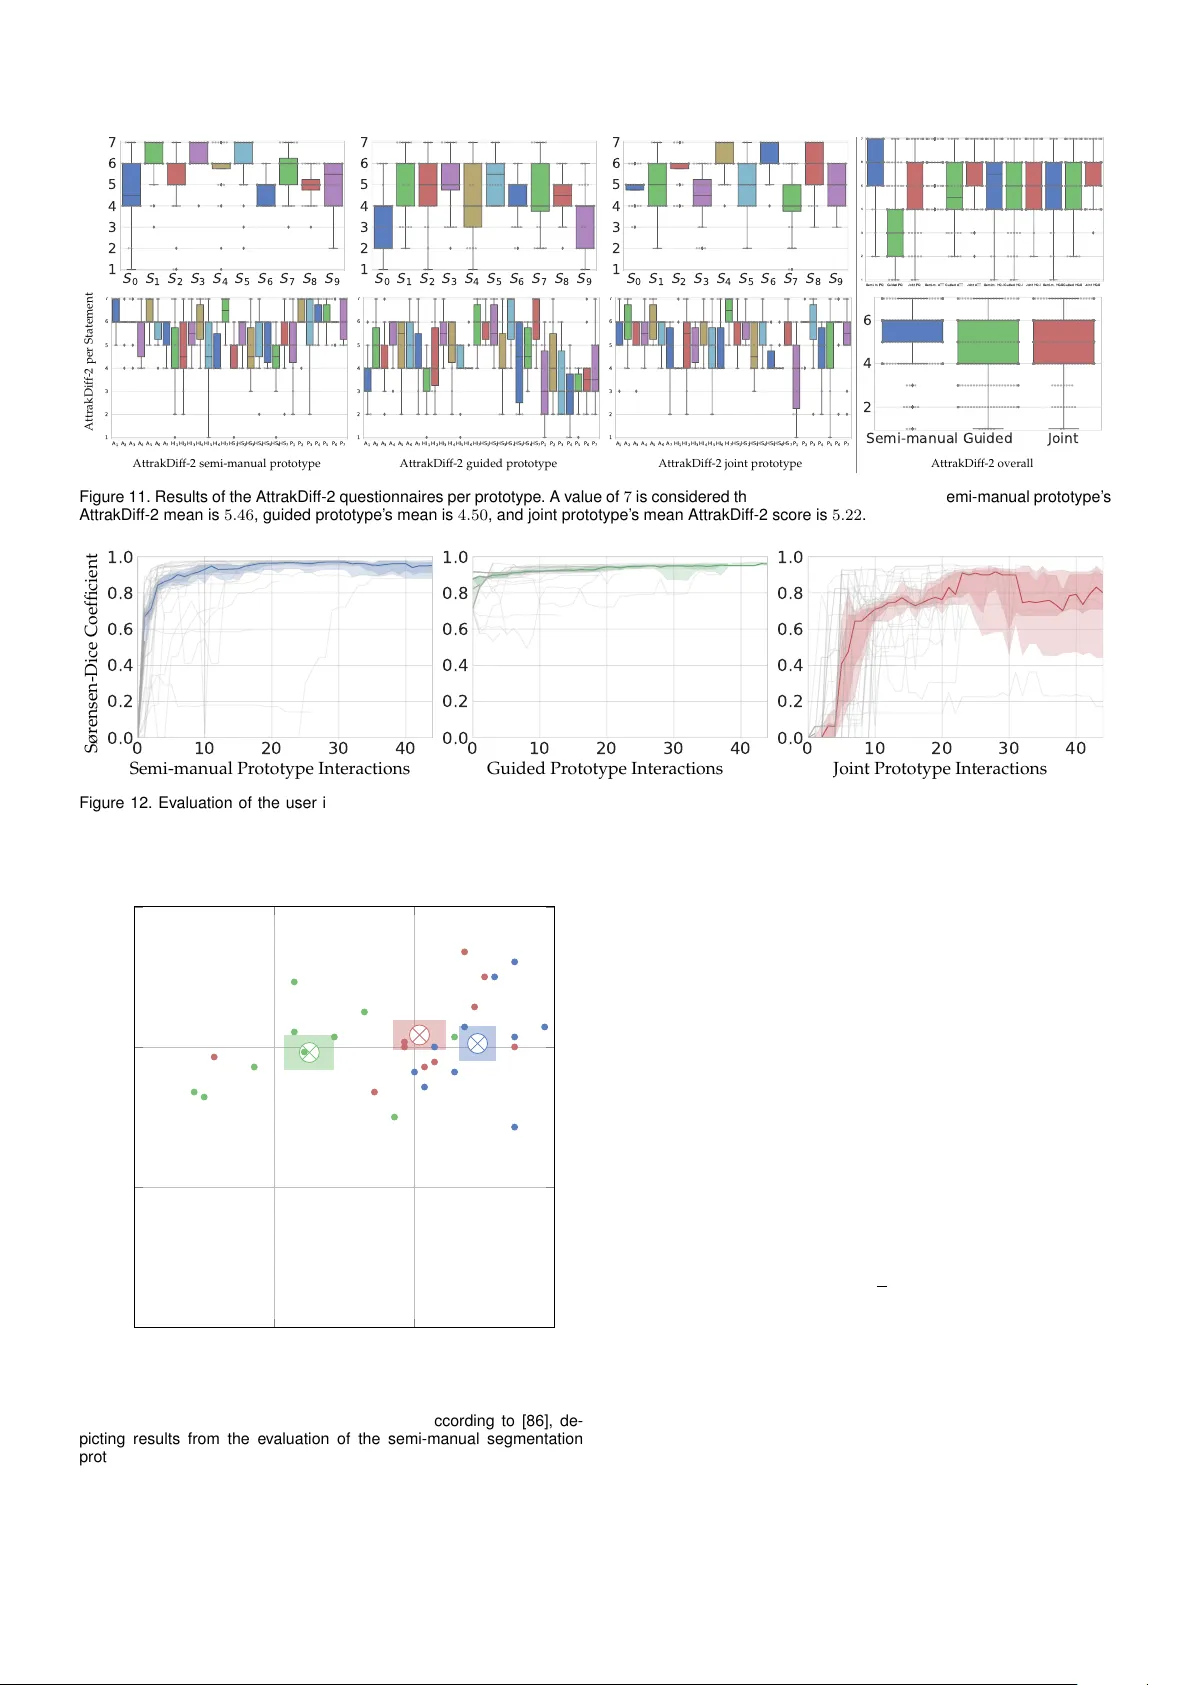
ACCEPTED AS RESEARCH AR TICLE A T THE INTERNA TIONAL JOURNAL OF BIOMEDICAL IMAGING, HIND A WI 1 A Semi-A utomated Usability Ev aluation F r ame w or k f or Interactiv e Image Segmentation Systems Mario Amrehn, Stefan Steidl, Reinier K or tekaas, Maddalena Strumia, Markus Weingar ten, Markus K ow arschik, Andreas Maier Abstract —For comple x segmentation tasks, the achie vab le accuracy of fully automated systems is inherently limited. Specifically , when a precise segmentation result is desired for a small amount of giv en data sets, semi-automatic methods e xhibit a clear benefit for the user . The optimization of human computer interaction (HCI) is an essential par t of interactiv e image segmentation. Ne ver theless , publications introducing no vel interactiv e segmentation systems (ISS) often lack an objectiv e compar ison of HCI aspects . It is demonstrated, that e ven when the underlying segmentation algorithm is the same throughout interactive prototypes , their user experience ma y vary substantially . As a result, users prefer simple interf aces as well as a considerable deg ree of freedom to control each iterativ e step of the segmentation. In this ar ticle, an objectiv e method for the comparison of ISS is proposed, based on e xtensive user studies . A summative qualitative content analysis is conducted via abstraction of visual and v erbal feedbac k given by the participants. A direct assessment of the segmentation system is ex ecuted by the users via the system usability scale (SUS) and Attr akDiff-2 questionnaires. Fur thermore, an approximation of the findings regarding usability aspects in those studies is introduced, conducted solely from the system-measur able user actions during their usage of interactive segmentation prototypes . The prediction of all questionnaire results has an aver age relative error of 8 . 9 %, which is close to the expected precision of the questionnaire results themselv es. This automated e valuation scheme may significantly reduce the resources necessary to inv estigate each variation of a prototype’ s user interface (UI) f eatures and segmentation methodologies. Index T erms —Usability , Methodology , User Study , Evaluation, Interactiv e Segmentation, Medical Image Segmentation. F Fork me on GitHub 1 I N T R O D U C T I O N T O the best of our knowledge, there is not one publi- cation in which user based scribbles are combined with standardized questionnaires in or der to assess an interactive image segmentation system’s quality . This type of syner getic usability measure is a contribution of this work. In order to provide a guideline for an objective comparison of interac- tive image segmentation approaches, a prototype providing a semi-manual pictorial user input, introduced in Sec. 2.2.1, is compared to a prototype with a guiding menu-driven UI, described in Sec. 2.2.2. Both evaluation results are analyzed with respect to a joint prototype, defined in Sec. 2.2.3, in- corporating aspects of both interface techniques. All three prototypes are built utilizing modern web technologies. An evaluation of the interactive prototypes is performed utilizing pragmatic usability aspects described in Sec. 4.2, as well as hedonic usability aspects analyzed in Sec. 4.3. These aspects are evaluated via two standardized ques- tionnaires (System Usability Scale and AttrakDiff-2) which form the ground truth for a subsequent prediction of the questionnaires’ findings via a regression analysis outlined • M. Amrehn, S. Steidl, and A. Maier are with the Pattern Recognition Lab, Computer Science Department, Friedrich-Alexander University Erlangen- Nurember g, Germany E-mail: mario.amrehn@fau.de • R. Kortekaas, M. Strumia, M. Weingarten, and M. Kowarschik are with Siemens Healthineers AG, Forchheim, Germany in Sec. 3.3. The outcome of questionnaire r esult prediction from interaction log data only is detailed in Sec. 4.4.This novel automatic assessment of pragmatic as well as hedonic usability aspects is a contribution of this work. Our sour ce code release for the automatic usability evaluation from user interaction log data can be found at https://github.com/ mamrehn/interactive image segmentation evaluation. 1.1 Image Segmentation Systems Image segmentation can be defined as the partitioning of an image into a finite number of semantically non-overlapping regions. A semantic label can be assigned to each region. In medical imaging, each individual region of a patients’ abdominal tissue might be r egarded as healthy or cancer ous. Segmentation systems can be grouped into three principal categories, each differing in the degree of involvement of an operating person (user): manual, automatic, and interactive. (1) During manual tumor segmentation, a user provides all elements i in the image grid which have neighboring elements N ( i ) of differ ent labels than i . The system then utilizes this closed curve contour line information to infer the labels for r emaining image elements via simple region growing. This minimal assistance by the system causes the overall segmentation process of one lesion to take up to several minutes of user interaction time. However , reaching an appropriate or even perfect segmentation result (despite noteworthy inter-observer differ ence [1]) is feasible [2, 3]. ACCEPTED AS RESEARCH AR TICLE A T THE INTERNA TIONAL JOURNAL OF BIOMEDICAL IMAGING, HIND A WI 2 In practice, few time-consuming manual segmentations are performed by domain experts, in order to utilize the results as a reference standard in radiotherapy planning [4]. (2) A fully automated approach does not involve a user ’s interference with the system. The introduced deficiency in domain knowledge for accurately labeling regions may be restor ed partially by automated segmentation approaches. The maximum accuracy of the segmentation result is there- fore highly dependent on the individual set of rules or amount of training data available. If the segmentation task is sufficiently complex, a perfect result may not be reachable. (3) Interactive approaches aim at a fast and exact segmen- tation by combining substantial assistance by the system with knowledge about a very good estimate of the true tumor extent provided by trained physicians during the segmentation process [5]. In contrast to fully automated solutions, prior knowledge is (also) provided during the segmentation process. Although, interactive approaches are also costly in terms of manual labor to some extent, they can supersede fully automated techniques in terms of accuracy . Due to their exact segmentation capabilities, interactive segmentation techniques are frequently chosen to outline pathologies during imaging assisted medical procedur es, like hepatocellular carcinomata during trans-catheter arte- rial chemoembolization (see Sec. 1.6). 1.2 Ev aluation of Image Segmentation Systems Performance evaluation is one of the most important as- pects during the continuous improvement of systems and methodologies. W ith non-interactive computer vision and machine learning systems for image segmentation, an objec- tive comparison of systems can be achieved by evaluating pre-selected data sets for training and testing. Similarity measures between segmentation outcome and ground truth images are utilized to quantify the quality of the segmenta- tion result. W ith interactive segmentation systems (ISS), a complete ground truth data set would also consist of the adaptive user interactions which advance the segmentation process. Therefor e, when comparing ISS, the user needs to be in- volved in the evaluation process. User interaction data however is highly dependent on (1) the users’ domain knowledge and the unique learning effect of the human throughout a period of exposure to the pr oblem domain, (2) the system’s underlying segmentation method and the users’ preferences toward this technique, as well as (3) the design and usability (the user experience [6, 7]) of the interface which is presented to the user during the inter- active segmentation procedure [3, 8]. This includes users’ differing prefer ences towards diverse interaction systems and tolerances for unexpected system behavior . Considering (1–3), an analytically expressed objective function for an interactive system is hard to define. Intuitively , the user wants to achieve a satisfying result in a short amount of time with ease [9]. A direct assessment of a system’s usability is enabled via standardized questionnaires, as described in Sec. 2.3. Individual usage of ISS can be evaluated via the segmentation result’s similarity to the ground truth labeling according to the Sørensen-Dice coefficient (Dice) [10] after each interaction. The interaction data utilized for these segmentations has to be r epresentative in order to generalize the evaluation results. 1.3 T ypes of User Interaction As described by Olabarriaga et al. [11] as well as Zhao and Xie [12], user interactions can be categorized with regar ds to the type of interface an ISS pr ovides. The fol- lowing categories are emphasized. (1) A pictorial mask image is the most intuitive form of user input. Humans use this technique when transferring knowledge via a visual medium [13]. The mask overlayed on the visualization of the image I ∈ R w,h to segment consists of structures called scribbles, where w is the width and h is the height of the 2-D image I in pixels. Scribbles are seed points, lines, and complex shapes, each r epresented as a set of individual seed points. One seed point is a tuple s i = ( p i , ` i ) , where p i ∈ R 2 describes the position of the seed in image space. The class label of a scribble in a binary segmentation system is rep- resented by ` i ∈ background , foregr ound . Scribbles need to be defined by the user in order to act as a repr esentative subset S of the ground truth segmentation G = { s 1 , s 2 , . . . } . (2) A menu-driven user input scheme as in [14, 15] limits the user ’s scope of action. Users trade distinct control over the segmentation outcome for more guidance provided by the system. The locations or the shapes of newly created scribbles are fixed before presentation to the user . It is challenging to achieve an exact segmentation result using a method from this category . Rupprecht et al. [14] describe significant deficits in finding small objects and outline a tendency of the system to automatically choose seed point locations near the object border , which cannot be labeled by most users’ visual inspection and would therefore not have been selected by the users themselves. Advantages of menu-driven user input are the high level of abstraction of the process, enabling efficient guidance for inexperienced users in their decision which action to perform for an op- timal segmentation outcome (regarding accuracy over time or number of interactions) [11, 16]. 1.4 Generation of Representative User Input Nickisch et al. [17] describe crowd sourcing and user studies as two methods to generate plausible user input data. The cost efficient crowd sourcing method often lacks control and knowledge of the users’ motivation. Missing context information for crucial aspects of the data acqui- sition procedur e creates a challenging task objectifying the evaluation results. Specialized fraud detection methods are commonly used in an attempt to pre-filter the recor ded corpus and extract a usable subset of data. McGuinness and O’Connor [18] proposed an evaluation of ISS via extensive user experiments. In these experiments, users are shown images with descriptions of the objects they ar e requir ed to extract. Then, users mark foreground and backgr ound pixels utilizing a platform designed for this purpose. These ac- quisitions are more time-consuming and cost intensive than crowd-sour cing, since they requir e a constant involvement of users. However , the study’s creators are able to control many aspects of the data recording process, which enables detailed observations of user r eactions. The data samples recor ded are a representative subset of the focus group ACCEPTED AS RESEARCH AR TICLE A T THE INTERNA TIONAL JOURNAL OF BIOMEDICAL IMAGING, HIND A WI 3 of the finalized system. A user study aims at maximizing repeatability of its results. In order to incr ease the objectivity of the evaluation in this work, a user study is chosen to be conducted. The study is described in Sec. 3.2. 1.5 State-of-the-art Evaluation of Interactive Segmen- tation Systems 1.5.1 Segmentation Challenges In segmentation challenges like SLIVER07 [19] (mainly) fully automated approaches ar e competing for the highest score regarding a predefined image quality metric. Semi- automatic methods are allowed for submission if the manual interaction with the test data is strictly limited to pre- processing and (single seed point) initialization of an other- wise fully automated process. ISS may be included into the contests’ final ranking, but are regarded as non-competing, since the structure of the challenges is solely designed for automated approaches. The PROMISE12 challenge [20] had a separate category for proposed interactive approaches, where the user (in this case, the person also describing the algorithm) may add an unlimited number of hints during segmentation, without observing the experts’ ground truth for the test set. No gr oup of experts was pr ovided to operate the interactive method for comparative results. The submit- ted interactive methods’ scores in the challenge’s ranking are therefore highly dependent on the domain knowledge of single operating users and can not be regar ded as an objective measure. 1.5.2 Comparisons for No vel Segmentation Approaches In principle, with every new proposal of an interactive segmentation algorithm or interface, the authors have to demonstrate the new method’s capabilities in an objective comparison with already established techniques. The effort spent for these comparisons by the original authors varies substantially . According to [9], many evaluation methods only consider a fixed input. This approach is especially unsuited for evaluation, without simultaneously defining an appropriate interface, which actually validates that a real person utilizing this UI is capable of generating similar input patterns to the ones provided. Although, ther e are some overview publications, which compare several ap- proaches [11, 18, 21, 22, 23], the number of publications out- lining new methods is disproportionately greater , leaving comparisons insufficiently covered. Olabarriaga et al. [11] main contribution is the pr oposition of criteria to evaluate interactive segmentation methods: accuracy , repeatability , and efficiency . McGuinness et al. [18] utilized a unified user interface with multiple underlying segmentation methods for the survey they conducted. They recor ded the current segmentation masks after each interaction to gauge segmen- tation accuracy over time. Instead of utilizing a standard- ized questionnaire, users were asked to rate the difficulty and perceived accuracy of the segmentation tasks on a scale of 1 to 5. Their main contribution is an empirical study by 20 subjects segmenting with four differ ent segmentation methods in order to conclude that one of the four methods is best, given their data and participants. Their ranking is primarily based on the mean accuracy over time achieved per segmentation method. McGuinness et al. [22] define a robot user in order to simulate user interactions during an automated interactive segmentation system evaluation. However , they do not investigate the similarity of their rule- based robot user to seed input pattern by individual human subjects. Zhao et al. [21] concluded in their overview over interactive medical image segmentation techniques, that there is a clear need of well-defined performance evaluation protocols for interactive systems. In T ab. 1, a clustering of popular publications describing novel interactive segmentation techniques is depicted. The evaluation methods can be compared by the type of data utilized as user input. Note that ther e is a trend towards more elaborate evaluations in more recent publications. The intent and perception of the interacting user are a valuable resour ce worth considering when comparing interactive segmentation systems [24]. However , only two of the 42 related publications listed in T ab. 1 make use of the insights about complex thought processes of a human utilizing an interactive segmentation system for the ranking of novel interactive segmentation methods. Ramkumar et al. [25, 26] acquire these data by well-designed questionnaires, but do not automate their evaluation method. W e propose an automated, i. e. scalable, system to approximate pragmatic as well as hedonic usability aspects of a given interactive segmentation system. 1.6 Clinical Application for Interactive Segmentation Hepatocellular carcinoma (HCC) is among the most preva- lent malignant tumors worldwide [63, 64]. Only 20 – 30 % of cases are curable via surgery . Both, a patient’s HCC and hep- atic cirr hosis in advanced stages may lead on to the necessity of alternative tr eatment methods. For these inoperable cases, trans-catheter arterial chemoembolization (T ACE) [65] is a promising and widely used minimally invasive intervention technique [66, 67]. During T ACE, extra-hepatic collateral vessels are occluded, which previously supplied the HCC with oxygenated blood. T o locate these vessels, it is crucial to find the exact shape as well as the position of the tu- mor inside the liver . Interventional radiology is utilized to generate a volumetric cone-beam C-arm computed tomog- raphy (CBCT) [68] image of the patient’s abdomen, which is processed to precisely outline and label the lesion. The toxicity of T ACE decreases, the less healthy tissue is labeled as pathologic. The efficacy of the therapy increases, the less cancerous tissue is falsely labeled as healthy [69]. However , precisely outlining the tumor is challenging, especially due to its variations in size and shape, as well as a high diver- sity in X-ray attenuation coefficient values repr esenting the lesion as illustrated in Fig. 1. While fully automated systems may yield insufficiently accurate segmentation results, ISS tend to be well suited for an application during T ACE. 2 M E T H O D S In the following Section, the segmentation method under - lying the user interface prototypes is described in Sec. 2.1 in order to subsequently adequately outline the dif ferent characteristics of each novel interface prototype in Sec. 2.2. Usability evaluation methods utilized are detailed regard- ing questionnaires in Sec. 2.3, semi-structured feedback in Sec. 2.4, as well as the test environment in Sec. 2.5. ACCEPTED AS RESEARCH AR TICLE A T THE INTERNA TIONAL JOURNAL OF BIOMEDICAL IMAGING, HIND A WI 4 T able 1 Overview of seed point location selection methods f or a set of influential publications in the field of interactiv e image segmentation. Additional unordered seed inf or mation can be retrie ved b y a) manually dra wn seeds or b) randomly gener ated seeds. Seeds can be inf erred rule-based from the ground truth segmentation by c) sampling the binary mask image, d) from provided bounding bo x mask images, e) random sampling from tri-maps generated by erosion and dilation, or f) b y a robot user i. e. user simulation. A tri-map specifies backg round, foreground, and mix ed areas. Seeds can also be provided b y real users via the g) final seed masks after all interactions on one input image, or h) the ordered iterativ e scribbles. i) Questionnaire data from Goals, Operators , Methods, and Selection rules (GO) as well as National Aeronautics and Space Administration T ask Load Index (TL) may be retrie ved by interviewing users after the segmentation process. Chec k marks indicate the usage of seeds in the publications listed. Pub lications with check marks in brack ets display these seeds b ut do not utilize them f or ev aluation. Arbitrary Seeds Seeds Derived from GT Multiple User Data based Seeds (a) (b) (c) (d) (e) (f) (g) (h) (i) Y ear Publication Manual Random Binary Mask Box T ri-maps Robot Final Seeds Scribbles Questionnaire 2019 Amrehn [27] ✓ [9, 28, 29] 2018 Chen [30] ( ✓ ) ✓ [14] ✓ ( N = 10 ) Amrehn [31] ✓ 2017 Liew [32] ( ✓ ) ( ✓ ) ✓ [9] W ang [33] ✓ ( N = 2 ) W ang [29] ✓ [34] ✓ ( N = 2 ) Amrehn [34] ✓ ✓ [29] Amrehn [35] ✓ 2016 Ramkumar [25] ✓ (GO, TL) Ramkumar [26] ✓ (TL) Jiang [36] ✓ [37] ✓ ( N = 5 ) Xu [28] ( ✓ ) ( ✓ ) ✓ Chen [38] ✓ 2015 Andrade [39] ✓ Rupprecht [14] ✓ ✓ 2014 Bai [40] ✓ ✓ 2013 Jain [41] ✓ ✓ He [42] ✓ 2012 Kohli [9] ✓ ✓ ✓ ( ✓ ) ✓ 2011 Zhao [43] ✓ ✓ T op [44] ( ✓ ) ✓ ✓ ( N = 4 ) McGuinness [22] ( ✓ ) ✓ ✓ 2010 Nickisch [17] ✓ ✓ ( ✓ ) ✓ Gulshan[45] ✓ ( ✓ ) Batra [46] ✓ ✓ Ning [47] ✓ Price [48] ✓ ✓ [49] ✓ [50] Moschidis [51] ✓ 2009 Moschidis [52] ✓ ✓ Singaraju [49] ✓ ✓ [50] 2008 Duchenne [53] ✓ ✓ [50] Levin [54] ✓ V icente [55] ✓ 2007 Protiere [56] ✓ 2006 Boykov [57] ✓ Grady [58] ✓ 2005 V ezhnevets [59] ✓ Cates,[60] ( ✓ ) ✓ ( N = 8 + 3 ) 2004 Li [61] ✓ Rother [50] ✓ ( ✓ ) ( ✓ ) ✓ Blake [62] ✓ ✓ [37] 2001 Martin [37] ✓ ✓ 2.1 Segmentation Method GrowCut [59] is a seeded image segmentation algorithm based on cellular automaton theory . The automaton is a tuple ( G I , Q , δ ) , where G I is the data the automaton op- erates on. In this case G I is the graph of image I , where the pixels/voxels act as nodes v e . The nodes are connected by edges on a grid defined by the Moor e neighbor hood system. Q defines the automaton’s possible states and δ the state transition function utilized. Q ∋ Q t e = ( p e , ` t e ) , Θ t e , c e , h t e (1) As detailed in Eq. 1, Q is the set of each node’s state, wher e p e is the node’s position in image space and ` t e is the class label of node e at GrowCut iteration t . 0 ≤ Θ t e ≤ 1 is the strength of e at iteration t . The feature vector c e describes the node’s characteristics. The pixel value I ( p e ) at image location p e is typically utilized as feature vector c e [59]. Here, we additionally define h t e ∈ N 0 as a counter for ac- cumulated label changes of e during the GrowCut iteration, as described in [31], with h t = 0 e = 0 . Note that this extension of GrowCut is later utilized for seed location suggestion in two of the three prototypes tested. A node’s strength Θ t = 0 e is initialized with 1 for scribbles, i. e. ( p e , ` t = 0 e ) ∈ S t = 0 , and 0 otherwise. Iterations δ Q t e = Q t + 1 e are performed utilizing local state transition rule δ : starting from initial seeds, labels are propagated based on local intensity features c . At each discrete time step t , each node f attempts to conquer its direct neighbors. A node e is conquered if the condition in ACCEPTED AS RESEARCH AR TICLE A T THE INTERNA TIONAL JOURNAL OF BIOMEDICAL IMAGING, HIND A WI 5 Figure 1. Liver lesion segmentations. Depicted are centr al slices through the volumes of interest of reconstructed images acquired by a C-ar m CBCT scanner . The manually annotated ground tr uth segmentation is display ed as an ov erlay contour line in green. Eq. 2 is true. Θ t f ⋅ g ( c e , c f ) > Θ t e , wher e (2) g ( c e , c f ) = 1 − c e − c f 2 max j,k c j − c k 2 (3) If node e is conquered, the automaton’s state set is updated according to Eq. 4. If e is not conquered, the node’s state remains unchanged, i. e. Q t + 1 e = Q t e . Q t + 1 e = (( p e , ` t f ) , Θ t f ⋅ g ( c e , c f ) , c e , h t e + 1 ) , (4) The pr ocess is guaranteed to converge with positive and bounded node strengths ( ∀ e,t Θ t e ≤ 1 ) monotonously decreasing (since g ( . ) ≤ 1 ). The image’s final segmentation mask after convergence is encoded as part of state Q t = ∞ , specifically in ( p e , ` t = ∞ e ) for each node e . 2.2 Interactive Segmentation Prototypes Three interactive segmentation prototypes with differ ent UIs wer e implemented for usability testing. The segmen- tation technique applied in all prototypes is based on the GrowCut approach as described in Sec. 2.1. GrowCut al- lows for efficient and parallelizable computation of image segmentations while providing an acceptable accuracy fr om only few initial seed points. The method is also chosen due to its tendency to benefit from careful placement of large quantities of seed points. It is therefor e well suited for an integration into a highly interactive system. A learning- based segmentation system was not utilized for usability testing due to its inherent dependence of segmentation quality on the characteristics of prior training data, which potentially adds a significant bias to the test results, given only a small data set as utilized in the scope of this work. All thr ee user interfaces provided include an undo button to reverse the effects of the user ’s latest action. A finish button is used to define the stopping criterion for the Figure 2. Semi-manual segmentation prototype user interface. The cur- rent segmentation’ s contour line (light blue) is adjusted towards the user’ s estimate of the ground truth segmentation by manually adding foreg round (blue) or backg round (red) seed points. interactive image partitioning. The transparency of both, the contour line and seed mask displayed, is adjustable to one of five fixed values via the opacity toggle button. The image contrast and brightness (windowing) can be adapted with standard control sliders for the window width and the window center operating on the image intensity value range [70]. All protoypes incorporate a help button used to provide additional guidance for the pr ototype’s usage during the segmentation task. The segmentation process starts with a set of pre-defined background-labels S 0 along the edges of the image, since an object is assumed to be located in its entirety inside the displayed region of the image. 2.2.1 Semi-manual Segmentation Prototype The UI of the semi-manual prototype, depicted in Fig. 2, provides several interaction elements. A user can add seed points as an overlay mask displayed on top of the im- age. These seed points have a pre-defined label of either foregr ound for the object or background used for all other image elements. The label of the next brush strokes (scrib- bles) can be altered via the buttons named object seed and background seed . After each interaction n ∈ N , a new iteration of the seeded segmentation is started given the image I as well as the updated set of seeds S n = S n − 1 ∪ { s n 1 , s n 2 , . . . } as input. 2.2.2 Guided Segmentation Prototype The system selects two seed point locations p n 1 and p n 2 , each with the lowest label certainty values assigned by the previous segmentation process. The seed point loca- tions are shown to the user in each iteration n , as de- picted in Fig. 3. There are four possible labeling schemes for those points in the underlying two-class classification problem, since each seed point s n i = ( p n i , ` n i ) has a label ` n i ∈ { back gr ound, f oreg r ound } . The interface pr oviding advanced user guidance displays the four alternative seg- mentation contour lines, which are a result of the four possible next steps during the iterative interactive segmen- tation with respect to the labeling of the new seed points s n 1 and s n 2 . The user selects the only correct labeling, where ACCEPTED AS RESEARCH AR TICLE A T THE INTERNA TIONAL JOURNAL OF BIOMEDICAL IMAGING, HIND A WI 6 Figure 3. Guided segmentation prototype user interface . The current segmentation display ed on the upper left can be improv ed by choosing one of the four segmentation alter nativ es displayed on the r ight. The user is expected to choose the upper-r ight option in this configuration, due to the two ne w seeds’ matching background and f oreground labels. all displayed object and background seeds are inside the object of interest and the image background, respectively . The alternative views on the right act as four buttons to define a selection. T o further assist the user in their decision making, the region of interest, defined by p n 1 and p n 2 , is zoomed in for the option view on the right and displayed as a cyan rectangle in the overview image on the left of the UI. The differ ences regarding the previous iteration’s contour line and one of the four new options each are highlighted by dotted areas in the four overlay mask images. After the user selects one of the labelings, the two new seed points are added to the current set of scribbles S n . The scribbles S n ∶ = S n − 1 ∪ s n 1 , s n 2 are utilized as input for the next iter - ation, on which basis two new locations p n + 1 1 and p n + 1 2 are computed. The system-defined locations of the additional seed points can be determined by arg max e h t = ∞ ,n − 1 e , the loca- tion(s) with maximum number of label changes during GrowCut segmentation. Frequent changes define specific image elements and areas in which the GrowCut algorithm indicates uncertainty in finding the correct labels. T wo loca- tions in h t = ∞ ,n − 1 are then selected as p n 1 and p n 2 , which stated the most changes in labeling during the previous segmentation with input image I and seeds S n − 1 . 2.2.3 Joint Segmentation Prototype The joint prototype depicted in Fig. 4 is a combination of a pictorial interaction scheme and a menu-driven approach. (1) A set of J ∈ N pre-selected new seeds is displayed in each iteration. The seeds’ initial labels are set automatically , based on whether their position is inside (foreground) or outside (background) the current segmentation mask. The user may toggle the label of each of the new seeds, which also provides an intuitive undo functionality . The automated suggestion process for new seed point locations is depicted in Fig. 5. The seed points are suggested deterministically based on the indices of the maximum values in an element- wise sum of three approximated influence maps. These maps are the gradient magnitude image of I , the pr evious label changes h t = ∞ ,n − 1 per element in G I weighted by an Figure 4. Joint segmentation prototype user interface. The user toggles the labels of pre-positioned seed points, which positions are displayed to them as colored circles, to proper ly indicate their inclusion into the set of object or background representatives. New seeds can be added at the position of current interaction via a long-press on the overlay image. The segmentation result as well as the displa yed contour line adapt accordingly after each interaction. empirically determined factor of 17 / 12 , and an influence map based on the distance of each element in I to the current contour line. Note that for the guided pr ototype (see Sec. 2.2.2), only h was used for the selection of suggested seed point locations. This scheme was extended for the joint prototype, since extracting J ≈ 20 instead of only the top two points solely from h potentially introduces suggested point locations forming impractical local clusters instead of spreading out with higher variance in the image domain. This process approximates the true influence or entropy (information gain) of each possible location for a new seed. When all seed points s n 1 , s n 2 , . . . , s n J pr esented to the user are toggled to their correct label, the user may click on the new points button to initiate the next iteration with an updated set of seed points S n = S n − 1 ∪ { s n 1 , s n 2 , . . . , s n J } . An- other set of seed points { s n + 1 1 , s n + 1 2 , . . . , s n + 1 J } is generated and displayed. (2) In addition to pr e-selected seeds, a single new seed point s n 0 can be added manually via a user ’s long-press on any location in the image. A desired change in the current labeling of this region is interpreted given this user action. Therefore, the new seed point’s initial label is set by inverting the current label of the given location. A new segmentation is initiated by this interaction based on S n = S n − 1 ∪ s n 0 , s n 1 , . . . , s n J . Note that the labels of s n i are still subject to change via toggle interactions until the new points button is pressed. 2.3 Questionnaires 2.3.1 System Usability Scale (SUS) The SUS [71, 72] is a widely used, reliable, and low-cost sur- vey to assess the overall usability of a pr ototype, product, or service [73]. Its focus is on pragmatic quality evaluation [74, 75]. The survey is technology agnostic, which enables a utilization of the usability of many types of user interfaces and ISS [76]. The questionnaire consists of ten statements and an unipolar five-point Likert scale [77]. This allows for ACCEPTED AS RESEARCH AR TICLE A T THE INTERNA TIONAL JOURNAL OF BIOMEDICAL IMAGING, HIND A WI 7 Figure 5. The approximated influence map f or new seed point loca- tions for the joint segmentation prototype. The map is generated by a weighted sum of gradient magnitude image, number of cell changes h t = ∞ e per cell e obtained from the previous GrowCut segmentation, as well as the distance to the contour line of the current segmentation. an assessment in a time span of about thr ee minutes per participant. The statements are as follows: 1) I think that I would like to use this system frequently . 2) I found the system unnecessarily complex. 3) I thought the system was easy to use. 4) I think that I would need the support of a technical person to be able to use this system. 5) I found the various functions in this system were well integrated. 6) I thought there was too much inconsistency in this system. 7) I would imagine that most people would learn to use this system very quickly . 8) I found the system very cumbersome to use. 9) I felt very confident using the system. 10) I needed to learn a lot of things before I could get going with this system. The Likert scale provides a fixed choice response format to these expr essions. The ( N − 1 )/ 2 th choice in an N -point Likert scale always is the neutral element. Using the scale, subjects are asked to define their degree of consent to each given statement. The fixed choices for the five-point scale are named strongly disagree , disagree , undecided , agree , and strongly agree . During the evaluation of the survey , these names are assigned values x SUS s,i ∈ { 0 , 1 , . . . , 4 } per subject s in the order presented, for statements with index i ∈ { 1 , 2 , . . . , 10 } . SUS scores enable simple interpretation schemes, understandable also in multi-disciplinary project teams. The result of the SUS survey is a single scalar value, in the range of zero to 100 as a composite measur e of the overall usability . The score is computed according to Eq. 5, as outlined in [71], given S participants, where x SUS s,i is the response to the statement i by subject s . sus ( x ) = 2 . 5 S ∑ s ∑ odd i x SUS s,i + ∑ even i ( 4 − x SUS s,i ) (5) A neutral participant ( ∀ i x SUS s,i = 2 ) would pr oduce a SUS score of 50 . Although the SUS score allows for straight- forward comparison of the usability throughout different 0 14.0 28.6 44.0 60.7 77.9 93.1 100 0.00 0.02 0.04 worst awful poor OK good excellent best System usability scale (SUS) rating Figure 6. Mapping from a SUS score to an adjective rating scheme proposed by Bangor et al. [76]. Given a SUS rating, the relative height of the Gaussian distr ibutions approximate the probabilities for each adjective . Distributions’ µ and σ were extracted ev aluating 959 sur ve ys with added adjective r ating as an 11th question. systems, there is no simple intuition associated with the resulting scalar value. SUS scores do not provide a linear mapping of a system’s quality in terms of overall usability . In practice, a SUS of less than 80 is often interpreted as an indicator of a substantial usability problem with the system. Bangor et al. [76, 78] proposed an interpretation of the score in a seven-point scale. They added an eleventh question to 959 surveys they conducted. Here, participants were asked to describe the overall system as one of these seven items of an adjective rating scale: worst imaginable , awful , poor , OK , good , excellent , and best imaginable . The resulting SUS scores could then be corr elated with the adjectives. The mapping from scores to adjectives r esulting fr om their evaluation is depicted in Fig. 6. This mapping also enables an absolute interpretation of a single SUS score. 2.3.2 Semantic Diff erential AttrakDiff-2 A semantic differential is a technique for the measurement of meaning as defined by Osgood et al. [79, 80]. Semantic differ entials are based on the theory , that the implicit antici- patory response of a person to a stimulus object is regarded as the object’s meaning. Since these implicit r esponses them- selves cannot be recor ded directly , more apparent r esponses like verbal expressions have to be considered [81, 82]. These verbal responses have to be sensitive to and maximally dependent on meaningful states while independent from each other [80]. Hassenzahl et al. [83, 84] defined a set of 28 pairs of verbal expressions suitable to represent a subject’s opinion on the hedonic as well as pragmatic quality (both aspects of perception) and attractiveness (an aspect of assessment) of a given interactive system separately [85]. During evaluation, the pairs of complementary adjectives are clustered into four groups, each associated with a dif- ferent aspect of quality . Pragmatic quality (PQ) is defined as the perceived usability of the interactive system, which is the ability to assist users to reach their goals by providing utile and usable functions [86]. The attractiveness (A TT) quantizes the overall appeal of the system [87]. The hedonic quality (HQ) [88] is separable into hedonic identity (HQ-I) and hedonic stimulus (HQ-S). HQ-I focuses on a user ’s identification with the system and describes the ability of a product to communicate with other persons benefiting the user ’s self-esteem [89]. HQ-S describes the perceived novelty of the system. HQ-S is associated with the desire to advance ones knowledge and proficiencies. The clustering ACCEPTED AS RESEARCH AR TICLE A T THE INTERNA TIONAL JOURNAL OF BIOMEDICAL IMAGING, HIND A WI 8 into these four groups for the 28 word pairs are defined as depicted in T ab. 2. For each participant, the order of word pairs and order of the two elements of each pair are randomized prior to the survey’s execution. A bipolar [90] seven-point Likert scale is pr esented to the subjects to expr ess their relative ten- dencies toward one of the two opposing statements (poles) of each expression pair , where index three denotes the neutral element. For the questionnaire’s evaluation for sub- ject s ∈ { 0 , 1 , . . . , S − 1 } , each of the seven adjective pairs i ∈ { 0 , 1 , . . . , 6 } per group g ∈ { PQ , A TT , HQ-I , HQ-S } is assigned a score x g s,i ∈ { 1 , 2 , . . . , 7 } by each participant, reflecting their tendency towar ds the positive of the two adjectives. The overall ratings per group are defined in [83] as the mean scores computed over all subjects s and statements i , as depicted in Eq. 6. Here, S is the number of participants in the survey . attrakdiff ( x , g ) = 1 7 ⋅ S ∑ s ∑ i x g s,i (6) Therefor e, a neutral participant would produce an AttrakDiff-2 score of four . The final averaged score of each group g ranges from one (worst) to seven (best rating). An overall evaluation of the AttrakDiff-2 results can be conducted in the form of a portfolio representation [86]. HQ is the mean of a system’s HQ-I and HQ-S scores. PQ and HQ scores of a specific system and user are visualized as a point in a two-dimensional graph. The 95 % confi- dence interval is an estimate of plausible values for rating scores from additional study participants, and determines the extension of the rectangle around the described data point in each dimension. A small rectangle area repr esents a mor e homogeneous rating among the participants than a lar ger area. If a rectangle completely lies inside one of the seven fields with associated adjectives defined in [86], this adjective is regar ded as the dominant descriptor of the system. Otherwise, systems can be particularized by overlapping fields’ adjectives. If the confidence rectangles of two systems overlap in their one-dimensional projection on either HQ or PQ, their difference in AttrakDiff-2 scores in regar ds to this dimension is not significant. 2.4 Qualitative Measures In order to collect, normalize, and analyze visual and verbal feedback given by the participants, a summative qualitative content analysis is conducted via abstraction [91, 92]. The abstraction method reduces the overall transcript material while preserving its substantial contents by summarization. The corpus retains a valid mapping of the recording. An es- sential part of abstraction is the formulation of macro oper- ators like elimination, generalization, construction, integra- tion, selection and bundling. The abstraction of statements is increased iteratively by the use of macro operators, which map statements of the curr ent level of abstraction to the next, while clustering items based on their similarity [93]. 2.5 HCI Evaluation A user study is the most precise method for the evalu- ation of the quality of differ ent interactive segmentation approaches [17]. Analytical measures as well as subjective measures can be derived from standardized user tests [94]. From interaction data recor ded during the study , the r epro- ducibility of segmentation results as well as the achievable accuracy with a given system per time can be estimated. The complexity and novelty of the system can be expressed via the observed convergence to the ground truth over time spent by the participants segmenting multiple images each. The user ’s satisfaction with the interactive approaches is expr essed by the analysis of questionnaires, which the study participant fills out immediately after their tests are conducted and before any discussion or debriefing has started. The respondent is asked to fill in the questionnaire as spontaneously as possible. Intuitive answers are desired as user feedback instead of well-thought-out responses for each item in the questionnaire [71]. For the randomized A/B study , individuals are selected to approximate a representative sample of the intended users of the final system [95]. During the study , subjects are given multiple interactive segmentation tasks to fulfill each in a limit time frame. The user segments all m images provided with two differ ent methods (A and B). All subjects are given 2 ⋅ m tasks in a randomized order to prevent a learning effect bias, which would allow for higher quality outcomes for the later tasks. V ideo and audio data of the subjects are recor ded. Every user interaction recognized by the system and its time of occurrence are logged. 3 E X P E R I M E N T S 3.1 Data Set for the Segmentation T asks In Fig. 7 the data set used for the usability test is de- picted. For this evaluation, the RGB colored images are converted to grayscale in order to increase similarity to the segmentation process of medical images acquired from CBCT. The conversion is performed in accordance with the ITU–R BT .709-6 recommendation [96] for the extraction of true luminance I ∈ R w,h defined by the International Commission on Illumination (CIE) fr om contemporary cath- ode ray tube (CR T) phosphors via Eq. 7, where I ′ R ∈ R w,h , I ′ G ∈ R w,h , and I ′ B ∈ R w,h are the linear r ed, green, and blue color channels of I ′ ∈ R w,h, 3 respectively . I = 0 . 2126 ⋅ I ′ R + 0 . 7152 ⋅ I ′ G + 0 . 0722 ⋅ I ′ B (7) Image Fig. 7(b) is initially presented to the study partici- pants in order to familiarize themselves with the upcoming segmentation process. The segmentation tasks associated with images Fig. 7(a, c, d) are then displayed sequentially to the subjects in randomized order . The images are chosen to fulfill two goals of the study . (1) Ambiguity of the ground truth has to be minimized in order to suppress noise in the quantitative data. Each test person should have the same understanding and consent about the corr ect outline of the object to segment. Therefore, clinical images can only be utilized with groups of specialized domain experts. (2) The degree of complexity should vary between the im- ages displayed to the users. Image (b), depicted in Fig. 7, of moderate complexity with regards to its disagreement coefficient [97], is displayed first to learn the process of segmentation with the given pr ototype. Users ar e asked for an initial testing of a prototype’s features utilizing this ACCEPTED AS RESEARCH AR TICLE A T THE INTERNA TIONAL JOURNAL OF BIOMEDICAL IMAGING, HIND A WI 9 T able 2 AttrakDiff-2 statement pairs . The pairs of complementary adjectives are clustered into f our groups, each associated with a diff erent aspect of quality . All 28 pairs are presented to participants in randomized order . Pragmatic quality (PQ) Attractiveness (A TT) Hedonic identity (HQ-I) Hedonic stimulus (HQ-S) complicated, simple bad, good alienating, integrating cautious, bold confusing, clearly structured disagr eeable, likeable cheap, premium conservative, innovative cumbersome, straightforward discouraging, motivating isolating, connective conventional, inventive impractical, practical rejecting, inviting separates me from, brings me closer to people dull, captivating technical, human repelling, appealing tacky , stylish ordinary , novel unpredictable, predictable ugly , attractive unpresentable, presentable undemanding, challenging unruly , manageable unpleasant, pleasant unprofessional, professional unimaginative, creative (a) (b) (c) (d) Figure 7. In the top row , image data utilized in the usability tests are depicted. In the bottom row , the ground tr uth segmentations of the images are illustrates. The image of a contrast enhanced aneur ysm (a) and its ground tr uth annotation by a medical exper t were composed for this study . Images (b – d) are selected from the Gr abCut image database initially created for [50]. image without any time pressur e. The subsequent inter- actions during the segmentations of the remaining three images are recor ded for each prototype and participant. The complexity increases from (a) to (d), according to the GT s’ Minkowski-Bouligand dimensions [98]. The varying complexity enables a more objective and extended differ- entiation of subjects’ performances with given prototypes. 3.2 Usability T est Setup T wo separate user studies are conducted to test all proto- types described in Sec. 2.2, in or der to keep the time for each test short (less than 10 minutes per prototype), thus retaining the focus of the participants, while minimizing the occurrence of learning ef fect artifacts in the acquired data. Note that the participants use this time not only to finish the segmentation tasks, but also to familiarize themselves with the novel interaction system, as well as to form opinions about the system while testing their provided interaction features. (1) The first user test is a randomized A/B test of the semi-manual prototype ( Sec. 2.2.1) and the guided prototype ( Sec. 2.2.2). T en individuals ar e selected as test subjects due to their advanced domain knowledge in the fields of medical image processing and mobile input devices. The subjects are given the task to segment m = 3 differ ent images with varying complexity , which are de- scribed in Sec. 3.1, in random order . A fourth input image of medium complexity is provided for the users to familiarize themselves with the ISS before the tests. As an interaction device, a mobile tablet computer is utilized, since the final Ca m e ra 1 Ca m e ra 2 R e c o rd e r T a bl e t po s i t i on Ca m e r a 3 Figure 8. User testing setup for the usability e valuation of the prototypes . In this environment, a user performs an interactive segmentation on a mobile tablet computer while sitting. RGB cameras record the hand motions on the input de vice and f acial expressions of the par ticipant. In addition, each recognized input is recorded on the tablet device (the interaction log). segmentation method is intended for usage via such a medium. The small 10 . 1 inch ( 13 . 60 cm ⋅ 21 . 75 cm) WUXGA display and fingers utilized as a multi-touch pointing de- vice further exacerbate the challenge to fabricate an exact segmentation for the participants [99]. The user study envi- ronment is depicted in Fig. 8. Audio and video recor dings are evaluated via a qualitative content analysis, described in Sec. 2.4, in order to detect possible improvements for the tested prototypes and their interfaces. After segmen- tation, each participant fills out the SUS ( Sec. 2.3.1) and AttrakDiff-2 ( Sec. 2.3.2) questionnaires. (2) The second user test is conducted for the joint seg- mentation prototype ( Sec. 2.2.3). The data set and test setup are the same as in the first user study and all test persons of study (1) also participated in study (2). One additional subject participated only in study (2). T wo months passed between the conduction of the two studies, in which the former participants were not exposed to any of the proto- types. Therefor e, the learning effect bias for the second test is neglectable. 3.3 Prediction of Questionnaire Results The questionnair es’ PQ, HQ, HQ-I, HQ-S, A TT, and SUS results are predicted, based on features extracted fr om the interaction log data. For the prediction, a regr ession anal- ysis is performed. Stochastic Gradient Boosting Regression Forests (GBRF) are an additive model for regression anal- ysis [100, 101, 102]. In several stages, shallow regression trees are generated. Such a tree is a weak base learner each resulting in a prediction error ε = b + v , with high bias b and low variance v . These regr ession trees are utilized to minimize an arbitrarily differentiable loss function each on ACCEPTED AS RESEARCH AR TICLE A T THE INTERNA TIONAL JOURNAL OF BIOMEDICAL IMAGING, HIND A WI 10 the negative gradient of the previous stage’s outcome, thus reducing the overall bias via boosting [103]. The Huber loss function [104] is utilized for this evaluation due to its increased robustness to outliers in the data with respect to the squared error loss. The collected data set of user logs is split randomly in a ratio of 4 ∶ 1 for training and testing. An exhaustive grid search over 20 , 480 parameter combinations is performed for each of the six GBRF estimators (one for each ques- tionnaire result) with scorings based on an eight-fold cross- validation on the training set. 3.3.1 Feature Definition The collected data contains 31 samples with 216 pos- sible features each. The 31 questionnair e results (PQ, HQ, HQ-S, HQ-I, A TT, SUS), are predicted based on features extracted from the interaction log data of the four images segmented with the system. Four features are the relative median seed positions per user and their standard deviation in two dimensions. 22 additional features, like the number of undo operations ( #Undos ) and number of interactions ( #Interactions ), the overall computation time ( Σ Computation time ), overall interaction time ( Σ Interaction time ), elapsed real time ( Σ Wall time ), Final Rand index , and Final Dice score are r educed to one scalar value each by the mean and median, over the four segmentations per prototype and user , to obtain 48 base features. Since these features each only correlate weakly with the questionnair e r esults, composite featur es are added in order to assist the model’s learning process for feature relations. Added features are composed of one base feature value divided by (the mean or median of) computation time, interaction time, or elapsed real time. The r elations between those time values themselves ar e also added. In total, 216 features directly related to the interaction log data are used. In addition, a principal component analysis (PCA) is performed in order to add 10 % ( 22 ) features with maximized variance to the directly assessed ones to further assist the feature selection step via GBRFs. 3.3.2 Feature Selection f or SUS Prediction For the approximation of SUS results, a feature selection step is added to decrease the prediction error by an addi- tional three per cent points: here, after the described initial grid search, 1 % (205) of the GBRF estimators, with the lowest mean deviance from the ground truth, are selected to approximate the most important features. From those estimators, the most important featur es for the GBRFs are extracted via a 1 / loss -weighted feature importance voting. This feature importance voting by 205 estimators ensures a more robust selection than deciding the feature ranking from only a single trained GBRF. After the voting, a second grid search over the same 20 , 480 parameter combinations, but with a reduction from 238 to only 25 of the most important features is performed. 4 R E S U LT S 4.1 Overall Usability The result of the SUS score is depicted in Fig. 9. According to the mapping ( Fig. 6) intr oduced in Sec. 2.3.1, the adjective T able 3 Relative absolute prediction errors f or AttrakDiff-2 and SUS test set samples. Predictions are computed b y six separately trained Stochastic Gradient Boosting Regression F orests (GBRFs), one for each figure of merit. Note that each training process only utilizes the interaction log data. Results display ed are the median values of 10 4 randomly initialized training processes . Relative Error A TT HQ HQ-I HQ-S PQ SUS Mean 11.5 % 7.4 % 10.5 % 8.0 % 15.7 % 10.4 % Median 8.9 % 6.3 % 9.4 % 6.2 % 13.7 % 8.8 % Std 8.0 % 5.5 % 6.7 % 6.9 % 12.0 % 7.1 % rating of the semi-manual and joint prototypes are excellent ( 88 respective 82 ), the adjective associated with the guided prototype is good ( 67 ). A graph r epresentation of the similarity of individual usability aspects, based on the acquired questionnaire data, is depicted in Fig. 10. Based on the Pearson correlation coefficients utilized as a metric for similarity , the SUS score has the most similarity to the pragmatic (PQ) and attractive- ness (A TT) usability aspects provided by the AttrakDiff-2 questionnaire. 4.2 Pragmatic Quality The PQ results of the AttrakDiff-2 questionnaire ar e illus- trated in Fig. 11. The PQ scores for semi-manual, guided, and joint prototypes are 88 %, 50 %, and 74 % of the maxi- mum score, respectively . Since each of the 95 % confidence intervals are non-overlapping, the prototypes’ ranking re- garding PQ are significant. The quantitative evaluation of recorded interaction data is depicted in Fig. 12. Dice scores before the first interaction are zero, except for the guided pr ototype ( 0 . 82 ± 0 . 02 ), where few fixed seed points had to be provided to initialize the system. Utilizing the semi-manual prototype and starting from zero, a similar Dice measure to the guided prototype’s initialization is reached after about seven interactions, which takes 13 . 06 ± 2 . 05 seconds on average. The median values of final Dice scores per prototype are 0 . 95 (semi-manual), 0 . 94 (guided), and 0 . 82 (joint). The mean overall elapsed wall time in seconds spent for interactive segmentations per prototype are 73 ± 11 (semi-manual), 279 ± 36 (guided), and 214 ± 24 (joint). Since segmenting with the guided version takes the longest time and does not yield the highest final Dice scores, the initial advantage from pre-existing seed points does not bias the top ranking of a prototype in this evaluation. 4.3 Hedonic Quality 4.3.1 Identity and Stimulus The AttrakDiff-2 questionnaire provides a measure for the HQ of identity and stimulus introduced in Sec. 2.3.2. The HQ scores for semi-manual, guided, and joint prototypes are 72 %, 70 %, and 77 % of the maximum score, respectively . Since the 95 % confidence intervals are overlapping for all thr ee pr ototypes, no system ranks significantly higher than the others. An overall evaluation of the AttrakDiff-2 results is conducted in the form of a portfolio r epresentation depicted in Fig. 13. ACCEPTED AS RESEARCH AR TICLE A T THE INTERNA TIONAL JOURNAL OF BIOMEDICAL IMAGING, HIND A WI 11 SUS score per Subject S 0 S 1 S 2 S 3 S 4 S 5 S 6 S 7 S 8 S 9 0 1 2 3 4 S 0 S 1 S 2 S 3 S 4 S 5 S 6 S 7 S 8 S 9 0 1 2 3 4 S 0 S 1 S 2 S 3 S 4 S 5 S 6 S 7 S 8 S 9 S 1 0 0 1 2 3 4 SUS score per Statement Q 1 Q 2 Q 3 Q 4 Q 5 Q 6 Q 7 Q 8 Q 9 Q 1 0 0 1 2 3 4 Q 1 Q 2 Q 3 Q 4 Q 5 Q 6 Q 7 Q 8 Q 9 Q 1 0 0 1 2 3 4 Q 1 Q 2 Q 3 Q 4 Q 5 Q 6 Q 7 Q 8 Q 9 Q 1 0 0 1 2 3 4 Semi-manual Guided Joint 0 1 2 3 4 SUS semi-manual prototype SUS guided prototype SUS joint prototype SUS overall Figure 9. Results of the SUS questionnaires per prototype. V alues are normalized in accordance with Eq. 5, such that 4 is considered the best possible result for each question. The Semi-manual prototype’s SUS mean is 88 , guided prototype’s mean is 67 , and joint prototype’s mean SUS score is 82 . PQ HQ 0.38 A TT 0.82 HQ-I 0.61 SUS 0.60 0.73 0.86 HQ-S 0.79 0.39 0.82 0.39 0.58 0.38 0.52 Figure 10. P earson correlation coefficients for the AttrakDiff-2 (blue) and SUS (red) questionnaire results, based on the acquired questionnaire data. The line thickness is propor tionate to correlation strength of the different aspects of quality measured. 4.3.2 Qualitative Content Analysis A summative qualitative content analysis as described in Sec. 2.4 is conducted on the audio and video data recorded during the study . After generalization and reduction of given statements, the following user feedback is extracted with respect to three problem statements: positive usability aspects, negative usability aspects, and user suggestions concerning existing functions or new functions. Feedback for multiple prototypes 1) Responsiveness: the most common statement concern- ing the semi-manual and joint version is that the user expected the zoom function to be more responsive and thus more time efficient. 2) V isibility: 20 % of the participants had difficulties dis- tinguishing between the segmentation contour line and either the background image or the foregr ound scrib- bles in the overlay mask, due to the proximity of their assigned color values. 3) Feature suggestion: deletion of individual seed points instead of all seeds from last interaction using undo . Semi-manual segmentation prototype 1) Mental model: 30 % of test persons suggested clearly visible indication whether the label for the scribble drawn next will be foregr ound or background. 2) V isibility: hide previously drawn seed points, in order to prevent confusion with the current contour line and occultation of the underlying image. Guided segmentation prototype 1) Responsiveness: 50 % of test persons suggested an in- dicator for ongoing computations during their time of waiting. 2) Control: users would like to influence the location of new seed points, support for manual image zoom, and fine grained control for the undo function. Joint prototype 1) V isibility: 64 % of users intuitively found the toggle functionality for seed labels without prior explanation. 2) V isibility: 64 % of participants suggested visible instruc- tions for manual seed generation. 4.4 Prediction of Questionnaire Results from Log Data The questionnair es’ results ar e predicted via a regr ession analysis, based on featur es extracted from the interaction log data. A visualization of the feature importances for the regr ession analysis with respect to the GBRF is depicted in Fig. 14. An evaluation with the test set is conducted as depicted in T ab. 3. The mean prediction errors for the questionnaires’ results ar e 15 . 7 % for PQ and 7 . 4 % for HQ. In both cases, the error of these (first) estimates is larger but close to the average 95 % confidence intervals of 5 . 5 % (PQ) and 4 . 0 % (HQ) for the overall questionnaire results in the portfolio repr esentation. The similarity graph for the acquired usability aspects introduced in Fig. 10 can be extended to outline the direct relationship between questionnaire results and recorded features. Such a graph is depicted in Fig. 15. Notably , there is no individual feature, which strongly corr elates with one of the questionnaire results. However , as the results of the regr ession analysis in T ab. 3 depict, there is a noteworthy dependence of the usability aspects measured by the SUS and AttrakDiff-2 questionnaires and combinations of the ACCEPTED AS RESEARCH AR TICLE A T THE INTERNA TIONAL JOURNAL OF BIOMEDICAL IMAGING, HIND A WI 12 AttrakDiff-2 per Subject S 0 S 1 S 2 S 3 S 4 S 5 S 6 S 7 S 8 S 9 1 2 3 4 5 6 7 S 0 S 1 S 2 S 3 S 4 S 5 S 6 S 7 S 8 S 9 1 2 3 4 5 6 7 S 0 S 1 S 2 S 3 S 4 S 5 S 6 S 7 S 8 S 9 1 2 3 4 5 6 7 Semi-m. PQ Guided PQ Joint PQ Semi-m. ATT Guided ATT Joint ATT Semi-m. HQ-I Guided HQ-I Joint HQ-I Semi-m. HQ-S Guided HQ-S Joint HQ-S 1 2 3 4 5 6 7 AttrakDiff-2 per Statement A 1 A 2 A 3 A 4 A 5 A 6 A 7 H I 1 H I 2 H I 3 H I 4 H I 5 H I 6 H I 7 H S 1 H S 2 H S 3 H S 4 H S 5 H S 6 H S 7 P 1 P 2 P 3 P 4 P 5 P 6 P 7 1 2 3 4 5 6 7 A 1 A 2 A 3 A 4 A 5 A 6 A 7 H I 1 H I 2 H I 3 H I 4 H I 5 H I 6 H I 7 H S 1 H S 2 H S 3 H S 4 H S 5 H S 6 H S 7 P 1 P 2 P 3 P 4 P 5 P 6 P 7 1 2 3 4 5 6 7 A 1 A 2 A 3 A 4 A 5 A 6 A 7 H I 1 H I 2 H I 3 H I 4 H I 5 H I 6 H I 7 H S 1 H S 2 H S 3 H S 4 H S 5 H S 6 H S 7 P 1 P 2 P 3 P 4 P 5 P 6 P 7 1 2 3 4 5 6 7 Semi-manual Guided Joint 2 4 6 AttrakDiff-2 semi-manual prototype AttrakDiff-2 guided prototype AttrakDiff-2 joint prototype AttrakDiff-2 overall Figure 11. Results of the AttrakDiff-2 questionnaires per prototype. A value of 7 is considered the best possible result. The Semi-manual prototype’ s AttrakDiff-2 mean is 5 . 46 , guided prototype’ s mean is 4 . 50 , and joint prototype’ s mean AttrakDiff-2 score is 5 . 22 . Sørensen-Dice Coef ficient 0 10 20 30 40 0.0 0.2 0.4 0.6 0.8 1.0 0 10 20 30 40 0.0 0.2 0.4 0.6 0.8 1.0 0 10 20 30 40 0.0 0.2 0.4 0.6 0.8 1.0 Semi-manual Prototype Interactions Guided Prototype Interactions Joint Prototype Interactions Figure 12. Evaluation of the user interaction data. The segmentations’ similarity to the ground truth according to the Dice score is depicted per interaction. The median Dice rating as well as the 75 % and 95 % confidence inter vals are illustr ated. 1 3 5 7 1 3 5 7 super- fluous too self- oriented neutral self- oriented too task- oriented task- oriented desired Pragmatic Quality (PQ) Hedonic Quality (HQ) Figure 13. AttrakDiff-2 por tf olio representation, according to [86], de- picting results from the ev aluation of the semi-manual segmentation prototype (blue), guided prototype (g reen), and joint prototype (red). The rectangular areas illustrate the 95 % confidence inter vals for the mean value in each dimension. The mean intervals are 5 . 5 % f or PQ and 4 . 0 % for HQ. recor ded features. The most important featur es for the approximation of the questionnair e results are depicted in T ab. 4. 5 D I S C U S S I O N 5.1 Usability Aspects Altough the underlying segmentation algorithm is the inter - active GrowCut method for all three prototypes tested, the measured user experiences varied significantly . In terms of user stimulus HQ-S a more innovative interaction system like the joint prototype is preferr ed to a traditional one. Pragmatic quality aspects, evaluated by SUS as well as AttrakDiff-2’s PQ, clearly outline that the semi-manual ap- proach has an advantage over the other two techniques. This conclusion also manifests in the Dice coefficient values’ fast convergence rate towards its maximum for this prototype. The normalized median Σ Wall time spent for the overall segmentation of each image are 100 % (semi-manual), 550 % (guided), and 380 % (joint). As a result, users prefer the simple, pragmatic interface as well as a substantial degree of freedom to contr ol each iterative step of the segmentation. The less cognitively challenging approach is preferred [26]. The other methods provide more guidance for aspects which the user aims to control themselves. In order to improve the productivity of an ISS, less guidance should be imposed in these cases, while providing more guidance on aspects of the process not apparent to the users’ focus of attention [105]. ACCEPTED AS RESEARCH AR TICLE A T THE INTERNA TIONAL JOURNAL OF BIOMEDICAL IMAGING, HIND A WI 13 T able 4 The five most important features per GBRF estimator/label. Orange bac kground colors indicate the most frequently used f eatures in the trained decision trees of the GBRFs. Y ellow backg rounds highlight semantically similar feature pairs. The ab breviations represent the receiv er operating characteristic area under the cur v e (ROC A UC), logistic loss (LOG), and relative absolute area/v olume diff erence (RA VD). 1. 2. 3. 4. 5. A TT Mean(ROC AUC/ Σ wtime) Mean(Dice)/Mean( Σ wtime) Mean(LOG)/Mean( Σ ctime) Med(OBJ TPR)/Med( Σ ctime) Med( Σ ctime) HQ-I Mean(ROC AUC/ Σ wtime) PCA V AL 17 Mean(Dice)/Mean( Σ wtime) Med(Med ctime)/Med( Σ wtime) Mean(LOG)/Mean( Σ ctime) HQ Med(Jaccard/ Σ ctime) PCA V AL 17 Mean(ROC AUC/ Σ wtime) Mean(OBJ TPR/ Σ wtime) Mean(RA VD/ Σ ctime) HQ-S Mean(RA VD)/Mean( Σ ctime) Med(Med wtime/ Σ wtime) Med(LOG) Std(Relative Seed Coord H) Med(MSE) PQ PCA V AL 16 Mean( Σ otime/ Σ ctime) Mean(Dice)/Mean( Σ ctime) PCA V AL 11 Med(Med ctime/ Σ wtime) SUS PCA V AL 2 PCA V AL 18 Std(Relative Seed Coord H) Med(Med wtime) PCA V AL 20 Feature importance Feature Indices Feature importance Feature indices sorted by importance Figure 14. Relative feature impor tance measures from 1 % ( 205 ) of best GBRF estimators from grid search as descr ibed in Sec. 3.3.2. The orange rectangle on the top r ight highlights features added via PCA transf or mation. Relative feature impor tance is depicted on a log scale on the bottom. 5.2 Usability Aspects Appro ximation For A TT and HQ-I, the most discriminative features se- lected by GBRFs are the receiver operating characteristic area under the curve (ROC AUC) of the final interactive segmentations over the elapsed real time which passed during segmentation ( Σ Wall time ). The Jaccard index [106] as well as the relative absolute area/volume difference (RA VD) each divided by the computation time are most relevant for HQ, respective HQ-S. The pragmatic quality’s (PQ) dominant features are composed of final Dice scores and time measur ements per segmentation. The SUS results, quantifying the overall usability of a prototype, is mainly predicted based on the features with the highest level of abstraction used. In the top 10 % ( 22 ) selected features, 45 % of top SUS features are PCA values, as indicated in T ab. 4 and Fig. 14(top). In comparison: PQ 41 %, HQ 36 %, HQ-I 18 %, A TT 14 %, and HQ-S 9 %. 6 C O N C L U S I O N For sufficiently complex tasks like the accurate segmenta- tion of lesions during T ACE, fully automated systems are, by their lack of domain knowledge, inherently limited in the achievable quality of their segmentation results. ISS may supersede fully automated systems in certain niches by cooperating with the human user in order to reach the common goal of an exact segmentation result in a short amount of time. The evaluation of interactive appr oaches is more demanding and less automated than the evaluation with other approaches, due to complex human behavior . However , there are methods like extensive user studies to assess the quality of a given system. It was shown, that even a suitable approximation of a study’s results regar ding pragmatic as well as hedonic usability aspects is achievable from a sole analysis of the users’ interaction recordings. Those records are straightforward to acquire during normal (digital) prototype usage and can lead to a good first es- timate of the system’s usability aspects, without the need to significantly increase the temporal demands on each participant by a mandatory completion of questionnaires after each system usage. This mapping of quantitative low-level features, which are exclusively based on measurable interactions with the system (like the final Dice score, computation times, or relative seed positions), may allow for a fully automated assessment of an interactive system’s quality . 7 O U T L O O K For the proposed automation, a rule-based user model (robot user) like [27, 34] or a learning-based user model could interact with the pr ototype system instead of a human user . This evaluation scheme may significantly reduce the amount of resour ces necessary to investigate each variation of a prototype’s UI features and segmentation methodolo- gies. An estimate of a system’s usability can therefor e be acquired fully automatically with dependence only on the chosen user model. In addition, the suitable approximation of a usability study’s result can be used as a descriptor , i. e. feature vector , for a user . These features can be utilized for a clustering of users, which is a necessary step for the application of a personalized segmentation system. Such an interactive segmentation system might benefit from prior knowledge about a user ’s prefer ences and input patterns in order to achieve accurate segmentations from less interac- tions. ACCEPTED AS RESEARCH AR TICLE A T THE INTERNA TIONAL JOURNAL OF BIOMEDICAL IMAGING, HIND A WI 14 Figure 15. Features from user interaction logs (green) correlated with SUS (red) and AttrakDiff-2 (blue) questionnaire results. Bold feature names highlight top five most impor tant f eatures with regards to GBRFs. Only relations with a P earson correlation coefficient abs ( c ) > 0 . 5 and p < 0 . 05 are display ed. Note that this visualization is an extension to Fig. 10. D I S C L A I M E R The concept and software presented in this paper are based on resear ch and are not commercially available. Due to reg- ulatory reasons its future availability cannot be guaranteed. C O N FL I C T S O F I N T E R E S T The authors declare that ther e ar e no conflicts of interest regar ding the publication of this paper . A C K N OW L E D G M E N T Thanks to Christian Kisker and Carina Lehle for their hard work with the data collection. R E F E R E N C E S [1] A. S. Becker , B. K. Barth, P . H. Marquez, O. F . Donati, E. J. Ulbrich, C. Karlo, C. S. Reiner , and M. A. Fischer , “Increased interreader agreement in diagnosis of hepatocellular carcinoma using an adapted li-rads algorithm,” European Journal of Radiology , vol. 86, pp. 33–40, 2017. [Online]. A vailable: Source 1.1 [2] Y . S. Kim, J. W . Kim, W . S. Y oon, M. K. Kang, I. J. Lee, T . H. Kim, J. H. Kim, H.-S. Lee, H. C. Park, H. S. Jang et al. , “Interobserver variability in gross tumor volume delineation for hepatocellular carcinoma,” Strahlentherapie und Onkologie , vol. 192, no. 10, pp. 714–721, 2016. [Online]. A vailable: Source 1.1 [3] T . S. Hong, W . R. Bosch, S. Krishnan, T . K. Kim, H. J. Mamon, P . Shyn, E. Ben-Josef, J. Seong, M. G. Haddock, J. C. Cheng et al. , “Interobserver variability in target definition for hepatocellular carcinoma with and without portal vein thrombus: radiation therapy oncology group consensus guidelines,” Radiation Oncology Biology Physics , vol. 89, no. 4, pp. 804–813, 2014. [Online]. A vailable: Source 1.1, 3 [4] J. H. Moltz, S. Braunewell, J. R ¨ uhaak, F . Heckel, S. Barbieri, L. T autz, H. K. Hahn, and H.-O. Peitgen, “Analysis of variability in manual liver tumor delineation in CT scans,” in Biomedical Imaging: From Nano to Macro, 2011 IEEE International Symposium on . IEEE, 2011, pp. 1974–1977. [Online]. A vailable: Source 1.1 [5] S. D. Olabarriaga and A. W . Smeulders, “Setting the mind for intelligent interactive segmentation: Overview , requirements, and framework,” in Biennial International Conference on Information Processing in Medical Imaging . Springer , 1997, pp. 417–422. [Online]. A vailable: Source 1.1 [6] M. Hassenzahl and N. T ractinsky , “User experience – a resear ch agenda,” Behaviour & information technology (BIT) , vol. 25, no. 2, pp. 91–97, 2006. [Online]. A vailable: Source 3 [7] E. L.-C. Law , V . Roto, M. Hassenzahl, A. P . V ermeeren, and J. Kort, “Understanding, scoping and defining user experience: a survey approach,” Human factors in computing systems (CHI) , pp. 719–728, 2009. [Online]. A vailable: Source 3 [8] T . Caro, R. Roper , M. Y oung, and G. Dank, “Inter-observer reliability ,” Behaviour , vol. 69, no. 3, pp. 303–315, 1979. [Online]. A vailable: Source 3 [9] P . Kohli, H. Nickisch, C. Rother , and C. Rhemann, “User-centric learning and evaluation of interactive segmentation systems,” Computer V ision (IJCV) , vol. 100, no. 3, pp. 261–274, 2012. [Online]. A vailable: Source 3, 1.5.2, 1 [10] L. R. Dice, “Measur es of the amount of ecologic association between species,” Ecology , vol. 26, no. 3, pp. 297–302, 1945. [Online]. A vailable: Source 3 [11] S. D. Olabarriaga and A. W . M. Smeulders, “Interaction in the segmentation of medical images: A survey ,” Medical Image Analysis (MIA) , vol. 5, no. 2, pp. 127–142, 2001. [Online]. A vailable: Source 1.3, 1.5.2, 4 [12] F . Zhao and X. Xie, “Interactive segmentation of medical images: A survey ,” in Proc. Medical Image Understanding and Analysis , 2012. [Online]. A vailable: Source 1.3 [13] C. S. Puranik and C. J. Lonigan, “Fr om scribbles to scrabble: Preschool children’s developing knowledge of written language,” Reading and writing , vol. 24, no. 5, pp. 567–589, 2011. [Online]. A vailable: Source 1.3 [14] C. Rupprecht, L. Peter , and N. Navab, “Image segmentation in twenty questions,” in Computer V ision and Pattern Recognition (CVPR) . IEEE, 2015, pp. 3314–3322. [Online]. A vailable: Source 1.3, 1 ACCEPTED AS RESEARCH AR TICLE A T THE INTERNA TIONAL JOURNAL OF BIOMEDICAL IMAGING, HIND A WI 15 [15] J. K. Udupa, L. W ei, S. Samarasekera, Y . Miki, M. A. van Buchem, and R. I. Grossman, “Multiple sclerosis lesion quantification using fuzzy-connectedness principles,” IEEE T ransactions on Medical Imaging , vol. 16, no. 5, pp. 598–609, 1997. [Online]. A vailable: Source 1.3 [16] S. D. Olabarriaga, “Human-computer interaction for the segmentation of medical images,” dissertation, Advanced School for Computing and Imaging, 1999. [Online]. A vailable: Source 1.3 [17] H. Nickisch, C. Rother , P . Kohli, and C. Rhemann, “Learning an interactive segmentation system,” in Computer V ision, Graphics and Image Processing (ICVGIP) . ACM, 2010, pp. 274–281. [Online]. A vailable: Source 1.4, 1, 2.5 [18] K. McGuinness and N. E. O’connor , “A comparative evaluation of interactive segmentation algorithms,” Pattern Recognition , vol. 43, no. 2, pp. 434–444, 2010. [Online]. A vailable: Source 1.4, 1.5.2, 4 [19] B. V an Ginneken, T . Heimann, and M. Styner , “3D segmentation in the clinic: A grand challenge,” in Medical Image Computing and Computer-Assisted Intervention (MICCAI) , 2007, pp. 7–15. [Online]. A vailable: Source 1.5.1 [20] G. Litjens, R. T oth, W . van de V en, C. Hoeks, S. Kerkstra, B. van Ginneken, G. Vincent, G. Guillard, N. Birbeck, J. Zhang et al. , “Evaluation of prostate segmentation algorithms for mri: the promise12 challenge,” Medical Image Analysis (MIA) , vol. 18, no. 2, pp. 359–373, 2014. [Online]. A vailable: Source 1.5.1 [21] F . Zhao and X. Xie, “An overview of interactive medical image segmentation,” Annals of the BMV A , vol. 2013, no. 7, pp. 1–22, 2013. [Online]. A vailable: Source 1.5.2, 5 [22] K. McGuinness and N. E. O’Connor , “T oward automated evaluation of interactive segmentation,” Computer V ision and Image Understanding , vol. 115, no. 6, pp. 868–884, 2011. [Online]. A vailable: Source 1.5.2, 4, 1 [23] M. P . Amrehn, J. Glasbrenner , S. Steidl, and A. K. Maier , “Comparative evaluation of interactive segmentation approaches,” in Bildverarbeitung f ¨ ur die Medizin (BVM) , 2016, pp. 68–73. [Online]. A vailable: Source 1.5.2 [24] W . Y ang, J. Cai, J. Zheng, and J. Luo, “User-friendly interactive image segmentation through unified combinatorial user inputs,” T ransactions on Image Processing (TIP) , vol. 19, no. 9, pp. 2470–2479, 2010. [Online]. A vailable: Source 6 [25] A. Ramkumar , P . J. Stappers, W . J. Niessen, S. Adebahr , T . Schimek-Jasch, U. Nestle, and Y . Song, “Using GOMS and NASA-TLX to evaluate human-computer interaction process in interactive segmentation,” Human–Computer Interaction (IHC) , pp. 1–12, 2016. [Online]. A vailable: Source 6, 1 [26] A. Ramkumar , J. Dolz, H. A. Kirisli, S. Adebahr , T . Schimek- Jasch, U. Nestle, L. Massoptier , E. V arga, P . J. Stappers, W . J. Niessen et al. , “User interaction in semi-automatic segmentation of organs at risk: A case study in radiotherapy ,” Journal of Digital Imaging (JDI) , vol. 29, no. 2, pp. 264–277, 2016. [Online]. A vailable: Source 6, 1, 5.1 [27] M. P . Amrehn, M. Strumia, M. Kowarschik, and A. Maier , “Interactive neural network robot user investigation for medical image segmentation,” in Bildverarbeitung f ¨ ur die Medizin (BVM) . Springer , 2019, pp. 56–61. [Online]. A vailable: Source 1, 17 [28] N. Xu, B. Price, S. Cohen, J. Y ang, and T . S. Huang, “Deep interactive object selection,” in Computer V ision and Pattern Recognition (CVPR) . IEEE, 2016, pp. 373–381. [Online]. A vailable: Source 1 [29] G. W ang, M. A. Zuluaga, W . Li, R. Pratt, P . A. Patel, M. Aertsen, T . Doel, A. L. David, J. Deprest, S. Ourselin et al. , “Deepigeos: a deep interactive geodesic framework for medical image segmentation,” T ransactions on Pattern Analysis and Machine Intelligence (TP AMI) , 2017. [Online]. A vailable: Source 1 [30] D.-J. Chen, H.-T . Chen, and L.-W . Chang, “Swipecut: Interactive segmentation with diversified seed proposals,” arXiv pr eprint arXiv:1812.07260 , 2018. [Online]. A vailable: Source 1 [31] M. P . Amrehn, M. Strumia, S. Steidl, T . Horz, M. Kowarschik, and A. Maier , “Ideal seed point location approximation for GrowCut interactive image segmentation,” in Bildverarbeitung f ¨ ur die Medizin (BVM) . Springer , 2018, pp. 210–215. [Online]. A vailable: Source 1, 9 [32] J. H. Liew , Y . W ei, W . Xiong, S.-H. Ong, and J. Feng, “Regional interactive image segmentation networks,” in Computer V ision (ICCV) . IEEE, 2017, pp. 2746–2754. [Online]. A vailable: Source 1 [33] G. W ang, W . Li, M. A. Zuluaga, R. Pratt, P . A. Patel, M. Aertsen, T . Doel, A. L. David, J. Deprest, S. Ourselin et al. , “Interactive medical image segmentation using deep learning with image-specific fine-tuning,” T ransactions on Medical Imaging (TMI) , vol. 37, no. 7, pp. 1562–1573, 2018. [Online]. A vailable: Source 1 [34] M. P . Amrehn, S. Gaube, M. Unberath, F . Schebesch, T . Horz, M. Strumia, S. Steidl, M. Kowarschik, and A. Maier , “UI-net: Interactive artificial neural networks for iterative image segmentation based on a user model,” in V isual Computing for Biology and Medicine (VCBM) , 2017, pp. 143–147. [Online]. A vailable: Source 1, 17 [35] M. P . Amrehn, S. Steidl, M. Kowarschik, and A. Maier , “Robust seed mask generation for interactive image segmentation,” in Nuclear Science Symposium and Medical Imaging Conference (NSS/MIC) . IEEE, 2017, pp. 1–3. [Online]. A vailable: Source 1 [36] B. Jiang, T . Ren, and J. Bei, “Automatic scribble simulation for interactive image segmentation evaluation,” in Multimedia Modeling (MMM) . Springer , 2016, pp. 596–608. [Online]. A vailable: Source 1 [37] D. Martin, C. Fowlkes, D. T al, and J. Malik, “A database of human segmented natural images and its application to evaluating segmentation algorithms and measuring ecological statistics,” in Computer V ision (ICCV) , vol. 2. IEEE, July 2001, pp. 416–423. [Online]. A vailable: Source 1 [38] D.-J. Chen, H.-T . Chen, and L.-W . Chang, “Interactive segmentation from 1-bit feedback,” in Computer V ision (ACCV) . Springer , 2016, pp. 261–274. [Online]. A vailable: Source 1 [39] F . Andrade and E. V . Carrera, “Supervised evaluation of seed- based interactive image segmentation algorithms,” in Signal Processing, Images and Computer V ision (STSIV A) . IEEE, 2015, pp. 1–7. [Online]. A vailable: Source 1 [40] J. Bai and X. W u, “Error -tolerant scribbles based interactive image segmentation,” in Computer V ision and Pattern Recognition (CVPR) . IEEE, 2014, pp. 392–399. [Online]. A vailable: Source 1 [41] S. D. Jain and K. Grauman, “Predicting suf ficient annotation strength for interactive foreground segmentation,” in Computer V ision (ICCV) . IEEE, 2013, pp. 1313–1320. [Online]. A vailable: Source 1 [42] J. He, C.-S. Kim, and C.-C. J. Kuo, Interactive Segmentation T echniques: Algorithms and Performance Evaluation . Springer Science & Business Media, 2013. [Online]. A vailable: Source 1 [43] Y . Zhao, X. Nie, Y . Duan, Y . Huang, and S. Luo, “A benchmark for interactive image segmentation algorithms,” in Person-Oriented V ision (POV) . IEEE, 2011, pp. 33–38. [Online]. A vailable: Source 1 [44] A. T op, G. Hamarneh, and R. Abugharbieh, “Active learning for interactive 3d image segmentation,” in Medical Image Computing and Computer-Assisted Intervention (MICCAI) . Springer , 2011, pp. 603–610. [Online]. A vailable: Source 1 [45] V . Gulshan, C. Rother , A. Criminisi, A. Blake, and A. Zisserman, “Geodesic star convexity for interactive image segmentation,” in Computer V ision and Pattern Recognition (CVPR) . IEEE, 2010, pp. 3129–3136. [Online]. A vailable: Source 1 [46] D. Batra, A. Kowdle, D. Parikh, J. Luo, and T . Chen, “icoseg: Interactive co-segmentation with intelligent scribble guidance,” in Computer V ision and Pattern Recognition (CVPR) . IEEE, 2010, pp. 3169–3176. [Online]. A vailable: Source 1 [47] J. Ning, L. Zhang, D. Zhang, and C. Wu, “Interactive image segmentation by maximal similarity based region merging,” Pattern Recognition , vol. 43, no. 2, pp. 445–456, 2010. [Online]. A vailable: Source 1 [48] B. L. Price, B. Morse, and S. Cohen, “Geodesic graph cut for interactive image segmentation,” in Computer V ision and Pattern Recognition (CVPR) . IEEE, 2010, pp. 3161–3168. [Online]. A vailable: Source 1 [49] D. Singaraju, L. Grady , and R. V idal, “P-brush: Continuous valued mrfs with normed pairwise distributions for image segmentation,” in Computer V ision and Pattern Recognition (CVPR) . IEEE, 2009, pp. 1303–1310. [Online]. A vailable: Source 1 [50] C. Rother , V . Kolmogorov , and A. Blake, “Grabcut: Interactive foregr ound extraction using iterated graph cuts,” in T ransactions on Graphics (TOG) , vol. 23, no. 3. ACM, 2004, pp. 309–314. [Online]. A vailable: Source 1, 7 [51] E. Moschidis and J. Graham, “A systematic performance evaluation of interactive image segmentation methods based on ACCEPTED AS RESEARCH AR TICLE A T THE INTERNA TIONAL JOURNAL OF BIOMEDICAL IMAGING, HIND A WI 16 simulated user interaction,” in Biomedical Imaging (ISBI) . IEEE, 2010, pp. 928–931. [Online]. A vailable: Source 1 [52] ——, “Simulation of user interaction for performance evaluation of interactive image segmentation methods,” in Medical Image Understanding and Analysis (MIUA) , 2009, pp. 209–213. [Online]. A vailable: Source 1 [53] O. Duchenne, J.-Y . Audibert, R. Keriven, J. Ponce, and F . S ´ egonne, “Segmentation by transduction,” in Computer V ision and Pattern Recognition (CVPR) . IEEE, 2008, pp. 1–8. [Online]. A vailable: Source 1 [54] A. Levin, D. Lischinski, and Y . W eiss, “A closed-form solution to natural image matting,” Pattern Analysis and Machine Intelligence , vol. 30, no. 2, pp. 228–242, 2008. [Online]. A vailable: Source 1 [55] S. V icente, V . Kolmogorov , and C. Rother , “Graph cut based image segmentation with connectivity priors,” in Computer V ision and Pattern Recognition (CVPR) . IEEE, 2008, pp. 1–8. [Online]. A vailable: Source 1 [56] A. Protiere and G. Sapiro, “Interactive image segmentation via adaptive weighted distances,” Image Processing (ICIP) , vol. 16, no. 4, pp. 1046–1057, 2007. [Online]. A vailable: Source 1 [57] Y . Boykov and G. Funka-Lea, “Graph cuts and efficient nd image segmentation,” Computer V ision (IJCV) , vol. 70, no. 2, pp. 109–131, 2006. [Online]. A vailable: Source 1 [58] L. Grady , “Random walks for image segmentation,” Pattern analysis and machine intelligence , vol. 28, no. 11, pp. 1768–1783, 2006. [Online]. A vailable: Source 1 [59] V . V ezhnevets and V . Konouchine, “GrowCut: Interactive multi- label nd image segmentation by cellular automata,” in Computer Graphics and Applications (Graphicon) , vol. 8. Citeseer , 2005, pp. 150–156. [Online]. A vailable: Source 1, 2.1, 9 [60] J. E. Cates, R. T . Whitaker , and G. M. Jones, “Case study: an evaluation of user-assisted hierarchical watershed segmentation,” Medical Image Analysis , vol. 9, no. 6, pp. 566–578, 2005. [Online]. A vailable: Source 1 [61] Y . Li, J. Sun, C.-K. T ang, and H.-Y . Shum, “Lazy snapping,” in T ransactions on Graphics (T oG) , vol. 23, no. 3. ACM, 2004, pp. 303–308. [Online]. A vailable: Source 1 [62] A. Blake, C. Rother , M. Brown, P . Perez, and P . T orr , “Interactive image segmentation using an adaptive gmmrf model,” in Computer V ision (ECCV) . Springer , 2004, pp. 428–441. [Online]. A vailable: Source 1 [63] J. W . Chung, H.-C. Kim, J.-H. Y oon, H.-S. Lee, H. J. Jae, W . Lee, and J. H. Park, “T ranscatheter arterial chemoembolization of hepatocellular carcinoma: prevalence and causative factors of extrahepatic collateral arteries in 479 patients,” Korean journal of radiology , vol. 7, no. 4, pp. 257–266, 2006. [Online]. A vailable: Source 1.6 [64] K. A. McGlynn and W . T . London, “The global epidemiology of hepatocellular carcinoma: Present and future,” Clinics in liver disease , vol. 15, no. 2, pp. 223–243, 2011. [Online]. A vailable: Source 1.6 [65] R. J. Lewandowski, J.-F . Geschwind, E. Liapi, and R. Salem, “T ranscatheter intraarterial therapies: Rationale and overview ,” Radiology , vol. 259, no. 3, pp. 641–657, 2011. [Online]. A vailable: Source 1.6 [66] J. Bruix and M. Sherman, “Management of hepatocellular carcinoma,” Hepatology , vol. 42, no. 5, pp. 1208–1236, 2005. [Online]. A vailable: Source 1.6 [67] ——, “Management of hepatocellular carcinoma: an update,” Hepatology , vol. 53, no. 3, pp. 1020–1022, 2011. [Online]. A vailable: Source 1.6 [68] N. Strobel, O. Meissner , J. Boese, T . Brunner , B. Heigl, M. Ho- heisel, G. Lauritsch, M. NaGel, M. Pfister , E.-P . R ¨ uhrnschopf et al. , “3D imaging with flat-detector C-arm systems,” Multislice CT , pp. 33–51, 2009. 1.6 [69] C.-M. Lo, H. Ngan, W .-K. T so, C.-L. Liu, C.-M. Lam, R. T .-P . Poon, S.-T . Fan, and J. W ong, “Randomized controlled trial of transarterial lipiodol chemoembolization for unresectable hepatocellular carcinoma,” Hepatology , vol. 35, no. 5, pp. 1164–1171, 2002. [Online]. A vailable: Source 1.6 [70] Y . Jin, L. M. Fayad, and A. F . Laine, “Contrast enhancement by multiscale adaptive histogram equalization,” in Optical Science and T echnology . International Society for Optics and Photonics, 2001, pp. 206–213. [Online]. A vailable: Source 16 [71] J. Brooke, “SUS – A quick and dirty usability scale,” Usability Evaluation in Industry , pp. 189–194, 1996. [Online]. A vailable: Source 2.3.1, 18, 2.5, A [72] J. R. Lewis and J. Sauro, “The factor structure of the system usability scale,” International Conference on Human Centered Design (HCD) , pp. 94–103, 2009. [Online]. A vailable: Source 2.3.1 [73] P . T . Kortum and A. Bangor , “Usability ratings for everyday products measured with the system usability scale,” International Journal of Human–Computer Interaction (IJHCI) , vol. 29, no. 2, pp. 67–76, 2013. [Online]. A vailable: Source 2.3.1 [74] ISO Central Secretary, “Ergonomic requirements for office work with visual display terminals (VDT s) – Part 11: Guidance on usability,” International Organization for Standardization (ISO), Geneva, CH, Standard ISO/TC 159/SC 4 9241-11:1998, Mar . 1998. [Online]. A vailable: Source 2.3.1 [75] ——, “Ergonomics of human-system interaction – Part 11: Usability: Definitions and concepts,” International Organization for Standardization (ISO), Geneva, CH, Standard ISO/TC 159/SC 4 9241-11:2018, Mar . 2018. [Online]. A vailable: Source 2.3.1 [76] A. Bangor , P . Kortum, and J. Miller , “Determining what individual SUS scores mean: Adding an adjective rating scale,” Journal of Usability Studies , vol. 4, no. 3, pp. 114–123, 2009. [Online]. A vailable: Source 2.3.1, 6, 20 [77] R. Likert, “A technique for the measurement of attitudes,” Archives of Psychology , vol. 22, no. 140, pp. 3—-55, 1932. [Online]. A vailable: Source 2.3.1 [78] A. Bangor , P . T . Kortum, and J. T . Miller , “An empirical evaluation of the system usability scale,” International Journal of Human–Computer Interaction (IJHCI) , vol. 24, no. 6, pp. 574–594, 2008. [Online]. A vailable: Source 20 [79] C. E. Osgood, “The nature and measurement of meaning,” Psychological bulletin , vol. 49, no. 3, pp. 197–237, 1952. [Online]. A vailable: Source 2.3.2 [80] C. E. Osgood, G. J. Suci, and P . H. T annenbaum, The Measurement of Meaning . University of Illinois Pr ess, 1957. [Online]. A vailable: Source 2.3.2 [81] A. Mehrabian and J. A. Russell, An appr oach to environmental psychology . MIT Press, 1974. [Online]. A vailable: Source 2.3.2 [82] M. Fishbein and I. Ajzen, Belief, Attitude, Intention, and Behavior: An Introduction to Theory and Research . Addison-W esley , 1975. [Online]. A vailable: Source 2.3.2 [83] M. Hassenzahl, M. Burmester , and F . Koller , “AttrakDif f: Ein Fragebogen zur Messung wahr genommener hedonischer und pragmatischer Qualit ¨ at,” in Mensch & Computer (MC) . Springer , 2003, pp. 187–196. [Online]. A vailable: Source 2.3.2, 24, 34 [84] M. Hassenzahl, A. Platz, M. Burmester , and K. Lehner , “Hedonic and ergonomic quality aspects determine a software’s appeal,” in Human Factors in Computing Systems (CHI) , ACM. SIGCHI, 2000, pp. 201–208. [Online]. A vailable: Source 2.3.2 [85] M. Hassenzahl, “The effect of perceived hedonic quality on product appealingness,” Human–Computer Interaction (IHC) , vol. 13, no. 4, pp. 481–499, 2001. [Online]. A vailable: Source 2.3.2 [86] M. Hassenzahl, M. Burmester , and F . Koller , “Der user experience (UX) auf der Spur: Zum Einsatz von www .attrakdiff.de,” User Experience Professionals Association International (UXP A) , vol. 17, pp. 78–82, 2008. [Online]. A vailable: Source 2.3.2, 25, 13 [87] M. Hassenzahl, R. Kekez, and M. Burmester , “The importance of a software’s pragmatic quality depends on usage modes,” in Proceedings of the 6th international conference on Work W ith Display Units (WWDU) . ERGONOMIC Institut f ¨ ur Arbeits-und Sozialforschung Berlin, 2002, pp. 275–276. [Online]. A vailable: Source 23 [88] S. Diefenbach and M. Hassenzahl, “Give me a reason: hedonic product choice and justification,” Human factors in computing systems (CHI) , pp. 3051–3056, 2008. [Online]. A vailable: Source 23 [89] M. Hassenzahl, “The hedonic/pragmatic model of user experience,” T owards a UX manifesto , pp. 16–20, 2007. [Online]. A vailable: Source 23 [90] J. McCroskey , “Bipolar scales,” in Measurement of communication behavior , P . Emmert and L. L. Barker , Eds. White Plains, NY : Longman Publishing Group, 1989, ch. 8, pp. 154–167. [Online]. A vailable: Source 23 [91] H.-F . Hsieh and S. E. Shannon, “Three approaches to qualitative content analysis,” Qualitative health research , vol. 15, no. 9, pp. 1277–1288, 2005. [Online]. A vailable: Source 2.4 [92] S. Elo and H. Kyng ¨ as, “The qualitative content analysis process,” Journal of advanced nursing , vol. 62, no. 1, pp. 107–115, 2008. [Online]. A vailable: Source 2.4 ACCEPTED AS RESEARCH AR TICLE A T THE INTERNA TIONAL JOURNAL OF BIOMEDICAL IMAGING, HIND A WI 17 [93] P . Mayring, Qualitative Content Analysis: Theoretical Foundation, Basic Procedures and Software Solution . GESIS, 2014. [Online]. A vailable: Source 2.4 [94] Q. Gao, Y . W ang, F . Song, Z. Li, and X. Dong, “Mental workload measurement for emergency operating procedures in digital nuclear power plants,” Ergonomics , vol. 56, no. 7, pp. 1070–1085, 2013. [Online]. A vailable: Source 2.5 [95] D. Siroker and P . Koomen, A/B T esting: The Most Powerful Way to T urn Clicks Into Customers , 1st ed. W iley Publishing, 2013. [Online]. A vailable: Source 2.5 [96] Recommendation Broadcasting service (television) BT.709-6, “Basic parameter values for the hdtv standard for the studio and for international programme exchange,” International T elecommunication Union Radiocommunication Assembly (ITU–R) , 1990. [Online]. A vailable: Source 3.1 [97] S. Hanneke, “A bound on the label complexity of agnostic active learning,” in International conference on Machine Learning (ICML) , 2007, pp. 353–360. [Online]. A vailable: Source 28 [98] B. Mandelbrot, “How long is the coast of britain? Statistical self-similarity and fractional dimension,” science , vol. 156, no. 3775, pp. 636–638, 1967. [Online]. A vailable: Source 30 [99] D. A. Norman and J. Nielsen, “Gestural interfaces: a step backward in usability ,” interactions , vol. 17, no. 5, pp. 46–49, 2010. [Online]. A vailable: Source 31 [100] J. H. Friedman, “Greedy function approximation: a gradient boosting machine,” Annals of Statistics (AOS) , pp. 1189–1232, 2001. [Online]. A vailable: Source 3.3 [101] ——, “Stochastic gradient boosting,” Computational Statistics & Data Analysis (CSDA) , vol. 38, no. 4, pp. 367–378, 2002. [Online]. A vailable: Source 3.3 [102] T . Hastie, R. Tibshirani, and J. H. Friedman, “Boosting and additive trees,” The Elements of Statistical Learning , pp. 337–387, 2009. [Online]. A vailable: Source 3.3 [103] L. Breiman, “Using adaptive bagging to debias regressions,” University of California, Berkeley , T ech. Rep., 1999. [Online]. A vailable: Source 3.3 [104] P . J. Huber , “Robust estimation of a location parameter ,” The Annals of Mathematical Statistics (AOMS) , vol. 35, no. 1, pp. 73–101, 1964. [Online]. A vailable: Source 3.3 [105] W . Heron, “Perception as a function of retinal locus and attention,” The American Journal of Psychology , vol. 70, no. 1, pp. 38–48, 1957. [Online]. A vailable: Source 5.1 [106] P . Jaccard, “The distribution of the flora in the alpine zone.” New Phytologist , vol. 11, no. 2, pp. 37–50, 1912. [Online]. A vailable: Source 5.2 A P P E N D I X E X A M P L E F O R S U S E VA L UAT I O N ( E Q . 5 ) The result of the SUS survey is a single scalar value, in the range of zero to 100 as a composite measure of the overall usability . The score is computed according to Eq. 5, as outlined in [71], given S participants, where x SUS s,i is the response to the statement i by subject s . sus ( x ) = 2 . 5 S ∑ s ∑ odd i x SUS s,i + ∑ even i ( 4 − x SUS s,i ) Let S = 3 participants answer the 10 questions (listed in Sec. 2.3.1) of the SUS questionnair e as follows: x SUS = x SUS 0 x SUS 1 x SUS 2 = 0 1 2 3 4 0 1 2 3 4 1 2 3 4 0 1 2 3 4 0 2 3 4 0 1 2 3 4 0 1 , where x SUS s are rows in matrix x SUS . Then: sus ( x ) = 2 . 5 3 ⋅ (( 0 + 3 + 2 + 1 + 4 + 4 + 1 + 2 + 3 + 0 ) + ( 1 + 2 + 3 + 0 + 0 + 3 + 2 + 1 + 4 + 4 ) + ( 2 + 1 + 4 + 4 + 1 + 2 + 3 + 0 + 0 + 3 )) In this case, sus ( x ) = 50 . Note that the factor 2 . 5 in Eq. 5 normalizes the SUS score to a value 0 ≤ sus ( . ) ≤ 100 . E X A M P L E F O R A T T R A K D I FF E VA L U A T I O N ( E Q . 6 ) For the questionnaire’s evaluation for subject s ∈ { 0 , 1 , . . . , S − 1 } , each of the seven adjective pairs i ∈ { 0 , 1 , . . . , 6 } per group g ∈ { PQ , A TT , HQ-I , HQ-S } is assigned a score x g s,i ∈ { 1 , 2 , . . . , 7 } by each participant, reflecting their tendency towar ds the positive of the two adjectives. The overall ratings per group are defined in [83] as the mean scores computed over all subjects s and statements i , as depicted in Eq. 6. Here, S is the number of participants in the survey . attrakdiff ( x , g ) = 1 7 ⋅ S ∑ s ∑ i x g s,i Let S = 3 participants fill in the 28 choices (listed in T ab. 2) of the AttrakDiff-2 questionnaire as follows, where x g s are rows in matrix x g : Group PQ: x PQ = x PQ 0 x PQ 1 x PQ 2 = 1 2 3 4 5 6 7 2 3 4 5 6 7 7 3 4 5 6 7 7 7 Group A TT : x A TT = x A TT 0 x A TT 1 x A TT 2 = 2 3 4 5 6 7 7 3 4 5 6 7 7 7 4 5 6 7 7 7 7 Group HQ-I: x HQ-I = x HQ-I 0 x HQ-I 1 x HQ-I 2 = 3 4 5 6 7 7 7 4 5 6 7 7 7 7 5 6 7 7 7 7 7 Group HQ-S: x HQ-S = x HQ-S 0 x HQ-S 1 x HQ-S 2 = 4 5 6 7 7 7 7 5 6 7 7 7 7 7 6 7 7 7 7 7 7 After evaluation via Eq. 6: attrakdiff ( x , PQ ) = (( 1 + 2 + 3 + 4 + 5 + 6 + 7 ) + ( 2 + 3 + 4 + 5 + 6 + 2 ⋅ 7 ) + ( 3 + 4 + 5 + 6 + 3 ⋅ 7 )) / 21 attrakdiff ( x , A TT ) = (( 2 + 3 + 4 + 5 + 6 + 2 ⋅ 7 ) + ( 3 + 4 + 5 + 6 + 3 ⋅ 7 ) + ( 4 + 5 + 6 + 4 ⋅ 7 )) / 21 attrakdiff ( x , HQ-I ) = (( 3 + 4 + 5 + 6 + 3 ⋅ 7 ) + ( 4 + 5 + 6 + 4 ⋅ 7 ) + ( 5 + 6 + 5 ⋅ 7 )) / 21 attrakdiff ( x , HQ-S ) = (( 4 + 5 + 6 + 4 ⋅ 7 ) + ( 5 + 6 + 5 ⋅ 7 ) + ( 6 + 6 ⋅ 7 )) / 21 ACCEPTED AS RESEARCH AR TICLE A T THE INTERNA TIONAL JOURNAL OF BIOMEDICAL IMAGING, HIND A WI 18 In this case, attrakdiff ( x , PQ ) = 4 . 81 , attrakdiff ( x , A TT ) = 5 . 52 , attrakdiff ( x , HQ-I ) = 6 . 10 , and attrakdiff ( x , HQ-S ) = 6 . 52 . The confidence intervals conf ( . ) can then be extracted via the percent point function ppf ( . ) (also called quantile func- tion or inverse cumulative distribution function) for the selected 95 % confidence interval. z = ppf ( 0 . 95 ⋅ 0 . 5 ) = 1 . 95996 conf ( x , g ) = mean ( x g ) ± z ⋅ std ( x g ) 7 ⋅ S Note that mean ( . ) and std ( . ) flatten the input matrix to a vector first, such that mean and standard deviation are computed from a list of values and the outcome is one scalar value per function. The confidence intervals for the example data are conf ( x , PQ ) = 4 . 81 ± 0 . 81 , conf ( x , A TT ) = 5 . 52 ± 0 . 68 , conf ( x , HQ-I ) = 6 . 10 ± 0 . 53 , and conf ( x , HQ-S ) = 6 . 52 ± 0 . 36 .
Original Paper
Loading high-quality paper...
Comments & Academic Discussion
Loading comments...
Leave a Comment