Game-theoretic modeling of curtailment rules and network investments with distributed generation
Renewable energy has achieved high penetration rates in many areas, leading to curtailment, especially if existing network infrastructure is insufficient and energy generated cannot be exported. In this context, Distribution Network Operators (DNOs) …
Authors: Merlinda Andoni, Valentin Robu, Wolf-Gerrit Fruh
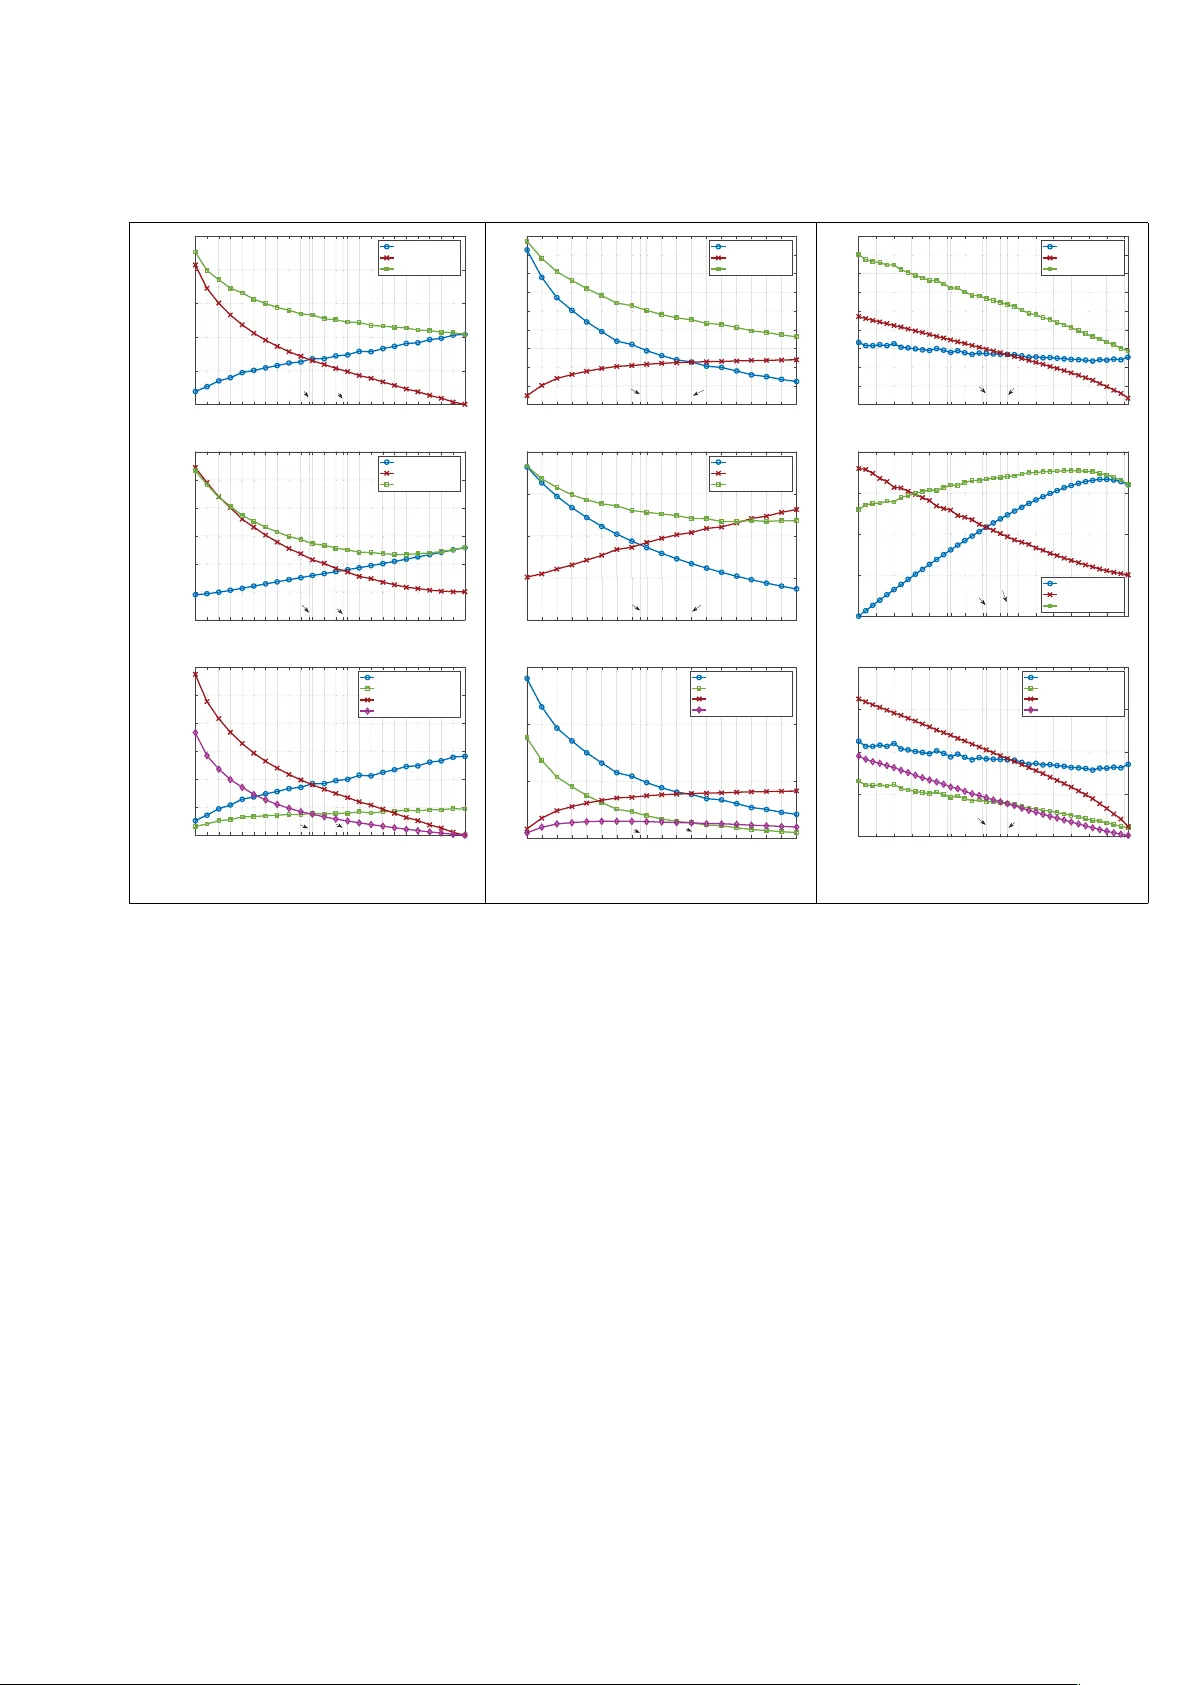
Game-theoretic modeling of curtailment rules and network in vestments with distrib uted generation I Merlinda Andoni a, ∗ , V alentin Robu a , W olf-Gerrit Fr ¨ uh b , David Flynn a a Institute of Sensors, Signals and Systems, Heriot-W att University , Edinbur gh, UK b Mechanical, Pr ocess and Energy Engineering, Heriot-W att University , Edinbur gh, UK Abstract Renew able energy has achie ved high penetration rates in many areas, leading to curtailment, especially if existing network infrastructure is insu ffi cient and energy generated cannot be exported. In this context, Distribution Network Operators (DNOs) face a significant kno wledge gap about ho w to implement curtailment rules that achie v e desired operational objecti ves, b ut at the same time minimise disruption and economic losses for renewable generators. In this work, we study the properties of sev eral curtailment rules widely used in UK renewable energy projects, and their e ff ect on the viability of renewable generation inv estment. Moreover , we propose a ne w curtailment rule which guarantees f air allocation of curtailment amongst all generators with minimal disruption. Another k ey knowledge gap faced by DNOs is ho w to incenti vise priv ate network upgrades, especially in settings where se v eral generators can use the same line against the payment of a transmission fee. In this work, we provide a solution to this problem by using tools from algorithmic game theory . Specifically , this setting can be modelled as a Stackelberg game between the priv ate transmission line in v estor and local rene wable generators, who are required to pay a transmission fee to access the line. W e provide a method for computing the equilibrium of this game, using a model that captures the stochastic nature of renewable energy generation and demand. Finally , we use the practical setting of a grid reinforcement project from the UK and a lar ge dataset of wind speed measurements and demand to validate our model. W e sho w that charging a transmission fee as a proportion of the feed-in tari ff price between 15%-75% would allo w both in vestors to implement their projects and achie v e desirable distribution of the profit. Overall, our results show ho w using game- theoretic tools can help netw ork operators to bridge the kno wledge gap about setting the optimal curtailment rule and determining transmission charges for pri v ate network infrastructure. K e ywor ds: Curtailment, network upgrade, Principles of Access, wind ener gy, leader-follo wer (Stack elberg) game 1. Introduction Renew able energy is crucial for achie ving our decarbonisation goals and mitigating climate change. The Paris Agreement charts a new course of international e ff ort to combat climate change with 195 countries agreeing to keep av erage global temperature rise well below 2 o C above pre-industrial lev els and 129 countries ratifying so far . Dri ven by national and global initiativ es, financial incentives and technological adv ances ha ve permitted lar ge volumes of renew able energy sources (RES) to be connected to the electricity grid. In 2015, 147 GW of new renew able genera- tion capacity was added globally , including 50 GW of ne w solar PV and 63 GW of wind power capacity , with total in v estment reaching an estimate of $285.9 billion [3]. The le velised cost of energy (LCOE) for se veral RES technolo- gies, such as onshore wind or lar ge scale PV , is currently competitiv e with con ventional generation [4]. Renewable generation can provide benefits to network operators and consumers, but when installed with high penetration level, I This paper builds on significant extensions, both in theoretical results and new datasets, of preliminary work presented at two international conferences: AAMAS 2016 [1] and IEEE ISGT Europe 2016 [2]. ∗ School of Engineering and Physical Sciences, Earl Mountbatten Building 3.31, Gait 2, Heriot-W att Univ ersity , EH14 4AS Edinburgh, UK Email addr esses: ma146@hw.ac.uk (Merlinda Andoni ), v.robu@hw.ac.uk (V alentin Robu), w.g.fruh@hw.ac.uk (W olf-Gerrit Fr ¨ uh), d.flynn@hw.ac.uk (David Flynn) Pr eprint submitted to Applied Ener gy August 28, 2019 it might have negati ve e ff ects on the operation, resilience and safety of the electricity grid. RES are intermittent and hav e v ariable power outputs due to constantly changing primary resources and weather patterns, which are di ffi cult to predict. The challenges faced by netw ork operators relate to rev erse po wer flows, increased po wer losses, harmonics, voltage fluctuations, thermal capacity of equipment, frequenc y and v oltage regulation and can compromise the system reliability [5]. An additional barrier is that grid infrastructure is inadequate to support continuous RES de velopment or distributed generation (DG), especially in the area of distribution netw orks. Often high in vestment tak es place in remote areas of the grid, where projects face fav ourable resource conditions and planning approv al. T ypically , in the UK, such areas are windy islands or peninsulas with limited or saturated connection to the main grid, f acing network constraints, such as voltage, frequency or fault level violations in the absence of a netw ork upgrade. Examples include the Shetland and Orkney archipelagos and the Kintyre peninsula, used as a case study to v alidate the model de veloped in this w ork. As RES penetration increases, electricity grids require fle xible services, which ensure safe operation and power system stability , such as forecasting techniques for RES output prediction, demand response, energy storage and generation curtailment. Most measures can be expensi v e, such as storage, technically challenging, or not yet mature enough for commercialisation. Hence, in light of the aforementioned barriers, the network places heavy dependence on curtailment at the present time. Generation curtailment occurs when the excess energy that could ha ve been produced by RES generators is wasted, as it cannot be absorbed by the power system and it cannot be transported elsewhere. In several countries including the UK, generators are compensated for lost revenues, but this results in higher system operation costs which are ev entually passed on to end-consumer electricity prices. As more RES continue to be deployed, this practice cannot be sustainable and cost-e ff ectiv e, therefore smart solutions are required for further RES inte gration. The two main techniques explored by network operators are Dynamic Line Rating (DLR) and Acti ve Netw ork Management (ANM). DLR uses rating technology and instrumentation to monitor the thermal state of the lines in real time and may improve the estimated capacity between 30% to 100% [6, 7]. ANM is the automatic control of the power system by means of control devices and measurements that allow real time operation and optimal po wer flows. DLR and ANM can be combined to provide greater benefits in terms of curtailment reduction [8]. From the DNO perspective, both techniques imply controlling DG power outputs, hence innov ati ve commercial agreements between generators and the system operator are required. Generators are o ff ered interruptible, ‘non-firm’ connections to the grid, along with a set of rules about the order the y are dispatched or curtailed, as opposed to traditional ‘firm’ connections, a solution preferred in many occasions to av oid high costs or enduring a long wait before getting connected [9]. These terms and conditions are kno wn as ‘Principles of Access’ (PoA) and are the focus of this work. Such schemes have been supported by the UK Go vernment through funding mechanisms encouraging DNOs to facilitate rene wable connections [10]. The PoA options chosen by DNOs follow di ff erent approaches and each rule has both advantages and disadvan- tages in achieving desired objectives, such as cost-e ff ectiveness, economic e ffi ciency and social optimality [8]. A revie w on di ff erent rules is provided in Section 3 and related research works and discussion in Section 2. DNOs face the kno wledge gap of implementing those curtailment rules that achiev e greater benefits for all parties in v olved (RES generators and system operator). Howe ver , few works focus on the impact of di ff erent rules on the profitability of RES generators, crucially also a ff ecting the in vestors’ decision-making on future generation expansion. Our work studies the e ff ects of di ff erent rules on the viability of RES dev elopments. In particular , we provide results based on simulation analysis that sho w ho w several rules can decrease the capacity f actor (CF) of di ff erent wind generators and how correlated wind speed resources a ff ect the resulting curtailment. The main rules found in the literature or applied in practical settings follow either a Last-in-first-out (LIFO) or a Pro Rata approach. LIFO is easily implemented and does not a ff ect e xisting generators, but might discourage further RES in vestment. On the other hand, Pro Rata shares curtailment and re venue losses equally amongst all generators, who face frequent disruption e very time curtailment is required. Note here that the f airness property plays a key role in maximising the renewable generation capacity built [1] and can lead to higher network utilisation [11]. Inspired by simultaneously satisfying objectiv es such as fairness, not discouraging future RES de velopment and minimising disruption, we propose a new ‘fair’ rule which reduces the curtailment ev ents per generator and guarantees approximately equal share of curtailment to generators of unequal rated capacity . While smart solutions can defer network in vestment, the implications of curtailment e xtend to ine ffi cient energy management and renew able utilisation, potential economic losses for RES generators, wasted energy and increased 2 operation and balancing costs. Future adoption of electric vehicles (EVs) [12, 13, 14] and battery energy storage systems could be used to store excess RES generation and reduce curtailment. A long term sustainable solution to facilitate low-carbon technologies is netw ork upgrade, such as reinforcing or b uilding new transmission / distribution infrastructure. Grid e xpansion is a capital intensiv e in vestment, traditionally performed by system operators and heav- ily subsidised or supported by public funds. According to [15], the USA grid capacity inv estment would require an estimated $100 billion per year , between 2010 and 2030, with a minimum of $60 billion related only to the integration of RES. In the UK, an estimated £34 billion of inv estment in electricity networks could be required from 2014-2020, to accommodate new onshore and o ff shore projects [16]. Deregulated electricity markets and RES integration enable priv ate in vestors participation in network in vestments. This market behaviour can be desirable from a public polic y standpoint but it raises the question for system operators of defining the framework within which these pri v ate lines are incenti vised, built and accessed by competing generators. Currently , DG inv estors bear a part of the costs required for their integration. In general the connection costs may vary , but usually include the full cost for the grid capacity installed for o wn use and a proportion of the costs for shared capacity with other customers, in the case of a net- work upgrade [17]. The remaining costs are recovered by the system charges borne by all grid users, representing approximately 18% of the av erage electricity bill of a typical UK household [18]. Moreov er , current practices may lead to ine ffi cient solutions in real-world settings, such as the problem of rein- forcing transmission / distribution lines in outlying regions of Scotland, such as in the Kintyre peninsula, an area that has attracted major RES in vestment and is used as a case study in this paper . The scheme providing grid access to the RES generators in this area followed a ‘single access’ principle, i.e. priv ate lines for sole-use that were su ffi cient to accommodate only the RES capacity of each project. This practice resulted in the unintended e ff ect of no less than three lines being connected or under construction in the same area. It is clear that current solutions are far from being optimal in terms of network use and economic e ffi ciency . In similar settings, it is possible for system operators to encourage RES generators to install larger capacity power lines under a ‘common access’ principle, where a pri v ate inv estor is granted a license to build a line that permits access to smaller generators, who are subject to transmission charges. In these settings, curtailment and line access rules can play a significant role in the resulting strategic e xpansion. W e use tools from algorithmic game theory to model this comple x interplay and help DNOs or the system regulator to optimally determine the transmission charges that enable priv ate infrastructure be installed and help the process of building e ffi cient and resilient networks. In the recent years, game-theoretic tools hav e gained increased popularity within the Ener gy and Po wer System community . W e provide relev ant works using hierarchical games in the context of network upgrade settings in more detail in Section 2. While other works ha ve studied transmission constraints and congestion, to the best of our knowledge this work is one of the first to study the e ff ect of commercial agreements and curtailment rules in settings of priv ate grid reinforcement. Our w ork provides a nov el formulation in modeling priv ate in vestment in power network infrastructure required to further integrate rene w able generation. W e show ho w di ff erent curtailment rules a ff ect in vestors’ decision making about additional generation and transmission capacity , providing a useful tool to network operators seeking to incentivise sustainable and lo w-carbon technologies. In more detail, the main contributions of our work to the existing state-of-the-art are: • W e provide a study for three curtailment rules and sho w simulation analysis results about their impact on the capacity factor of wind generators. W e also study the e ff ect of spatial wind speed correlation to the resulting curtailment and lost revenues. The results pro vide useful insights to DNOs searching to implement DG smart connections and optimal curtailment rules. A new curtailment strategy is proposed, which is f air and causes minimal disruption. • This work develops a game-theoretical model which enables network operators to bridge the knowledge gap of incenti vising pri v ately de veloped grid infrastructure, especially in settings where multiple generators can share access through the same transmission line, and determining suitable transmission char ges. The network upgrade, under a ‘common access’ principle and a fair curtailment rule, is modelled as a Stac kelber g game [19] between the line in vestor and local generators. Stackelberg equilibria are classified as solutions to sequential hierarchical problems where a dominant player (here the line in vestor) has the market power to impose their strategies to smaller players (local generators) and influence the price equilibrium. The equilibrium of the emerging game determines the optimal generation capacity installed and resulting profits for both players under varying cost parameters. A feasible range of the transmission fee is identified allo wing both transmission and generation capacity in v estments be profitable. 3 • Finally , the theoretical analysis is applied to a real network upgrade problem in the UK. The datasets used include real wind speed measurements and demand data that span over the course of 17 years. This case study analysis demonstrates how real data can be utilised to search and identify the equilibrium of the game with an empirical approach, that allows capturing the stoc hastic nature of wind generation and v arying demand. The remainder of the paper is organised as follo ws: Section 2 revie ws relev ant literature, Section 3 presents most important PoAs and proposes a new curtailment rule, Section 4 presents the network upgrade model, Section 5 analyses a practical case study , Section 6 discusses our main findings and Section 7 concludes this work. 2. Related work The literature re view presented refers to related work about curtailment rules and smart solutions, network e xpan- sion and the use of game theory in the energy field. 2.1. Literatur e re view on curtailment rules The rules for curtailment are specified in the legally binding agreement between the RES generator and the sys- tem operator . An extensi v e revie w of di ff erent rules can be found in [17, 20]. A number of commercial and aca- demic studies [9, 11, 20, 21, 22] hav e discussed issues around the application of these strategies, with main focus on their technical, legal and regulatory implications. Howe ver , fe w research works hav e focused on their e ff ects on the profitability of RES generators. Along with other financial incentives provided to renew ables, such as the le vel of feed-in-tari ff prices, the curtailment rule selected in PoAs and the curtailment lev el are k ey factors a ff ecting the in v estors decision-making on future projects. Our work focuses on the impact of di ff erent rules on the viability of RES in v estment and the decision-making of in vestors about future generation e xpansion. Anaya & Pollitt [17] pro vided a cost-benefit analysis which compares traditional connections with netw ork up- grade to smart interruptible connections. Their results are based on static assumptions of the generation mix and curtailment lev els. The results from our work are based on hourly RES resources and demand. The main threads found in the literature are Last-in-first-out rules which do not a ff ect existing generation, Pro Rata rules that share curtailment equally amongst all generators, or Market-based rules that require the establishment of a curtailment market. These rules were discussed in [8] in terms of risk allocation and social optimality , rather than their e ff ect on the viability of RES in v estments, which is the focus of our work. Similar to [20], our work takes a direct approach in quantifying the e ff ects of most commonly used PoAs to the capacity factor of wind generators by a simulation analysis. In addition, our work demonstrates ho w wind speed spatial correlation a ff ects the resulting curtailment and ho w di ff erent PoAs a ff ect the frequenc y of curtailment e vents, providing useful insights to DNOs regarding the most e ffi cient strategy . Correlation should not be ignored as most generators responsible for a particular grid constraint have geographical proximity and therefore correlated power outputs, resulting in a greater impact of the resulting curtailment. Finally , this work extends pre vious work by pro viding a model that captures the stochastic nature of renew able resources and variation in demand, as opposed to the a v erage analysis approach presented in [1, 2]. 2.2. Revie w of game theory and artificial intelligence tec hniques applied to Ener gy Systems In the context of dere gulated electricity mark et, se v eral authors have argued that transmission planning techniques need to adopt optimisation [23] and strategic modelling of market participants [24], as opposed to ‘rules of thumb’ approaches driv en by human management e xperience, traditionally performed by utility companies in the past [25]. These techniques include mathematical optimisation techniques or game theory models. Significant factors to tak e into account include uncertainties introduced by distrib uted resources and rene wable generation, requiring increased network upgrade in vestment and decreasing network assets utilisation. Many works focus on planning expansion techniques incorporating multi-objecti v e optimisation, such as in [26, 27] focusing on distribution expansion and in [28] where the optimisation criteria considered were the in v estment and congestion costs, and the system’ s reliability . Akbari et al. [29] provided a stochastic short term transmission planning model based in Monte Carlo simulations, while Zeng et al. [30] considered a multi-le v el optimisation approach for activ e distribution system planning with renew able energy harvesting, taking into consideration reinforcement and opera- tional constraints. In [31, 32], the authors studied distrib uted generation expansion planning with game theory and 4 probabilistic modelling with strate gic interactions, respectively . Other works consider an integrated model for both generation and transmission capacity [33, 34] or in [35] where the e ff ect of generation capacity on transmission plan- ning was examined. Multi-objectiv e optimisation techniques were utilised for the integration of renew able energy sources in order to achiev e optimal design of rene wable systems at a microgrid level [36] or stand-alone systems using particle swarm optimisation [37] with focus on the system’ s reliability [38]. Sev eral works ha ve discussed pri v ate in vestment in the field of grid infrastructure. Contreras et al. [39] introduced an incentive scheme based on the Shapley value to encourage priv ate transmission in vestment. Maurovich-Horv at et al. [40] compared two alternate market structures for grid upgrades (either by system operators or private in vestors) and showed that they can lead to di ff erent optimal results. Howe ver , their work was focused on using Mathemat- ical Programming with Equilibrium Constraints (MPEC) to solve po wer flows and curtailment strategies were not considered. Perrault & Boutilier [41] used coalition formation to coordinate pri v ately dev eloped grid infrastructure in v estments with the aim to reduce ine ffi ciencies and transmission losses. The main focus of their work w as the group formation and its e ff ects on configurations of multiple-location settings, not the e ff ects of line access rules and smart solutions which forms the scope of this work. Joskow and T irole [42] analysed a two-node netw ork market behaviour , for settings of players with di ff erent market power and allocation of transmission rights at congested areas of the power network. Our work follo ws a di ff erent approach, since we specify our analysis on the transmission access rules and curtailment imposed. Grid e xpansion in a national le vel was studied in [43] as a three-stage hierarchical Nash game. Stackelber g games have been used in several works for transmission upgrade. These works considered economic analysis with social welfare [44], Locational Marginal Pricing [45] or highlight the uncertainties of RES generation [46]. Recent work in the renew able ener gy domain used Stack elberg game analysis to study ener gy trading among microgrids [47, 48]. In recent years sev eral researchers have begun to show the benefits of game-theoretic, multi-agent modelling and artificial intelligence (AI) techniques applied to po wer markets, including for integration of distributed, intermittent renew able generations resources. One such prominent example in the multi-agent and AI community was PowerT ac [49]. Baghaee et al. [50, 51, 52] used artificial neural networks to model probabilistic po wer flo ws in microgrids with increased RES penetration. Game-theoretical analysis was utilised in smart grid settings with demand-side manage- ment [53, 54, 55, 56], V irtual Po wer Plants [57, 58, 59] and cost-sharing of generation and transmission capacity [41]. Both non-cooperati ve [60] and cooperative [61] game theoretical models were used to clear deregulated electricity markets or were used to model the operation of microgrids [62]. Min et al. [63] defined the generators’ strategies by Nash equilibria. W u et al. [64] discussed coalition formation and profit allocation of RES generators within a distributed energy network comprised of controllable demand. Zheng et al. [65] proposed a nov el, cro wdsourced funding model for renewable ener gy in vestments, using a sequential game-theoretic approach. Ho wev er , the issue of inv esting in transmission / distribution assets was not considered. Game theory techniques for distribution network tari ff s determination were discussed in [66] with the objectiv e of maximising social welfare. Finally , this paper extends our previous work initiated in [1, 2], in such way that stochastic renewable generation and varying demand are captured in the equilibrium results. 3. Fractional Round Robin as a new curtailment rule In this section we elaborate on the most widely used curtailment rules found in the literature or applied in commer- cial schemes. W e also propose a new curtailment rule and demonstrate its advantages through a simulation process ov er the course of one year . 3.1. Principles of Access While a larger number of curtailment rules is summarised and revie wed in T able 1, in this work we focus our attention on three main schemes, which are mainly applied in commercial projects in the UK and other countries: • LIFO: Last-In-First-Out rule curtails first the generator that was connected last in the ANM scheme. Early connections hav e a clear market adv antage. The LIFO rule was selected by Scottish and Southern Energy (SSE) in two occasions as being transparent, simple to implement and not a ff ecting existing generators. The first 5 Principle of Access / Curtailment order Advantages Disadvantages LIFO: Last generator Simple configuration Not equitable No impact on existing connections Not fav ourable to RES generators Easily computable capacity factor Ine ffi cient use of distribution network Consistent and transparent Generation capacity disincentivisation Rota: Rotationally Smaller capacity factor reduction with increased units Greater impact for small-sized generators Pro Rata: According to rated capacity or power output Equitable Unknown long term impacts on capacity f actor Compliant with existing rules and standards Increased curtailment for additional units Enhances competitiv eness Possible need cap generation connected Market Based: Bidding for grid access or curtailment Sustainable and future proof Necessity of market de velopment No impact on existing connections More suitable for transmission than distribution networks Enhances competitiv eness Greatest Carbon Benefit: Larger CO2 emissions generator Easy technical implementation Commercial implications Not easy to determine carbon footprint Needs regulatory changes Generator Size: Larger generator Quick remov al of constraint Possible discouragement of large generators T echnical Best: Most technically suitable DNO Encouragement for grid reinforcement Location dependable Most con venient: Most likely to respond Simple method Discrimination on operator preference, size and location Not fair , not transparent T able 1: Main features of common curtailment strategies: [9] provided an assessment of di ff erent PoAs for interruptible contracts with respect to di ff erent criteria and stakeholders, [21] identified a range of di ff erent criteria for assessing the most suitable PoA for ANMs, [22] focused on technical challenges caused by increased wind penetration and [67] pro vided a comprehensiv e re view on PoAs quality assessment for ANM settings practical example w as the ‘Orkne y Smart Grid’ scheme 1 with a capability of controlling po wer flo ws within a time period of a fe w seconds. In this occasion, each generator is connected to a local ANM controller , which recei v es a power output set point from the central controller . The ANM scheme cost £500k to install, significantly lower than the £30m estimated cost of upgrading the grid infrastructure, and allowed 20 MW additional capacity . The second example was the ‘Northern Isles Ne w Energy Solution (NINES)’ project 2 which combined smart grid technologies, storage heating and demand side management. • Rota: Generators are curtailed on a rotational basis or at a predetermined rota specified by the system operator . An early example of the Rota rule applied in a practical setting in the United States by Xcel Energy can be found in [68]. • Pr o Rata or Shar ed P er centage: Curtailment is shared equally between all non-firm generators proportionally to the rated capacity or actual po wer output of the generators. Pro Rata was chosen by UK Power Networks for their 3-year ‘Fle xible Plug and Play’ pilot project 3 which o ff ered feasible connections to 50 MW of distrib uted generation, as it permits larger v olumes of generation being connected and enhances network utilisation [69]. The curtailment rules have v arious e ff ects on generators, system operators and consumers. As imposed curtailment reduces the energy produced by generators, it causes a capacity factor (CF) below the possible CF given the resource alone and lost revenues. Financial implications hav e the potential to discourage, in the long term, the generation capacity in v estment at the location where ANM is applied which leads to ine ffi cient use of network resources. The LIFO scheme discriminates according to the order of connection, which might disincenti vise future renewable dev elopment and makes ine ffi cient use of the transmission capacity av ailable. The Rota scheme is a simple approach which does not tak e into account the size of the generator or its actual contribution to the network constraint. This results in disproportionate losses of revenue, especially to smaller sized generators. Finally , Pro Rata shares curtail- ment equally and is fair , howe ver all participating generators are curtailed at all times when curtailment is required, leading to increased disruption. Pro Rata might not al ways be desirable (technically speaking, it may require modified pitch-controlled wind turbines, such that their output can be adjusted as needed, which may be more expensiv e), as in sev eral occasions, it is technically preferable to curtail a lar ger amount of power from one generator than smaller amounts from all generators at a single event. Moreover , ‘fairness’ is significant as fair schemes maximise the gener- ation capacity built at a single location [1]. 1 https://www.ssepd.co.uk/OrkneySmartGrid/ 2 https://www.ssepd.co.uk/NINES/ 3 http://innovation.ukpowernetworks.co.uk/innovation/en/Projects/tier- 2- projects/Flexible- Plug- and- Play- (FPP) 6 For the above reasons, we propose an equiv alent Rota-type strategy with ‘f airness’ properties, a strate gy called F ractional Round Robin (FRR). W ith FRR, the power curtailed is distributed sequentially on a rotation basis, accord- ing to the number of rated capacity units installed, so that larger generators are chosen proportionally more times, in direct relation to their size. The benefits of this approach are better explained with an illustrative example presented in the next section. 3.2. Illustrative e xample network T o illustrate the e ff ects and operation of the most important curtailment schemes, we consider a simplified example network of three wind generators of P N 1 = 7 MW, P N 2 = 2 MW and P N 3 = 3 MW rated capacity , where the subscript denotes the chronological order of their connection to the power grid. For simplicity , we assume there is no export capability and the demand is constant and equal to P D , t = 6 MW , ∀ t . For a giv en time interval t , if all generators are producing their nominal output power , a total of P C , t = 6 MW needs to be curtailed. The allocation of curtailment to the generators depends on the scheme selected: • W ith LIFO, the third and second generator are completely curtailed and the first is curtailed by 1 MW. • When Rota is implemented, the generators tak e turns, resulting here in 6 MW curtailed by the first generator , while others are not a ff ected. In the next curtailment ev ent, the second generator is curtailed, b ut as required curtailment is not su ffi cient, the third generator is also completely curtailed and 1 MW is curtailed by the first generator . In the next e v ent, the second generator is first to be curtailed and so on. • By contrast, with Pro Rata the allowed export is allocated proportionally to the generator’ s output, resulting in 3 . 5 MW, 1 MW and 1 . 5 MW curtailed power , respectiv ely . • W ith FRR, 6 MW will be curtailed by the first generator . The generator will still be the first in the order of curtailment in future e vents, up until a quota equal to its rated capacity is reached. Therefore, the next time curtailment is required, 1 MW will be curtailed by the first generator and the remaining 5 MW will be curtailed by the second and third generator . This means that on av erage, e very 12 times a curtailment of 6 MW is needed, the first generator will be curtailed 7 times, the second 2 times and the third 3 times. T o further elaborate on the e ff ects of the rules we perform a simulation process showing the impact on the CF of the wind generators. 3.3. Simulation pr ocess W e implement a simulation process in the course of one year , to compute the capacity factors of the wind gen- erators in the network considered in Section 3.2, b ut under di ff erent schemes. Since netw ork constraints are usually applicable to a particular geographical area of the grid where wind conditions may be similar , the po wer output of the generators presents a lev el of spatial correlation, which is significant for the required curtailment le vel at this area. T o model correlation, we apply the technique developed by Fr ¨ uh [70]. First of all, we generate 8760 data points of wind speed u rand , i for i = 1 ... 3 generators, from three r andom and independent samples of a W eib ull distrib ution (one for each generator), using typical UK values of c = 9 m / s and k = 1 . 8. W eibull distributions are often used to represent wind speed distributions [71, 72]. W e set the wind speed at the first generator’ s location as a reference u Re f and we produce random, yet cross-correlated wind data series u i at each generator’ s location, by the following equations: u i ( t ) = c r · u Re f ( t ) + (1 − c r ) · u rand , i ( t ) (1) c r = 1 π · arccos(1 − 2 r ) (2) where r is the Pearson’ s correlation coe ffi cient. The data series are then conv erted to power outputs, using a generic model of a wind turbine. If the aggregate power at time t exceeds the power demanded, then curtailment is required, which is allocated to the generators according to the strategy imposed. Fig. 1a shows the CF results for each generator under the four di ff erent schemes for conditions of perfect corre- lation ( r = 1). LIFO clearly fav ours ‘early’ connections, while the third generator su ff ers a reduction of 67.4%. As shown, Rota can disadv antage smaller-sized generators. On the contrary , Pro Rata produces equal CF reduction for all generators, while FRR produces similar results to Pro Rata, as expected. A measure of the fairness of a particular strategy is the variance of the capacity factors for the participating stations, σ 2 ( C F i ) where C F i is the capacity factor 7 Generators 1 2 3 Capacity factor (%) 0 5 10 15 20 25 30 35 LIFO Rota Pro Rata FRR (a) Average number of curtailment events 1600 1800 2000 2200 2400 2600 2800 Average CF variance 0 10 20 30 40 50 60 70 80 90 LIFO Rota Pro Rata FRR (b) Pearson coefficient r 0 0.1 0.2 0.3 0.4 0.5 0.6 0.7 0.8 0.9 1 Average CF (%) 18 20 22 24 26 28 30 32 LIFO Rota Pro Rata FRR (c) Figure 1: Curtailment e ff ect on the (a) CF of wind generators, (b) fairness represented by the average CF variance and (c) correlation e ff ects on av erage CF under LIFO, Rota, Pro Rata and FRR for generator i . W e illustrate this v ariance with the average number of curtailment ev ents required per generator for the example of r = 1 in Fig. 1b. LIFO presents a poor performance with respect to fairness, as opposed to Pro Rata, which requires the largest number of curtailment ev ents. Rota is fairer than LIFO, b ut still presents unequal treatment of generators, and requires the smallest number of curtailment ev ents compared to all schemes. FRR can present similar fairness properties to Pro Rata, while reducing significantly the number of curtailment ev ents per generator . Finally , as shown in Fig.1c, the required total curtailment increases, as we proceed from no correlation to perfect correlation among the generators, resulting in lower CFs. Summarising, FRR is a fair strategy which minimises disruption. Moreov er , knowledge of the curtailment order in adv ance reduces the uncertainty of short term power output prediction of a generator . Finally , for a su ffi ciently long period of time (i.e. many years or the typical lifetime of a wind turbine), the curtailment rate under FRR con v erges to the proportional curtailment rate with Pro Rata, as shown in Fig. 1a. The remainder of the paper focuses on the network upgrade problem as a solution to reducing curtailment. 4. Modelling network in vestment using game theory In this section, we examine the combined e ff ects that fair curtailment rules, such as Pro Rata or FRR, and ‘common access’ line rules hav e on netw ork upgrade and the rene wable capacity installed. First, we describe the general setting of the game. Second, we present a model that captures stochasticity of generation and variation in demand. 4.1. Stack elber g game description Consider two locations: A is a net consumer (where demand exceeds supply , e.g. a mainland location with industry or significant population density) and B is a net energy producer (area of fav ourable renewable conditions, e.g. a remote region rich in wind resource). In practice, there would be some local demand and supply , considered here negligible, and installation of ne w RES capacity is not be feasible without a network upgrade. Moreov er , we consider two players: the line in v estor , who can be merchant-type or a utility company and is building the A − B interconnection and possibly renew able generation capacity at B , equal to P N 1 , and a local player, who represents the local RES generators or in vestors located at B , P N 2 . This second player can be thought of as in v estors from the local community , who do not have the technical / financial capacity to b uild a line, b ut may ha ve access to cheaper land, find it easier to get community permission to build turbines etc., hence may have a lo wer per- unit generation cost. Note that in Scotland or other countries such as Denmark, local groups often act together to mak e land av ailable and inv est in RES projects. In Scotland, Community Ener gy Scotland (CES) is an umbrella organisation of such groups and DNOs hav e an incentiv e to work with them. E G i represents the e xpected ener gy units which could be produced o ver the project lifetime according to the resource on the site’ s location without encountering curtailment, while E C i is the amount of av ailable energy lost through curtailment under the adopted Principle of Access. For simplicity , we assume there is no RES capacity installed at location B prior to the construction of the power line. The decision of building the power line will elicit a reaction from local in vestors. Crucially , the line in vestor has a first mover advantage in building the grid infrastructure, which is expensi v e, technically challenging, and only a 8 limited set of inv estors (e.g. DNO-approv ed) have the e xpertise and regulatory approv al to carry it out. The po wer line cost is estimated as C T = I T + M T ov er the project lifetime, where I T is the cost of b uilding the line (or initial in v estment) and M T the cost of operation and maintenance. The monetary value of the power line is proportional to the energy flowing from B to A , charged for local generators and common access rules with p T transmission fee per energy unit transported through the line. Moreover , for a generation unit i , we define the cost of expected generation per unit as c G i = ( I G , i + M G i ) / E G i , where I G i is the cost of building the plant and M G i the operation and maintenance costs, and we assume that the energy generated by a RES unit is sold at a constant generation tari ff price, equal to p G . Giv en these parameters, the profit functions of both players are defined. The line inv estor has two streams of rev enue, one from the energy produced and one by the energy produced by other in v estors or local generators, trans- ported through the transmission line. The costs of the line inv estor are related to the installation and operation of the generation capacity (generation cost c G 1 ) and the installation of the power line C T . Π 1 = ( E G 1 − E C 1 ) p G − E G 1 c G 1 + ( E G 2 − E C 2 ) p T − C T (3) Similarly , the profits of the local generators c G 2 depend only on the energy they produce with some generation cost c G 2 and then transmit through the power line at an access char ge of p T : Π 2 = ( E G 2 − E C 2 )( p G − p T ) − E G 2 c G 2 (4) The research question is ‘How to determine the optimal generation capacities b uilt by the two players, so that pr ofits are maximised?’ If we view this from a game-theoretic perspectiv e, this is a bi-lev el Stackelberg game [19]. The line inv estor or leader can assess and e valuate the reaction of other in v estors to determine their strategy (i.e. the generation capacity to be installed), aiming to influence the equilibrium price. Local generators or followers can only act after observing the leader’ s strategy . Note here that the terms line in vestor and leader (player 1) are used interchangeably , as are local generators and follo wer (player 2). The equilibrium of the g ame is found by backwar d induction . The line in vestor estimates the best response of local generators, given their own generation capacity , and then decides a strategy that maximises their profit. At a second stage, the follower observes this strategy and decides on their generation capacity to be installed, giv en by the best response function, i.e. maximising their own profit, as anticipated by the leader . 4.2. Stack elber g game with stochastic g eneration and varying demand This section presents the formal solution of the network upgrade problem with stochastic generation. Crucially , the equilibrium of the game depends on the curtailment imposed to the players. Howe v er , curtailment depends on the wind resource at the project location and varying demand. T o ease understanding, we first formulate the problem for a single renew able player , then we e xpand this to a two-player setting. 4.2.1. Single player analysis W e define as x i the per unit or normalised power generated by a single generator type i (e.g. player 1 or line in v estor) at a certain location without curtailment. Essentially , x i is a stochastic variable which depends on the wind speed distribution and is equal to x i = P G i / P N i , where P G i is the actual power output of i generator and P N i the rated capacity . By definition, x i is bounded in the region x i ∈ [0 , 1]. Moreov er , we assume the normalised power generated follows a probability distribution function f ( x i ), such that Z 1 0 f ( x i ) d x i = 1. The e xpected power generated when no curtailment is assumed, is equal to: E ( P G i ) = E ( x i ) · P N i = Z 1 0 x i P N i f ( x i ) d x i (5) At areas with network constraints, generators are often curtailed. In this case, if the power demanded (at location A ) at each time interv al t is equal to P D , t (we can safely assume that the power demanded is well kno wn and predicted), then the expected curtailed po wer or expected curtailment is required if and only if there is excess generation P G i − P D , t > 0 resulting to x i > P D , t / P N i . T ime step t can be defined as a reasonable time step, e.g. one hour or so that it coincides with the resolution of av ailable wind speed data or demand data. The expected po wer curtailed (for time interval t ) is 9 the di ff erence between the conditional expectation of the power generated minus the demand under the condition that it exceeds that demand, multiplied by the probability that the po wer generated exceeds the demand. In other words, the expected curtailment is equal to the e xpected v alue of the generation gi ven that generation exceeds the demand (a posteriori expectation) minus the po wer demanded times the probability that generation e xceeds the demand: E ( P C i , t ) = [ E ( P N i · x i | P N i · x i > P D , t ) − P D , t ] · Z 1 P D , t P N i f ( x i ) d x i (6) The first term (conditional expectation) is by definition equal to: E ( P N i · x i | P N i · x i > P D , t ) = Z 1 P D , t P N i P N i x i f ( x i ) d x i Z 1 P D , t P N i f ( x i ) d x i (7) Therefore, the expected curtailment is gi v en by: E ( P C i , t ) = Z 1 P D , t P N i P N i x i f ( x i ) d x i − P D , t Z 1 P D , t P N i f ( x i ) d x i (8) 4.2.2. T wo player analysis Follo wing the same intuition as in Section 4.2.1, we can estimate the expectations of power produced and curtailed for a tw o-player game. There are tw o types of generators, leader (player 1) and follower (player 2), both located at area B, b ut at di ff erent sub-regions of this location, e xperiencing di ff erent b ut correlated wind and satisfying the same aggregate demand. The stochastic variables x 1 and x 2 , follo w a joint probability distribution function f ( x 1 , x 2 ), which satisfies the property Z 1 0 Z 1 0 f ( x 1 , x 2 ) d x 2 d x 1 = 1. Note here that a joint probability distribution is assumed as in practice the wind resources of the players are likely to be correlated, e.g. neighbouring wind f arms experience high winds at the same time and so on. The total e xpected po wer generated without any curtailment is equal to: E ( P G ) = Z 1 0 Z 1 0 ( x 1 P N 1 + x 2 P N 2 ) f ( x 1 , x 2 ) d x 2 d x 1 (9) Similarly to the analysis in Section 4.2.1, the power is curtailed when there is excess generation or x 1 P N 1 + x 2 P N 2 − P D , t > 0, resulting to x 2 > P D , t − x 1 P N 1 P N 2 . Expected curtailment is equal to the expected v alue of generation given that generation e xceeds the demand (a posteriori expectation) minus the po wer demanded times the probability that generation exceeds the demand: E ( P C , t ) = [ E ( x 1 P N 1 + x 2 P N 2 | x 1 P N 1 + x 2 P N 2 > P D , t ) − P D , t ] · Z 1 0 Z 1 P D , t − x 1 P N 1 P N 2 f ( x 1 , x 2 ) d x 2 d x 1 (10) The conditional expectation of the generation gi ven that a curtailment e v ent has happened (i.e. generation exceeds the demand) is by definition equal to: E ( x 1 P N 1 + x 2 P N 2 | x 1 P N 1 + x 2 P N 2 > P D , t ) = Z 1 0 Z 1 P D , t − x 1 P N 1 P N 2 ( x 1 P N 1 + x 2 P N 2 ) f ( x 1 , x 2 ) d x 2 d x 1 Z 1 0 Z 1 P D , t − x 1 P N 1 P N 2 f ( x 1 , x 2 ) d x 2 d x 1 (11) 10 Combining the last two equations, the expected curtailment at time interv al t is: E ( P C , t ) = Z 1 0 Z 1 P D , t − x 1 P N 1 P N 2 ( x 1 P N 1 + x 2 P N 2 ) f ( x 1 , x 2 ) d x 2 d x 1 − P D , t Z 1 0 Z 1 P D , t − x 1 P N 1 P N 2 f ( x 1 , x 2 ) d x 2 d x 1 (12) Equations (9) and (12) are the derived expressions for the expected po wer generated and curtailed at each time step t , respecti v ely . For a longer period of time, e.g. equal to the project lifetime, the total energy produced by both players is E G = X t E ( P G t ) , ∀ t , as deri ved by (9). In a similar fashion, by Eq. (12) the energy curtailed by both players is E C = X t E ( P C t ) , ∀ t . Ho we ver , the profit equations in Eq. (3) and Eq. (4) require expressions of the e xpected ener gy generated and curtailed by each player . The energy that could ha ve been produced by i player (if no curtailment is imposed) is E G i = X t x i P N i = X t E ( P G i , t ) , ∀ t as in Eq. (5) and the energy curtailed for each i player is defined as E C i = X t P C i , t , ∀ t . Individual curtailment for ‘fair’ curtailment rules (such as Pro Rata or FRR) is shared amongst the generators proportionally to their size or actual power output at the time of curtailment. For instance, if at time interval t there is excess generation and P C , t is to be curtailed then the power curtailed by each player i is equal to: P C i , t = x i , t P N i x i , t P N i + x − i , t P N − i · P C , t (13) where − i denotes all other players. As sho wn in Section 3.2, ‘fair’ rules lead to approximately equal CF reduction, in the long term. Therefore, the energy curtailed by each player throughout the project lifetime can be approximated based on Eq. (13) as: E C i = E G i E G i + E G − i E C (14) In the abov e expressions, the profits as defined in Eq. (3) and Eq. (4) are functions of the players’ strategies, i.e. the rated capacity the y install. In particular , E G i is a function of P N i , b ut E C i is a function of both players’ rated capacities P N 1 , P N 2 . Therefore, the research question can be rephrased as ‘Which ar e the optimal r ated capacities player s install at the equilibrium of the game, so that profits ar e maximised?’ As players do not hav e the same market power , initially the leader defines a set of feasible solutions to their control variable P N 1 . Giv en the generation capacity installed by the line in v estor P N 1 , the local generators best response is: P ∗ N 2 = arg max P N 2 Π 2 ( P N 1 , P N 2 ) (15) Next the leader estimates which solution from the set of the follo wer’ s best response maximises their profits. Gi ven the capacity built by the follo wers P ∗ N 2 , the line in v estor’ s best response is: P ∗ N 1 = arg max P N 1 Π 1 ( P N 1 , P ∗ N 2 ) (16) In other words, the leader moves first by installing their o wn generation capacity . In the second level, followers respond to the generation capacity built, as anticipated by the leader . The equilibrium of the game ( P ∗ N 1 , P ∗ N 2 ) satisfies both Eq. (15) and Eq. (16) and is giv en by the notion of the subgame perfect equilibrium. In the following section, we show how the methodology is applied in practice using historical real data available for accurate representation. 5. Application of grid reinf orcement In this section, we apply the theoretical results of our analysis to a real network upgrade problem in the UK, namely the link between Hunterston and Kintyre in W estern Scotland. 4 https://www.ssen- transmission.co.uk/projects/kintyre- hunterston/ 11 Figure 2: Kintyre-Hunterston project map: Overhead line from Carradale to Crossaig 13 km, from Crossaig to Hunterston 41 km (subsea cable) and 3.5 km (land cable) 4 5.1. Kintyr e-Hunterston link The grid reinforcement project links the Kintyre peninsula to the Hunterston substation on the Scottish mainland (see Fig. 2). The project includes the installation of new overhead po wer lines, a new substation and a double circuit subsea cable of 220kV HV A C placed north of Arran for a distance of 41 km. Kintyre, located in the W est of Scotland, is a region that has attracted a vast amount of rene wable generation (454 MW RES capacity was expected to connect by the end of 2015) and high interest in RES in vestment (more than 793 MW potential connections), predominantly wind generation. In fact, the gro wth of renew able generation in the Kintyre region was responsible for the growing stress in the existing transmission line, originally designed and built to serv e a typical rural area of low demand. According to SSE (the DNO in this region), the Kintyre-Hunterston project will provide 150 MW of additional rene w able capacity and it will cost £230m. Apart from facilitating rene wable generation, the project is expected to increase security of supply and export capability to the mainland grid, deli v ering value to consumers estimated at £18m per annum [73]. 5.2. Pr oblem setting Based on the figures of this project, we apply the methodology described in Section 4 and characterise the equi- librium of the Stackelberg game. W e assume that the demand re gion or Location A is Hunterston and location B is the geographical region cov ering the Kintyre peninsula. The line inv estor installs their own generation capacity at a sub-region of location B and local generators install wind capacity at a di ff erent sub-region of location B. The same notation applies here as the line inv estor represents player 1 (leader) and local generators represent player 2 (follo wer). 5.2.1. W ind speed data W e use real wind speed data to perform our analysis, provided by the UK Met O ffi ce (UK Midas Dataset) 5 . T o model the two sub-regions at location B, two representativ e MIDAS weather stations were selected, the weather station with ID 908 located in the Kintyre peninsula and with ID 23417 located in Islay , with a distance between them of 44 km. The two stations were selected for a variety of reasons such as, the time period of av ailable data and their proximity so that the wind speed correlation between neighbouring locations could be modelled. W e will use station 908 as the location of the wind farm of the line in vestor and station 23417 for the local generators wind farm. The weather stations pro vide hourly measurements, in particular the hourly average of the mean wind speed (hourly measurements of a 10-min a veraged wind speed), as measured at anemometer’ s height, rounded to the nearest knot (1 kn = 0 . 5144 m / s). The nominal anemometer heights are z a = 10 m, for the leader and follo wer’ s location. Any missing data of a shorter duration than 6 hr were replaced by a linear interpolation of the nearest av ailable wind speeds, rounded to the nearest knot. This technique does not introduce a lar ge error , as it is unusual to ha v e a lar ge variation of the wind speed for such a short time period and the data substituted represent a small percentage of total measurements av ailable. 5 https://badc.nerc.ac.uk/search/midas_stations/ 12 Wind speed (m/s) 0 2 4 6 8 10 12 14 16 18 20 22 24 26 28 Density 0 0.02 0.04 0.06 0.08 0.1 c=9.9212 k=1.9557 Figure 3: W ind speed histogram and best fit W eibull curv e (local generators’ location) The analysis refers to the period 1999-2015, as this is the time frame when the stations ha ve data in common. This 17-year period of examination is approximately equal to the typical lifetime of a rene wable generation project (20 years). Giv en the hourly wind speeds, we can estimate the power output generated by a typical wind turbine. W e use a generic po wer curve based on an Enercon E82 wind turbine 6 of 2 . 05 MW rated capacity and hub height of 85 m. The wind turbine has a cut-in wind speed of 3 m / s, a cut-out wind speed of 28 m / s, and a rated wind speed of 13 m / s at which the turbine generates rated power output. The wind speeds need to be extrapolated to hub height. W e use a logarithmic shear profile to estimate the wind speed at hub height u h : u h = u a log z h / z o log z a / z o (17) where u a is the wind speed at anemometer height, z a = 10 m the anemometer height, z h = 85 m the hub height and z o = 30 mm is the surface roughness (short grass), which represents a typical en vironment for the weather stations and is also used in [70, 74]. The literature in wind forecasting [71, 72] commonly uses W eibull distrib utions for the representation of actual wind distributions, and we adopt this methodology here. For greater accuracy , we need to account for hourly and seasonal changes of the wind speed. For this reason, we consider 96 di ff erent W eibull distributions, one for e very hour (1 − 24) and season (1 − 4). Hour 1 refers to 00:00 and hour 24 to 23:00, March, April and May refer to Spring, June, July and August to Summer and so on. This approach is required to associate power generation caused by wind conditions to the power demanded, which also depends highly on the time of day and season, as sho wn in Section 5.2.2. Each probability distribution function is approximated by a W eibull function with a shape k and scale factor c : f ( u , c , k ) = k c u c ( k − 1) e − u c k (18) The parameters of the W eibull distributions are found by means of the function ‘fitdist’ in MA TLAB. F or example, Fig. 3 shows the wind speed histogram and the best W eibull fit for 09:00 hour in Autumn. The po wer output of a wind turbine is estimated by the power curve gi ven by the manuf acturer . The generated power is normalised to the rated capacity or nominal power output P pu = P / P nom and intermediate v alues are approx- imated by a sigmoid function with parameters a = 0 . 3921 s / m and b = 16 . 4287 m / s (see Fig. 4): f ( u , a , b ) = 1 1 + e − a ( u − b ) (19) In many w orks [70, 75, 76], gi ven that the normalised po wer output is bounded in the closed interval [0 , 1], the output profile is approximated by a standard beta distribution. F ollowing the same approach we can deri ve 96 beta 6 http://www.enercon.de/en/products/ep- 2/e- 82/ 13 Wind speed (m/s) 0 2 4 6 8 10 12 14 16 18 20 22 24 26 28 Power P pu 0 0.2 0.4 0.6 0.8 1 Power curve Sigmoid fit Figure 4: Po wer curve of Enercon E82 and best Sigmoid fit function Power P pu 0 0.2 0.4 0.6 0.8 1 Density 0 1 2 3 4 5 =0.4170 =0.3821 Figure 5: Po wer output histogram and best fit Beta curve (local generators’ location) probability distribution functions for e v ery hour and season gi ven by: f ( x i ) = 1 B ( α, β ) x α − 1 i (1 − x i ) β − 1 (20) where B ( α, β ) = Γ ( α ) Γ ( β ) Γ ( α + β ) Z 1 0 t α − 1 (1 − t ) β − 1 d t (21) Fig. 5 sho ws the histogram and best beta fit at the line in vestor’ s location at 09:00 hour in Autumn. Note here that the e ff ect of empty bins seen in Fig. 5, is created by the combined e ff ect of the W eibull distribution with the power generated and the fact that the data provided by the UK Met O ffi ce dataset are rounded to the nearest knot. The joint probability distribution of the power outputs of both players takes into account wind speed spatial correlation. Note here that the total power output is not a two-dimensional beta distribution, as the power outputs of the players are correlated. If there are su ffi cient wind speed measurements for both players locations, then the joint probability distribution can be estimated directly from the av ailable data. For example, Fig. 6 shows the joint power histogram at 09:00 hour in Autumn. Note here that most observations are concentrated at zero power output (no wind) or close to rated po wer (wind equal to or above nominal). Many observations appear around the diagonal, which indicates partial correlation of the power output generated by the players. 5.2.2. Demand data The demand data used are based on UK National Demand and published by the National Grid (historical demand data) 7 . The data a v ailable range from January 2006 to December 2015 and consist of the national demand in half- hourly intervals, corresponding to the settlement periods of the UK energy market. National demand is estimated 7 http://www2.nationalgrid.com/UK/Industry- information/Electricity- transmission- operational- data/ Data- Explorer/ 14 Figure 6: Joint po wer output histogram Hours 00:00 04:00 08:00 12:00 16:00 20:00 24:00 Demand (MW) 60 80 100 120 140 160 180 200 Low season (Summer) demand 2006-2015 (a) Hours 00:00 04:00 08:00 12:00 16:00 20:00 24:00 Demand (MW) 60 80 100 120 140 160 180 200 High season (Winter) demand 2006-2015 (b) Figure 7: Seasonal a verage demand with minimum and maximum values (a) for the lowest demand season (Summer) and (b) uneppeak demand season (W inter) as the sum of generation based on National Grid operational metering plus the estimated embedded generation from wind / solar generators plus imports. Real demand may di ff er from this estimation, as some demand is not visible to the transmission system, due to embedded generation connected to the distribution netw orks. Half-hourly demand data were substituted with the hourly average to keep the same resolution as the wind speed data. Ne xt, demand data were analysed in a similar manner to distrib utions for ev ery hour and season. The demand at location A was taken to be equal to the average national demand for ev ery hour and season, scaled down by a factor , such that peak load is equal to the capacity of the po wer line, considered equal to 150 MW. Indica- tiv ely , Fig. 7 sho ws the a verage demand at location A together with the minimum and maximum demand for e very hour , during the low demand season (Summer) and the high demand season (W inter). In Fig. 8 the seasonal e ff ect on the average demand is shown. The values of average demand per hour and season were used in our experimental setting analysis. From the demand and joint probability distributions, the equilibrium of the Stackelberg game can be found ana- lytically , as was shown in Section 4.2. In the next section, we show a methodology to identify the equilibrium of the game by an empirical approach using actual data from all the hours in a 17 year period. 5.3. Sear ching for the empirical game equilibrium using actual data This section describes the solution of the g ame from a data analytical approach. W e use the hourly wind speed data for two locations ov er a period of 17 years and the a verage demand on an hourly and seasonal basis. First of all, a feasible solution space needs to be identified. The strategies of the players are the generation capacities the y install, meaning the solution space should identify an upper limit of rated capacity , above which 15 Hours 00:00 02:00 04:00 06:00 08:00 10:00 12:00 14:00 16:00 18:00 20:00 22:00 Demand (MW) 60 80 100 120 140 160 Spring Summer Autumn Winter Figure 8: Hourly av erage demand per season any player would only incur losses. All possible solutions are included, ev en in the case that demand is served by a single player . Based on sev eral trial runs, this upper limit is set to P lim = 415 MW for each player . Note here that P lim is larger than the peak demand (150 MW) divided by the minimum CF experienced by any player at all hours and seasons, to guarantee that all possible solutions are included in the search space. Moreover , the incremental generation capacity a generator can install is set to 0 . 5 MW, therefore the solution search space is defined as [ P N 1 , P N 2 ] = [0 : 0 . 5 : 415 , 0 : 0 . 5 : 415]. For every possible combination of the rated capacities installed ( P N 1 , P N 2 ), we estimate the power generated and curtailed for both players under a f air curtailment rule such as Pro Rata or FRR. For example, for a particular com- bination of ( P N 1 , P N 2 ), we estimate the po wer generated at each hour given the wind speed and estimate the power curtailed gi ven the demand. Next, we estimate the aggregate po wer generated and curtailed by each player for the time period of 17 years and therefore deri v e the energy that would ha ve been generated (if no curtailment) and the energy curtailed, as the summation of 145077 v alid data points (hours in the 17 years that wind speed and demand data are available). For giv en cost parameters ( c G 1 , c G 2 , p T ), the profits of both players are estimated by Eq. (3) and Eq. (4). Essentially , for every scenario or giv en ( c G 1 , c G 2 , p T ), profits are derived for all feasible solutions included in the search space. The Stackelberg equilibrium is found as follows. Giv en a certain rated capacity built by the line in vestor P N 1 , we find the rated capacity P ∗ N 2 that maximises the follo wer’ s profits i.e. Π ∗ 2 . This step finds the best response of the follower gi ven the strategy of the leader . Note here that this results in a solution vector P ∗ N 2 , for ev ery P N 1 = [0 : 0 . 5 : 415 MW]. Next, from this set of solutions (follower’ s best response), the leader finds the solution that maximises their own profit i.e. P ∗ N 1 , by searching the normal form matrix of the corresponding Stackelberg game. The equilibrium of the game is gi ven by the pair ( P ∗ N 1 , P ∗ N 2 ), which satisfies both response functions of the two players. In the next section, we provide the solutions of the empirical study for v arying parameters and discuss the main findings of this approach. 6. Empirical results W e assume di ff erent scenarios to examine how the equilibrium results depend on varying parameters. Scenario 1 shows the dependence on local generators’ cost, Scenario 2 on line in vestor’ s cost and Scenario 3 on the the transmis- sion fee. At each scenario, the k ey parameter v aries, while other parameters remain fix ed. In all scenarios, the energy selling price is set equal to p G = £74 . 3 / MWh (equiv alent to a medium sized wind turbine with feed-in tari ff and e xport fee of £2 . 52p / kWh and £4 . 91p / kWh respecti vely) 8 . All parameters are expressed as a percentage of the p G for easier representation of the results. The step size of varying parameters is set equal to 0 . 02 p G for all scenarios considered. 8 https://www.ofgem.gov.uk/publications- and- updates/feed- tariff- fit- tariff- table- 1- april- 2016- non- pv- only 16 (1) Cost of local generators c G2 (% of p G ) 10 20 c G1 30 40 50 Rated capacity (MW) 0 100 200 300 400 500 Line investor Local generators Total P N1 =P N2 1 = 2 Cost of line investor c G1 (% of p G ) 20 c G2 30 40 50 Rated capacity (MW) 0 50 100 150 200 250 300 350 400 450 Line investor Local generators Total 1 = 2 P N1 =P N2 Transmission fee p T (% of p G ) 0 10 c G2 c G1 30 40 50 60 70 Rated capacity (MW) 0 50 100 150 200 250 300 350 400 450 Line investor Local generators Total 1 = 2 P N1 =P N2 (2) Cost of local generators c G2 (% of p G ) 10 20 c G1 30 40 50 Profits (millions £) -100 0 100 200 300 400 500 Line investor Local generators Total P N1 =P N2 1 = 2 Cost of line investor c G1 (% of p G ) 20 c G2 30 40 Profits (millions £) -100 0 100 200 300 Line investor Local generators Total P N1 =P N2 1 = 2 Transmission fee p T (% of p G ) 0 10 c G 2 c G1 30 40 50 60 70 Profits (millions £) -100 0 100 200 300 Line investor Local generators Total 1 = 2 P N1 =P N2 (3) Cost of local generators c G2 (% of p G ) 10 20 c G1 30 40 50 Energy (TWh) 0 5 10 15 20 25 30 Line investor EG1 Line investor EC1 Local generators EG2 Local generators EC2 P N1 =P N2 1 = 2 (a) Cost of line investor c G1 (% of p G ) 20 c G2 30 40 50 Energy (TWh) 0 10 20 30 Line investor EG1 Line investor EC1 Local generators EG2 Local generators EC2 1 = 2 P N1 =P N2 (b) Transmission fee p T (% of p G ) 0 10 c G2 c G1 30 40 50 60 70 Energy (TWh) 0 5 10 15 20 Line investor EG1 Line investor EC1 Local generators EG2 Local generators EC2 P N1 =P N2 1 = 2 (c) Figure 9: Rows (1), (2) and (3) show generation capacity built, profits, energy that could have been generated and energy curtailed at Stackelberg equilibrium, respectively , column (a) shows dependency on local generators’ generation cost, (b) on line investor’ s generation cost and (c) on imposed transmission fee Recall here, the follower will install generation capacity P N 2 as long as the revenues earned, depending on p G − p T , are lar ger than the cost of installing this capacity , depending on c G 2 . Crucially , the re venues depend on the curtailment imposed to the local generators E C 2 , which is interdependent on the capacity installed by the line in vestor P N 1 . On the other hand, the line inv estor earns rev enues from the energy generated E 1 ( P N 1 ), depending on p G and the energy transported through the line, E 2 ( P N 2 ), which is charged with p T . Both E 1 and E 2 depend on the curtailment imposed, which is a function of the rated capacities installed E C ( P N 1 , P N 2 ). The costs associated include the generation cost c G 1 and the fixed cost of the line C T . The line in vestor will install generation capacity himself as long as the cost of installing an additional generation unit results in increasing the profit. 6.1. Scenarios r esults • Scenario 1: V arying local generators’ cost: In this scenario, the line in v estor’ s generation cost is c G 1 = 0 . 30 p G and the transmission fee is p T = 0 . 26 p G , while the local generators’ cost varies from c G 2 = 0 . 06 p G to 0 . 52 p G . Results are shown in the first column of Fig. 9. T otal generation capacity installed decreases as c G 2 increases due to the reduction of P N 2 installed, as shown in Fig. 9-1a. W e can observe two critical points, c G 2 ' 0 . 255 p G where players install equal generation capacities P N 1 = P N 2 (Fig. 9-1a) and c G 2 ' 0 . 312 p G , where profits for both players are equal Π 1 = Π 2 (Fig. 9-2a). For c G 2 < 0 . 255 p G , local generators install more generation capacity than the line in vestor . For c G 2 = 0 . 255 p G to 0 . 312 p G although P N 1 > P N 2 (Fig. 9-1a), the leader’ s profit is lower , due to the additional cost of installing the 17 line C T . If c G 2 increases further, then local generators decrease their installed capacity , which ev entually leads to equal profits and sequentially to the leader’ s overcoming the follo wer’ s profit (Fig. 9-2a). • Scenario 2: V arying line in vestor’ s cost: In this scenario, we set c G 2 = 0 . 30 p G and p T = 0 . 26 p G , while c G 1 = 0 . 14 p G to 0 . 50 p G . Results are sho wn in the second column of Fig. 9. T otal generation decreases as c G 1 increases with other parameters remaining equal (Fig. 9-1b). F or lo w leader’ s generation cost, the line in vestor installs more generation capacity leading to larger profits. Howe ver , as c G 1 increases less capacity is installed by the line inv estor . This leads to decreasing profits. At c G 1 ' 0 . 292 p G the profits of the players become equal (Fig. 9-2b). From c G 1 ' 0 . 292 p G to 0 . 36 p G , the line in vestor continues to install more capacity up to c G 1 ' 0 . 36 p G , where players install equal generation capacity (Fig. 9-1b). • Scenario 3: V arying transmission fee: W e assume that c G 1 = 0 . 26 p G and c G 2 = 0 . 20 p G , while the transmission fee varies from p T = 0 to 0 . 76 p G . Results are sho wn in the third column of Fig. 9. The total generation capacity decreases as p T increases, due to local generators installing less capacity . The leader’ s generation capacity is relati vely constant with varying p T . Note here that the leader may react to the decreasing capacity of the local generators as p T increases, both by decreasing or increasing their o wn built capacity , as p T increases (Fig. 9-1c). When the transmission fee is p T < 0 . 42 p G , followers install more capacity as a result of the transmission fee and cheaper generation cost. Howe ver , as p T increases, the revenues drop for local generators, who install less P N 2 , up to p T ' 0 . 42 p G where players install equal capacities (Fig. 9-1c). Local generators hav e larger profits until c G 2 ' 0 . 36 p G where profits break ev en, mainly due to the high po wer line installation cost C T (Fig. 9-2c). For this setting, the transmission fee needs to be at least p T ' 0 . 15 p G . Charging a transmission fee below this amount would make it uneconomical for the line in v estor to install the line, gi ven the expected response by local generators. Morever , the line inv estor needs to install roughly as much generation capacity as local generators to achiev e similar profit, in this scenario. In contrast, if p T is set too high, it is not feasible for local generators to in v est in renew able energy at this location (Fig. 9-2c). 6.2. Discussion of r esults As sho wn in the results, for e very set of cost ( c G 1 , c G 2 ) and re venue parameters ( p T , p G ), there is an upper limit of total generation capacity being installed at Location B, which is equal to the sum of rated capacities installed by each player . In all sets of scenarios, total capacity decreases as the tested parameter value increases (Fig. 9-1a, Fig. 9-1b and Fig. 9-1c). Each player installs less capacity as their generation cost increases, while the other player benefits by increasing their capacity (Fig. 9-1a and Fig. 9-1b). The cost of local generators has a larger impact on the capacities installed for both players, as sho wn by comparing Fig. 9-1a and Fig. 9-1b, as local generators face the additional cost of transmission charges. Profits hav e similar behaviour to the generation capacities built in Scenarios 1 and 2, while in Scenario 3, the line in vestor’ s profit increases because of larger revenues from transmission (Fig. 9-2c). Note here that the players profits are not equal when P N 1 = P N 2 (which o ver a long time windo w means E G 1 ' E G 2 and E C 1 ' E C 2 as shown when comparing Fig. 9-1a with Fig. 9-3a, or Fig. 9-1b with Fig. 9-3b and Fig. 9-1c with Fig. 9-3c), because of transmission charges p T , but also because of di ff erent generation costs and C T . If the followers’ generation cost is much smaller than the line in vestor’ s (assuming for example that local genera- tors might have access to cheaper land or fa vourable licensing approv al), then the line inv estor will need to charge a high transmission fee to ha v e positi ve earnings (Fig. 9-2c). On the other hand, if the leader’ s cost is much smaller , the generation capacity will mostly be installed by the line in vestor , as there is no room for profitable in v estment of other renew able producers. Moreov er , in Scenario 3 it is shown that the followers’ generation capacity decreases as p T in- creases, but this does not alw ays result in the leader increasing their own capacity (see Fig. 9-1c). Estimating the best response is a comple x procedure which depends on the curtailment imposed and v arying demand. In a similar way , if we assume that local generators increase their installed capacity , it is possible for the line in v estor to slightly increase their own generation capacity , as this strategy move may minimise the profit losses incurred, as long as the increased cost of installing the additional generation capacity units leading to lar ger ener gy curtailed is counter -balanced by the rev enues generated by satisfying a lar ger demand at times when no curtailment occurs. 18 As shown in Scenario 3, p T ' 0 . 15 p G is the minimum value of the transmission fee that allows profit for the line in v estor . Similarly , if the transmission fee is set too high, then local inv estors will not in vest in rene wable generation, as their profit diminishes with increasing transmission fee. As p T is set by the system regulator , this method determines a feasible range that allows both transmission and generation in vestments to be profitable (Fig. 9-2c). The model developed in this w ork can model grid reinforcement projects performed by priv ate in vestors, who aim to maximise their profits instead of typical cost minimising techniques or maximising social welf are objectives, that exist when network upgrade is performed by the system operators. T ypical settings where this model can be applied in practice include numerous locations where demand and generation are not co-located. Finally , the model dev eloped o ff ers good insights to the strategic game formed between the players, for varying cost parameters. Conclusions can be reached either directly on real data measurements or their distributions. 7. Conclusions & Future work In this work we have sho wn how priv ately developed network upgrade for RES connection to the electricity grid can lead to a leader-follo wer game between the line in vestor and local in v estors. Curtailment and line access rules play a k ey role in the strategic game, the equilibrium of which can be used to determine optimal generation capacities installed in such settings and their associated profits. The model developed can capture the stochastic nature of renew ables and the v ariation in demand. W e hav e identified the equilibrium of the g ame and hav e sho wn ho w the optimal solution depends on the generation costs of the two players and the transmission fee. Most crucially , the latter can be used by regulators to calculate a feasible range for the transmission fee, that allows both network upgrade and local renewable generation in vestment. W e ha v e dev eloped a methodology for the equilibrium of the game that utilises real data, both on the supply and demand side and have applied this to a case study in W estern Scotland. W e used a big dataset analysis that spans over the course of 17 years. Other contrib utions of our work include a study on di ff erent curtailment rules and their e ff ects on the capacity factor of wind generators, hence their profitability and viability of in v estment. Finally , we have proposed a new curtailment rule which ensures equal share of curtailment amongst generators with minimal disruption. In the future, we plan to extend the model to multi-location settings and dispatch decisions that include flexibility on the demand side, such as demand response or energy storage devices, which can be used to partially defer curtailment. A combined system with partial storage, demand response and rare curtailment ev ents could be the most realistic solution in practice. Acknowledgements The authors would like to thank Community Energy Scotland, SSE, the National Grid and the UK Meteorological O ffi ce for data access and all the information provided. V alentin Robu and David Flynn would like to ackno wledge the support of the EPSRC National Centre for Energy Systems Inte gration (CESI) [EP / P001173 / 1]. References References [1] M. Andoni, V . Robu, Using Stackelberg games to model electric power grid investments in rene wable energy settings, in: International Conference on Autonomous Agents and Multiagent Systems, Springer , 2016, pp. 127–146. [2] M. Andoni, V . Robu, W .-G. Fr ¨ uh, Game-theoretic modeling of curtailment rules and their e ff ect on transmission line investments, in: IEEE PES Innov ativ e Smart Grid T echnologies Europe 2016, IEEE PES, Ljubljana, 2016. [3] REN21 (Paris: REN21 Secretariat), Renewables 2016 Global Status Report, T ech. rep. (2016). [4] Department for Business, Energy & Industrial Strate gy, Electricity generation costs, T ech. rep. (Nov . 2016). [5] R. Niemi, P . D. Lund, Decentralized electricity system sizing and placement in distribution networks, Applied Energy 87 (6) (2010) 1865– 1869. [6] DOE, Smart Grid System Report: Report to Congress in U.S.Department of Energy , W ashington DC., T ech. rep. (2012). [7] A. Michiorri, R. Currie, P . T aylor , F . W atson, D. Macleman, Dynamic line ratings deployment on the orkney smart grid, in: CIRED, 2011. [8] K. L. Anaya, M. G. Pollitt, Experience with smarter commercial arrangements for distributed wind generation, Ener gy Policy 71 (2014) 52–62. [9] R. Currie, B. O’Neill, C. Foote, A. Gooding, R. Ferris, J. Douglas, Commercial arrangements to facilitate active network management, in: 21st International Conference on Electricity Distribution, CIRED, Frankfurt, 2011. 19 [10] O ffi ce of Gas and Electricity Markets (Ofgem), Lo w Carbon Networks Fund (2015). [11] Baringa Partners, UK Po wer Networks, Fle xible Plug and Play Principles of Access Report, T ech. rep. (Dec. 2012). [12] J. Druitt, W .-G. Fr ¨ uh, Simulation of demand management and grid balancing with electric vehicles, Journal of Power Sources 216 (2012) 104–116. [13] V . Robu, S. Stein, E. H. Gerding, D. C. Park es, A. Rogers, N. R. Jennings, An online mechanism for multi-speed electric vehicle charging, in: International Conference on Auctions, Market Mechanisms and Their Applications, Springer , 2011, pp. 100–112. [14] S. Stein, E. Gerding, V . Robu, N. R. Jennings, A model-based online mechanism with pre-commitment and its application to electric vehicle charging, in: Proceedings of the 11th International Conference on Autonomous Agents and Multiagent Systems (AAMAS), IF AAMAS, V alencia, 2012, pp. 669–676. [15] P . Bronski and J. Creyts and M. Crowdis, The Economies of Load Defection: Rocky Mountain Institute, T ech. rep. (April 2015). [16] Department of Energy Climate Change, Deli vering UK Ener gy In vestment: Networks, T ech. rep. (Jan. 2015). [17] K. L. Anaya, M. G. Pollitt, Options for allocating and releasing distrib ution system capacity: Deciding between interruptible connections and firm DG connections, Applied Energy 144 (2015) 96–105. [18] J. W ard, M. Pooley , G. Owen, Gb electricity demand-realising the resource: What demand-side services can provide value to the electricity sector , in: Sustainability First, London, 2012. [19] H. von Stackelber g, Market structure and equilibrium, Springer Science & Business Media, 2010. [20] L. Kane, G. Ault, Ev aluation of wind power curtailment in activ e network management schemes, IEEE Transactions on Power Systems 30 (2) (2015) 672–679. [21] K. Bell, R. Green, I. K ockar, G. Ault, J. McDonald, Project T ransmiT : Academic Re vie w of Transmission Char ging Arrangements, T ech. rep. (May 2011). [22] EirGrid, Soni, Ensuring a secure, reliable and e ffi cient power system in a changing en vironment, T ech. rep. (June 2011). [23] C. Ruiz, A. J. Conejo, J. David Fuller, S. A. Gabriel, B. F . Hobbs, A tutorial revie w of complementarity models for decision-making in energy markets, EUR O Journal on Decision Processes 2 (2013) 91–120. [24] C. J. Day , B. F . Hobbs, J.-S. Pang, Oligopolistic competition in po wer networks: a conjectured supply function approach, IEEE Transactions on Power Systems 17 (3) (2002) 597–607. [25] B. F . Hobbs, Optimization methods for electric utility resource planning, European Journal of Operational Research 83 (1995) 1–20. [26] A. A. Foroud, A. A. Abdoos, R. Ke ypour , M. Amirahmadi, A multi-objectiv e framework for dynamic transmission expansion planning in competitiv e electricity market, International Journal of Electrical Po wer & Energy Systems 32 (8) (2010) 861–872. [27] A. Soroudi, M. Ehsan, A distribution network expansion planning model considering distributed generation options and techo-economical issues, Energy 35 (8) (2010) 3364–3374. [28] A. Arabali, M. Ghofrani, M. Etezadi-Amoli, M. S. F adali, M. Moeini-Aghtaie, A multi-objecti v e transmission e xpansion planning frame work in deregulated po wer systems with wind generation, IEEE T ransactions on Power Systems 29 (6) (2014) 3003–3011. [29] T . Akbari, A. Rahimikian, A. Kazemi, A multi-stage stochastic transmission expansion planning method, Energy Conv ersion and Manage- ment 52 (8) (2011) 2844–2853. [30] B. Zeng, J. W en, J. Shi, J. Zhang, Y . Zhang, A multi-level approach to active distribution system planning for e ffi cient renewable energy harvesting in a deregulated en vironment, Energy 96 (2016) 614–624. [31] A. Sheikhi Fini, M. Parsa Moghaddam, M. Sheikh-El-Eslami, An investig ation on the impacts of regulatory support schemes on distributed energy resource e xpansion planning, Renew able energy 53 (2013) 339–349. [32] S. Kamalinia, M. Shahidehpour , L. W uc, Sustainable resource planning in ener gy markets, Applied Energy 133 (2014) 112–120. [33] L. Baringo, A. J. Conejo, T ransmission and wind power in vestment, IEEE Transactions on Po wer Systems 27 (2) (2012) 885–893. [34] N. Gupta, R. Shekhar, P . K. Kalra, Computationally e ffi cient composite transmission expansion planning: A pareto optimal approach for techno-economic solution, International Journal of Electrical Power & Ener gy Systems 63 (2014) 917–926. [35] A. Motamedi, H. Zareipour, M. O. Buygi, W . D. Rosehart, A transmission planning framework considering future generation expansions in electricity markets, IEEE T ransactions on Po wer Systems 25 (4) (2010) 1987–1995. [36] H. R. Baghaee, M. Mirsalim, G. B. Gharehpetian, H. A. T alebi, Reliability / cost-based multi-objective Pareto optimal design of stand-alone wind / PV / FC generation microgrid system, Energy 115 (2016) 1022–1041. [37] A. K. Kaviani, H. R. Baghaee, G. H. Riahy , Optimal sizing of a stand-alone wind / photov oltaic generation unit using particle swarm optimiza- tion, Simulation 85 (2) (2009) 89–99. [38] H. R. Baghaee, M. Mirsalim, G. B. Gharehpetian, Multi-objecti ve optimal po wer mangemnet and sizing of a reliable wind / PV microgrid with hydrogen energy storage using MOPSO, Journal of Intelligent & Fuzzy Systems (2016) 1–21. [39] J. Contreras, G. Gross, J. M. Arroyo, J. I. Muoz, An incenti ve-based mechanism for transmission asset in vestment, Decision Support Systems 47 (1) (2009) 22–31. [40] L. Maurovich-Horvat, T . K. Boomsma, A. S. Siddiqui, Transmission and wind investment in a deregulated electricity industry , IEEE Trans- actions on Power Systems 30 (3) (2015) 1633–1643. [41] A. Perrault, C. Boutilier, E ffi cient coordinated power distribution on priv ate infrastructure, in: Int. Conference on Autonomous Agents and Multi-Agent Systems, AAMAS, Paris, 2014, pp. 805–812. [42] P . Joskow , J. T irole, T ransmission rights and market po wer on electric po wer networks, RAND Journal of Economics 31 (3) (2000) 450–487. [43] D. Huppmanna, J. Egerera, National-strate gic in vestment in european power transmission capacity , European Journal of Operational Research 247 (1) (2015) 191–203. [44] E. E. Sauma, S. S. Oren, Proactive planning and v aluation of transmission in vestments in restructured electricity mark ets, Journal of Regula- tory Economics 30 (3) (2006) 261–290. [45] G. B. Shrestha, P . A. J. Fonseka, Congestion-dri v en transmission expansion in competitiv e power markets, IEEE Transactions on Power Systems 19 (3) (2004) 1658–1665. [46] A. H. van der W eijde, B. F . Hobbs, The economics of planning electricity transmission to accommodate renewables: Using two-stage optimisation to ev aluate flexibility and the cost of disre garding uncertainty , Energy Economics 34 (6) (2012) 2089–2101. 20 [47] G. E. Asimakopoulou, A. L. Dimeas, N. D. Hatziargyriou, Leader-follo wer strategies for energy management of multi-microgrids, IEEE T ransactions on Smart Grid 4 (4) (2013) 1909–1916. [48] J. Lee, J. Guo, J. K. Choi, M. Zukerman, Distributed energy trading in microgrids: A game theoretic model and its equilibrium analysis, IEEE T ransactions on Industrial Electronics 62 (6) (2015) 3524–3533. [49] W . Ketter , J. Collins, P . Reddy , Power T A C: A competitiv e economic simulation of the smart grid, Energy Economics 39 (2013) 262–270. [50] H. R. Baghaee, M. Mirsalim, G. B. Gharehpetian, H. A. T alebi, Three-phase A C / DC power-flo w for balanced / unbalanced microgrids in- cluding wind / solar , droop-controlled and electronically-coupled distrib uted ener gy resources using radial basis function neural netw orks, IET Power Electronics 10 (3) (2016) 313–328. [51] H. R. Baghaee, M. Mirsalim, G. B. Gharehpetian, H. A. T alebi, Nonlinear load sharing and voltage compensation of microgrids based on harmonic power -flo w calculations using radial basis function neural networks, IEEE Systems Journal PP (99) (2017) 1–11. [52] H. R. Baghaee, M. Mirsalim, G. B. Gharehpetian, H. A. T alebi, Application of RBF neural networks and unscented transformation in probabilistic power -flo w of microgrids including correlated wind / PV units and plug-in hybrid electric vehicles, Simulation Modelling Practice and Theory 72 (2017) 51–68. [53] R. Kota, G. Chalkiadakis, V . Robu, A. Rogers, N. R. Jennings, Cooperatives for demand side management, in: The Se venth Conference on Prestigious Applications of Intelligent Systems, P AIS @ ECAI, Montpellier , 2012, pp. 969–974. [54] N. Li, L. Chen, M. Dahleh, Demand response using linear supply function bidding, IEEE Transactions on Smart Grid 6 (4) (2015) 1827–1838. [55] H. Ma, V . Rob u, N. Li, D. C. Parkes, Incentivizing reliability in demand-side response, in: Proc. of 25th Int. Joint Conf. On Artificial Intelligence, IJCAI, AAAI Press / International Joint Conferences on Artificial Intelligence, Ne w Y ork, 2016, pp. 352–358. [56] Y . Xu, N. Li, S. H. Low , Demand response with capacity constrained supply function bidding, IEEE T ransactions on Po wer Systems PP (99) (2015) 1–18. [57] V . Robu, R. K ota, G. Chalkiadakis, A. Rogers, N. R. Jennings, Cooperativ e virtual po wer plant formation using scoring rules, in: T wenty-Sixth Conference on Artificial Intelligence, AAAI, T oronto, 2012, pp. 370–376. [58] V . Robu, G. Chalkiadakis, R. K ota, A. Rogers, N. R. Jennings, Rewarding cooperativ e virtual power plant formation using scoring rules, Energy 117, P art 1 (2016) 19–28. [59] M. V asirani, R. Kota, R. L. G. Cavalcante, S. Ossowski, N. R. Jennings, An agent-based approach to virtual power plants of wind power generators and electric vehicles, IEEE T ransactions on Smart Grid 4 (3) (2013) 1314–1322. [60] W . Su, A. Q. Huang, A game theoretic framework for a next-generation retail electricity market with high penetration of distributed residential electricity suppliers, Applied Energy 119 (2014) 341–350. [61] N. Zhang, Y . Y an, W . Su, A game-theoretic economic operation of residential distribution system with high participation of distrib uted electricity prosumers, Applied Energy 154 (2015) 471–479. [62] C. L. Prete, B. F . Hobbs, A cooperativ e game theoretic analysis of incentives for microgrids in regulated electricity markets, Applied Ener gy 169 (2016) 524–541. [63] C. Min, M. Kim, J. Park, Y . Y oon, Game-theory-based generation maintenance scheduling in electricity mark ets, Energy 55 (2013) 310–318. [64] Q. Wu, H. Ren, W . Gao, J. Ren, C. Lao, Profit allocation analysis among the distributed energy network participants based on game-theory , Energy 118 (2016) 783–794. [65] R. Zheng, Y . Xu, N. Chakraborty , K. Sycara, A crowdfunding model for green energy in v estment, in: 24th Int. Joint Conference on Artificial Intelligence, IJCAI, Buenos Aires, 2015, pp. 2669–2675. [66] M. P . R. Ortega, J. I. Perez-Arriaga, J. R. Abbad, J. P . Gonzalez, Distribution netw ork tari ff s: A closed question?, Energy Policy 36 (5) (2008) 1712–1725. [67] L. Kane, G. Ault, A revie w and analysis of renewable energy curtailment schemes and Principles of Access: Transitioning to wards business as usual, Energy Polic y 72 (2014) 67–77. [68] S. Fink and C. Mudd and K. Porter and B. Morgenstern, W ind ener gy curtailment case studies, T ech. rep. (May 2009). [69] UK Po wer Networks, Fle xible Plug and Play Quicker and more cost e ff ecti ve connections of rene wable generation to the distrib ution netw ork using a flexible approach - SDRC 9.7, T ech. rep. (Dec. 2014). [70] W .-G. Fr ¨ uh, From local wind energy resource to national wind po wer production, AIMS Energy 3 (1) (2015) 101–120. [71] S. E. T uller , A. C. Brett, The characteristics of wind velocity that f av or the fitting of a W eibull distribution in wind speed analysis, Journal of Climate and Applied Meteorology 23 (1) (1984) 124–134. [72] P . J. Edwards, R. B. Hurst, Lev el-crossing statistics of the horizontal wind speed in the planetary surface boundary layer , Chaos: An Interdis- ciplinary Journal of Nonlinear Science 11 (3) (2001) 611–618. [73] Sinclair Knight Merz (SKM), Kintyre-Hunterston 132kV transmission network reinforcement cost benefit analysis, T ech. rep. (Jan. 2013). [74] S. J. W atson, P . Kritharas, G. J. Hodgson, W ind speed v ariability across the UK between 1957 and 2011, W ind Energy 18 (1) (2015) 21–42. [75] S. J. W atson, P . Kritharas, G. J. Hodgson, Impact of beta-distributed wind po wer on economic load dispatch, Electric Power Components and Systems 39 (8) (2011) 768–779. [76] A. Fabbri, T . G. S. Roman, J. R. Abbad, V . M. Quezada, Assessment of the cost associated with wind generation prediction errors in a liberalized electricity market, IEEE T ransactions on Po wer Systems 20 (3) (2005) 1440–1446. 21
Original Paper
Loading high-quality paper...
Comments & Academic Discussion
Loading comments...
Leave a Comment