Regularized Inverse Holographic Volume Reconstruction for 3D Particle Tracking
The key limitations of digital inline holography (DIH) for particle tracking applications are poor longitudinal resolution, particle concentration limits, and case-specific processing. We utilize an inverse problem method with fused lasso regularizat…
Authors: Kevin Mallery, Jiarong Hong
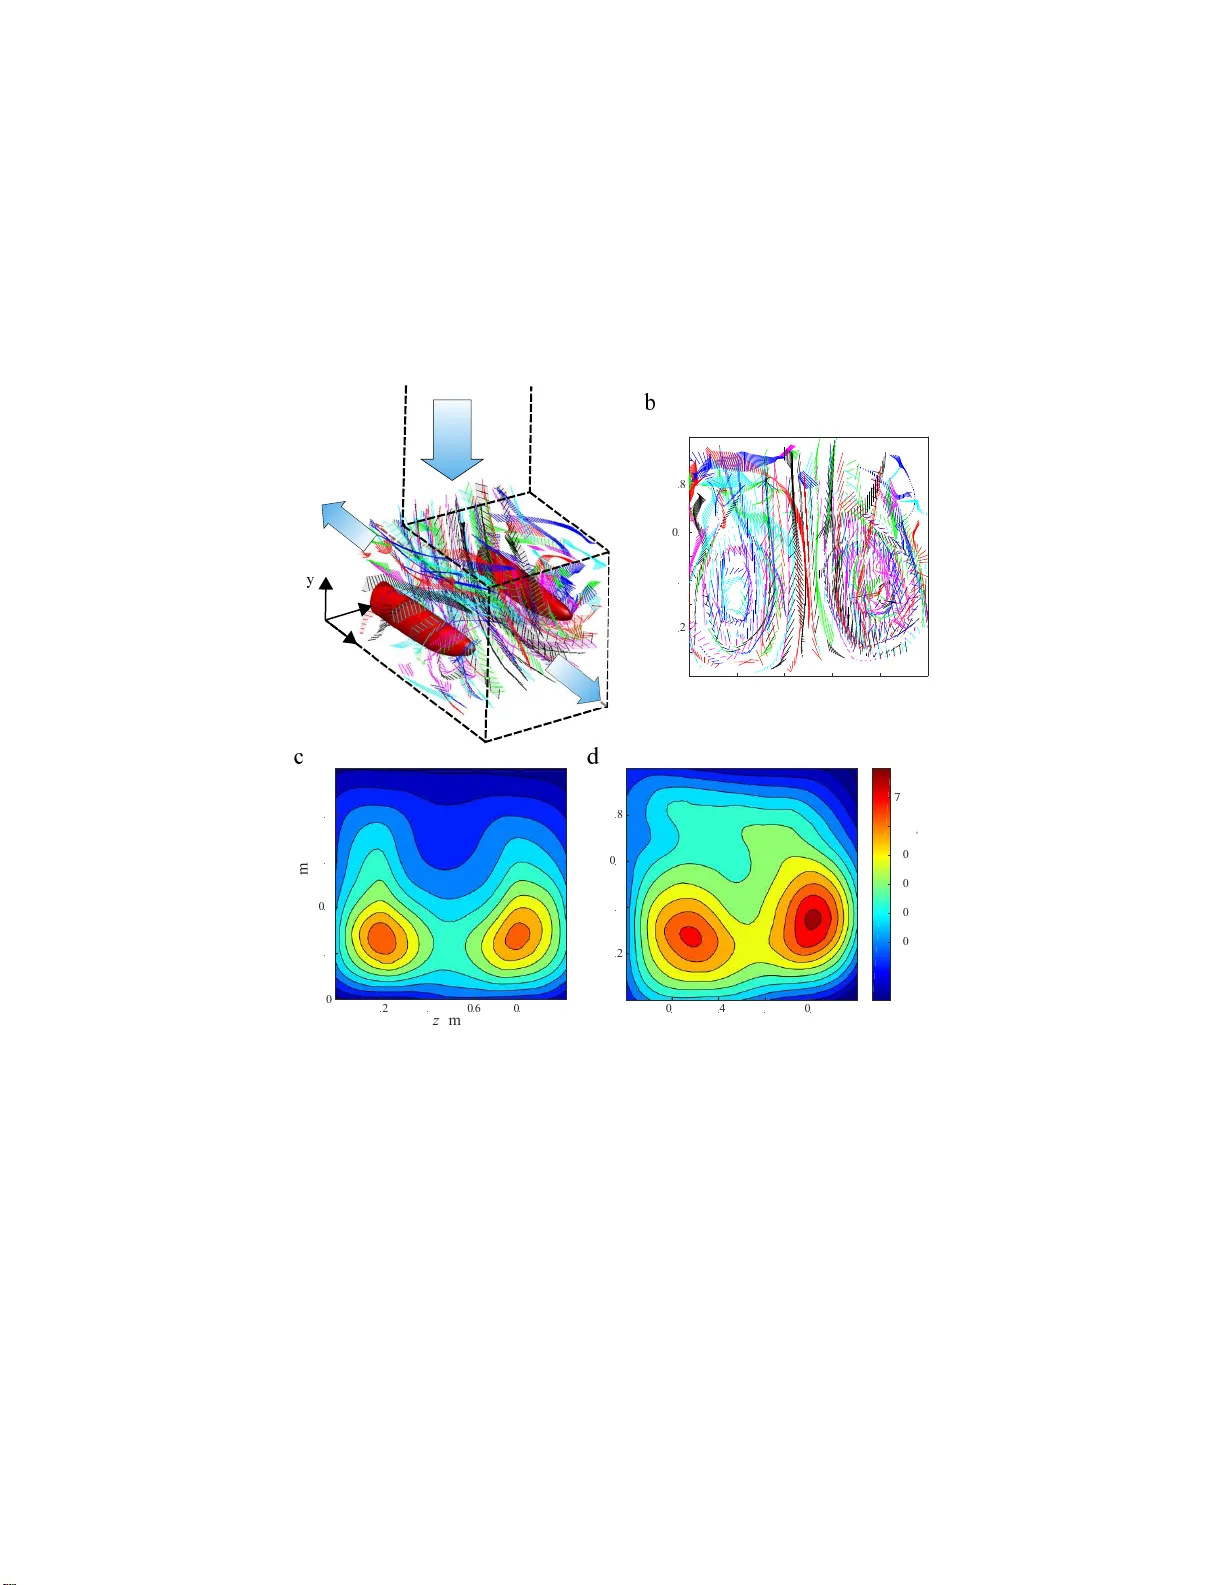
R e g u l a r i z e d I n v e rs e H o l o g r a p h i c V o l u m e R e c o n s t r u c t io n fo r 3 D Pa r t i cl e T r a ck i n g K E V I N M A L L E RY A N D J I A R O N G H O N G * Department o f Mec hanical Engineering, U niv ersity of Minneso ta, 111 Chur c h St S E, Minneap olis, MN 55455, USA * jhong@umn.edu Ab stract: The ke y limitatio ns of digital in line ho lograp h y (DIH) f or par ticle tracking applica- tions are poor lo ngitudinal re so lution, par ticle concentration limits, and case-specific processing. W e utilize an inv erse prob lem metho d with f used lasso re gular ization to per f or m full v olum etric reconstr uctions of par ticle fields. By e xploiting data sparsity in the solution and utilizing GPU processing, we dramatically redu ce the computation al co s t usuall y associated with in verse re- constr u ction app roaches. W e demonstrate the accuracy o f the proposed me th od using sy n thetic and exper imental ho lograms. Finally , we present tw o p ractical applicatio ns (h ig h co ncentration microorganism swimming and microfiber r otation) to e xtend the capabilities of DIH bey ond what w as possible using pr ior metho d s. © 201 9 Optical Society of America under the ter ms of the OSA Open Access Publishing Ag reement 1. Introduction Digital inlin e holog raphy (DIH) is a diffractive imag ing method in which volumetr ic inform a tion is en coded and subsequen tl y e xtracted from a 2D image [1]. The ability to resolv e the position of objects in 3D natu r all y leads to tempo ral tracking [2, 3] with ap plications in par ticle d ynamics [4], microorganism swimming [5], measuremen ts of 3D flo w fields [6] , and flo w-s tr ucture interactio n [7, 8 ] among many others. Th e pr imar y adv antage of DIH par ticle tracking velocimetry (DIH- PTV) is that it is able to cap ture tim e-resol v ed 3D v elocities using only a single camera. DIH-PTV is substantially less e xpensive than m ethods such as tomograp hic PT V o r trad itional PI V due to the n e ed for only one ca m era and compatibility with lo w co s t laser sources. The lo w cost and hardware simplicity of DIH has enabled m ultiple in situ applications [ 9–11]. Despite these adv antages, th ere are sev eral drawbacks of DIH- PTV that hav e limited b road application of the method. Since the incep tion of DIH-PT V , poor longitu d inal (i.e. out of the plane of the image) resolu tion has con sis tently been the gr eatest challenge [2, 12, 13]. Known as the depth-of-focus ( DOF) pr o blem, the apparent e lo ngation of reconstr ucted p articles is ca used by the finite senso r extent and the intensity integ ration effect of p h ysical pixels [1 , 2]. A dditional imaging n o ise fur ther redu c es th e ability to resolv e the critical high frequen c y fr inges. Because of th is limitation, some applicatio ns of DIH- PT V (n a m el y [13 , 14]) hav e pr imar il y f ocused on the an al ysis of the m u ch more accurate in-p lane v elocities. When h igh par ticle con centrations are used, cro ss-interference and other noise sou rces (twin image, ou t-of-focus par ticles) result in a lo w sign al-to-noise ratio (SNR) [ 15, 1 6]. Malek et al. show ed that the reconstr uction quality depend s o n bo th the shado w density and the d epth of the sample [1 5 ]. The shado w d ensity is s d = n s L d 2 (1) where n s is par ticle number concentration, L is sample depth, and d is th e par ticle diameter . Methods f or impr oving DIH- PTV (see next pa ragraph ) of te n require increasing the op tical complexity , e xtensive pr ocess tunin g by an e x p ert, and expensive comp utations. Many app roaches to o vercoming these dra wbacks focus o n h ardware design to improv e the recorde d image quality or en c ode more inf or mation in the record ing. The m o st common is the use of mu ltiple viewing angles (to mogra p hic DI H), using the lateral accuracy and som e depth information from each vie w to mor e ac c urately localize the p articles [ 17–20]. This method requires only tw o cameras ( o r on e by using mirr ors [1 8]) compar ed to four r equired for conv entional tomog raphy . Other appro aches specific to DI H-PTV seek to redu ce the effectiv e shadow density by illuminating o nl y a limited volume of inter e st [21, 22] or using lo calized par ticle seeding [23 ]. Due to their mechanica l a nd op tical complexity , these metho ds are non- tr ivial to im plement an d care mu st be taken to av oid flo w disturbance. Off-ax is holog raphy is also com monly used as it do es not hav e the twin ima ge pro b lem and separa te s the reference bea m from th e objec t (red u cing contamination ) [24, 25 ]. How ev er, this requires p recision alignme n t and hig h er laser cohere nce. Collectivel y , these me thods requir ing multiple optical paths, v iewing angles, and calib ration thereof negate the pr inciple advantages o f DI H - PTV , nam el y ease of u se and hardware simplicity . Many autho rs hav e f ocused o n impr o ving the numer ical pro cessing of DIH-PTV images. Much of th is w ork has been f ocused on automatic detection of th e object focal plane [26 , 27 ]. Ho we v er , the se do no t address the prob le m of low SNR and u suall y assume that accurate 2D segmentation is tr ivial which is only true when the par ticle concentration is v er y lo w . Iterative phase retr iev al method s hav e been sho wn to solv e the twin image problem and improv e the reconstr ucted SNR [2 8, 29 ] , but ha v e n o t been applied for PT V . Ho lo graph ic deconv o lution [13, 30–33] bor row s a method from o p tical microscopy to treat th e apparen t blu r r ing of poin t objects in the 3D reco nstruction as conv olution of the tr ue object with a blur r ing point spread function (PSF). How ev er , th e depend ence of deconv olution o n a 3D Fourier transf or m makes this m ethod memo ry in tensiv e and windowing may be n eeded to p rocess large h ologra m s (mo re than 10 8 v ox e ls). The poin t o bject assumption also limits the range of applications suitable f or deconv olution. A more r ecent a p proach to hologr aphic reco nstruction is the inv erse metho d [3 4 , 35] . In v erse methods, ra ther than r econstructin g the object fro m the im age, instead find the optim al ob ject that would produ ce the ob served image while satisfying some physical constraints. One of the first inv e rse p roblem f or mulation s was prop osed b y Soulez et al. [34 ] who per f or med a 4D parametr ic optim ization to find th e 3D location and r adius o f sph erica l par ticles. T heir stated linear time depend ence o n the numb er of par ticles makes this metho d unsuitable f or fluid flow applications where tho usands of par ticles must be track ed for hu n dreds of frames. Further mor e, the assumption of sphe rical pa rticles restr icts the scope o f p o tential applica tio ns. The use of th e ter m "comp ressiv e holog raphy" (CH) to ref er to the inv erse pro blem was introd u ced b y Brady et al. in 2009 wh o b orr o w ed concepts from th e field of compressiv e sen sin g f or holog raphic processing [3 5]. They used a total v ar iation regular ized ap proach to produce in-focus images of two dandelion seed parachutes recorded co n cur rently at tw o differ e n t f oca l planes. Denis et al. [36] used a similar ap p roach with a simpler sparsity-based regular ization . Both ap p roaches sho w a sign ificant re d uction in the out-of- f ocus noise, twin images, and oth er no ise. More recently , a set of physicall y m eaningful constraints (in cluding sparsity , smoo thness, and non - amplification) h a ve been used to achiev e ex cellent reco n structions of a b sorp tion and phase of individu al ev apor ating p articles and their evaporation tails [37]. Inv er se metho d s h av e only bee n used to recon struct objects for which the ax ia l loc ation is kn o wn either a p rio r i or from a conv entional reconstr uction method. There hav e been no applications of compressiv e holog raphy f o r DIH- PTV of flo ws containin g thou sands o f tra c er par ticles. The pr imar y bar r ier prev enting such application is the high c omputational cost. F or illustration, we co nsider a case w ith 1000 p articles per imag e and 100 images ea ch sized 1024 × 1 0 24 pix els with 1024 reconstr uction planes (10 9 v ox e ls). The best repor ted speeds f or parametr ic me thods is approximatel y 4 seconds per par ticle (4.6 da ys f or our e xample) [38]. A previous GPU- accelerated comp ressiv e h olograp h y imple m entation can recon struct a volume up to 10 2 4 × 10² 4 × 10 vo xels in 7.6 seconds (2 2 ho urs for our e xample) [39 ]. Other method s hav e ev en longer extrapolated times including 1000 day s [ 37] and 40 0 d a ys (on moder n hardware) [35]. In addition to the time required f or pro cessing, memo ry requirements for CH place se vere restriction s on the size o f ho logram th at can be proc essed. Storag e of the hypothetical test case holog ram would require approximately 8 GB to store in memor y (comp le x floatin g-point values, 8 bytes each). Sev eral additional variables o f this size are needed f or CH alg or ithms. How ev er , contempo rar y GPU mem ory is limited to app ro ximately 12 GB f or consum er hardware and memor y transfers from the GPU to RAM are slow . Th eref ore, cur rent application of CH m ust either limit the v o lu me size to take advantage of the spe ed increase of GPU-accele r ation or rely on the much larger RAM available on most desktop comp uters and rely on m uch slo wer CPU processing. In the present study , w e first su m mar ize the fundamentals o f CH. W e then introduc e our propo sed method using fused lasso reg ular iz a tio n and a sparse storage structure to enable processing of very large images in a realistic time ( 55 hou rs for the 1 00 image sequence o f large holog rams described abov e). W e then provide se veral synthetic and e xper imental e valuation cases to dem o nstrate th e quality and pe rforma nce o f the propo sed method . 2. Methodology W e f or mulate the 3D reco nstruction of the object volume as an inverse optimizatio n problem, f ollowing the me thod of Brady , Endo , and others [3 5, 3 9]. Th e optimization prob lem form ulation (2) seeks to find the object field ( x ) that minimizes the d ifference between the obser ved holo gram ( b ) and the estimated ho logram p roduced fr om the object ( ˆ b = H x ). T o ensure that the solution co nv erges, we use a linear ized for m of the for ward mode l f or hologr am form ation which implicitly trea ts any no nlinear ter ms (i. e . twin image and cross inter ference) as noise. ˆ x = arg min x k H x − b k 2 2 + λ R ( x ) ≡ f ( x ) + g ( x ) (2) T o av oid tr ivial solution s, a co n straint must be applied to ensur e a phy sically realis tic solu tion. This co n straint is implemented as the additional regu larizatio n ter m in (2), λ R ( x ) = g ( x ) . The f or m of this reg u larizatio n function deter mines wh ich pro per ties of the solution will b e enforced. The ℓ 1 nor m (3 ) enforces a sparse solution ( i.e. one with f ew no n-zero elemen ts). This spar sity - based regu larizatio n has be e n demonstrated for holog raphy by Denis et al. [3 6] and Endo et al. [39] wh o show ca se its utility wh en th e f raction of the sample v o lume occu pied by objects is v er y small. R ( x ) = k x k 1 = N Õ i = 1 | x i | (3) The T otal V ar iation (T V) nor m (4) is the sum of the 1st order gr adients ov er the image (size N x × N y ). It is naturally extensible to hig h er dimen sio n s. T V regular ization enforces a smooth solution (small g radients). R ( x ) = k x k T V = N x Õ i = 1 N y Õ j = 1 q ( x i , j − x i − 1 , j ) 2 + ( x i , j − x i , j − 1 ) 2 (4) The TV ap proach has been u sed by Brad y et al. [3 5] and Endo et al. [39] who demo nstrate that it is super ior to the ℓ 1 regular ization for suffi c ientl y large ob jects. Ho we v er, we will see that T V re g ular ization is substantially mor e compu tationally de m anding that th e ℓ 1 method. W e propo se using the Fused Lasso (FL) r e g ular ization method (5) which is a combin ation of the TV and ℓ 1 nor ms ("fu sion" and "lasso" b eing alter native ter ms f o r TV and ℓ 1 respectivel y ) [4 0]. g ( x ) = λ R ( x ) = λ ℓ 1 k x k 1 + λ T V k x k T V (5) Solutions to the FL prob lem are bo th smooth and sparse while having some character ist ics that make it less c omputationally dem anding than TV . W e solv e the inv erse pr oblem using FIST A (Fas t Iterative Shr inkage- Thr esholding Algor ithm) [41] as implemented for F AST A [42]. Th is m e thod is selected due to its h ig h co n ver gence rate, relativ e simplicity , and similar ity to the approaches of Brady et al. [35] and Endo et al. [3 9]. FIST A is a pr o ximal gr a dient metho d which ma k es use of the pro ximal oper ator [43 ] wh ich can be interpr eted as a g radient s tep with step size L ( 6). pr o x L ( v ) = arg m in x g ( x ) + 1 2 L k x − v k 2 2 ≈ v − L ∇ g ( x ) (6) FIST A has two steps: a shr inkage step using the pro ximal o perator and an acceler ated u pdate using th e previous estimate. The re ader is r e f e rred to the r ef erences for fur ther d etails on FI ST A. The shr ink ag e step of FIST A is by far the most co mputationally complex (the accelerated up date uses only ba sic ar ithmetic), takin g the f or m: x k = pr o x λ L ( x k − 1 − L ∇ f ( x k − 1 )) (7) As such, the co mputational cost of FIS T A is closel y linked to that of e valuating the p r o ximal operator. For the ℓ 1 regular izer, the pro ximal operato r ha s a simple c losed-f or m solution as so f t thresholdin g pr o x λ L ( v ) = 1 − λ L | v | + si g n ( v ) (8) Ho we v er , the p ro ximal f or the TV functio n do es not hav e a closed-f or m solution an d r equires an iterativ e solution, f or which we use the gr a d ient p r ojection method of Bec k & T ebou lle [44]. This metho d requires storage of each directional de rivativ e for the duratio n of the iterations which ma y require a substantial amount of memor y . The FL regular ization function has the useful p roper ty that it is separable and can be co mputed by soft thresholding the solution to the TV problem (i.e. with λ ℓ 1 = 0). B ecause th e non- sp arse TV solution must first be computed before soft thresholding to prod u ce th e sparse FL solutio n, high memo ry r equirements of the TV proximal stil l apply within each FIS T A step ev en tho u gh the result is sparse. W e limit o u r TV regular ization to 2D planes whic h can be compute d independe n tl y , red ucing the memor y requirements to those of a sing le plane. It is w or th notin g that pr ior comp ressiv e holog raphy methods using T V reg ular ization hav e repor ted only the 2D var iant. Because FIS T A is an iterative solu tion metho d, the computational time required to process a single image m a y be relativel y high. PT V r equires processing thousands of large, w ell- resolv ed v olumes. Th e ref ore, it is crucial to reduce the processing time to a man ageable le v el to enable applicatio n to real flo w studies. W e utilize a CUD A/C++ GPU im plementation of our algor ithm to accelerate the processing. Ke y compo nents such as the fast Four ier transf or m (FFT) already hav e effi cient GPU librar y implementation s while the reco n struction ker nel and pro ximal operator larg ely u se h ighly pa rallelizable pixel-wise oper ations. Ho we v er , a re a so nably sized reconstr uction volume ( 1 024 × 1024 × 102 4 vo xels) w ould require ap pro ximately 8 GB to s tore in memory (co mple x floating-p oint values, 8 bytes each). Se veral additio nal var iables of this size are need ed for FIST A. How ev er, contempo rar y GPU memory is limited to appr o ximately 12 GB wh ich w o u ld place limits on th e type of ho logram s which could be processed. In order to circu m vent this challenge, we exploit the spar sity of the ℓ 1 and FL regular ized solutions to dramatically redu ce th e memor y requiremen ts. W e use the co ordinate (commo nl y , COO) sparse matr ix f o rma t to store all v olume data dur ing iterations. The COO f or mat stores the indices (row and column ) an d value f or each no n-zero elemen t in a plane. Because data is accessed per plane f or both the forward a n d r e v erse propagation as well as th e 2D TV proximal o perator, each plane is independently index ed. Th e total s torage f or each non- zero elemen t is thus 24 bytes (8 bytes per index, 8 b ytes for comp le x floatin g -point value) compa red to 8 b ytes per elemen t f or a non- sparse s tr ucture. Thus, mem or y usage should be reduced as lon g as the data sparsity (numb er of zero elements divid ed by total) ex cee d s 67%. Exper ience suggests that most PT V holog rams hav e sparsity ex cee ding 99 % [15, 33]. The p r imar y advantage o f the co mpressiv e holog raphy a p proach is that it p roduces v er y high SNR reconstr uctions that are more easil y segmen ted for p article localization. I n one sense, the sparsity re gular ization inheren tl y separates objects (no n-zero vo xels) from the background (ze r o v ox e ls), thus negating the need f or comple x v olume nor malization and SNR enhan cement such as tha t used b y T olo u i et al. [13] . While these directl y thr e sholded r esults are reasonable, we hav e found that two add itional filters g reatly reduce the instances of ov er - segmentation. The first is a v er y lo w inten sity thr e shold on th e order of 1 / 256 t h of the m aximum in tensity o f the image. This value is selected as any values belo w it w ould be in d isti ngu ishable f r om zero wh e n using a min-max scaling and 8 b it d iscretization f or visualizatio n. Th e secon d filter is a minimu m object volume. This must be adjusted slightly d epending o n the size of the pa r ticles, noise lev el, and apparent elongation length . At this time, it is no t directly linked to th e tr ue par ticle v olume. Usually , objects of 5 v ox els or f ew e r are treated as no ise. While cr ucial f or cou nting th e number of p articles in a single h o logram , these parameters hav e minimal effe c t wh en a p plied to a sequence of im ag es f or which the par ticles ar e tracked b ecause ov er - segmentation noise r arel y persists for multiple frames. While c ompressiv e h ologra p hy and inv erse meth ods h a ve exis ted for ov er a decad e, this is the first application to 3D PT V . Previous uses of a param e tric inv e rse m ethod for p article tracking ( [38, 45–48]) ha ve track ed f e wer than 10 particles concu r ren tl y . Furth ermo re, CH is usually used with a small n umber ( ∼ 10) of re c onstruction plan es with a la rge spacing ( ∼ 1 mm) be- tween p lanes. Here w e demonstrate the ability to reconstr uct v olumes with ov er 100 0 planes with cubic reconstr ucted vo xels. The largest volume reco nstructed by Endo et al. [39 ] contain e d 10 7 v ox e ls wh ile our sparse representation en ables reconstr uction of volumes containing mor e than 10 9 v ox e ls on a desktop computer. The use of the fused lasso regular ization to enforce both smoo thness and sp a rsity has n ot b e en p re viously demon s trated for compre ssive holog raphy . T o emphasize th ese distinctions, we ref er to ou r method as a Regular ized Inv erse Ho lo graph ic V olum e Reconstruction (RIHVR, pro nounced "r iver"). RIHVR dr amaticall y increases the SNR of the reconstru c te d v olum e . This enables pro cessing o f high n oise and high p a rticle concen- tration holog rams (both traits are common in DI H-PTV applications) that could n ot be reliabl y processed usin g exis ting m ethods. Because RIHVR does n ot assume a size o r shape of the object, it can be used when the imaged par ticles are polydisperse or no n -spher ical. W e ne xt present se v eral p ractical examples to demonstrate these capabilities. 3. Demonstration Cases T o demonstrate that the pro posed method is ap plicable to a var iety of DIH-PTV cases, we present the results f or processing f o ur cla sses of holog rams: an isolated nanowire, simulated tracer par ticles in isotrop ic turbulence, swimming m icroorganisms, and an exper imental T - junction flo w seeded with microfibers. The first case, the isolated nanowire, demonstrates improv ed 3D r econstructio n of a co ntinuous o bject with a significant 3D shape. Simulated holog rams then provide a realistic flo w case f or which g round tru th e x ist s f or the par ticle locations. The RIHVR metho d is ev aluated against d econv olu tion (with inv erse iterative par ticle e xtraction wh ere applicab le) which has been previousl y validated a gainst conv entional PIV and sho wn to p r o vide substantial improv em ent o v er other DIH- PT V a p proaches [13 ]. A simple reconstr uction metho d follo wing the appro ach of Pan & M eng [49] (global th resholding f ollow ed by peak intensity depth localizatio n ) is also sho wn f or compar ison. Exper imental h ologram s of swimming microorganisms and microfibers in a T -jun ction flow repr esent rea l measur ement domains f or which so me flo w behaviors are k no wn from pr ior studies. These later cases demonstrate that RIHVR can be app lied to broad measurem ent d omains wher e other DIH-PTV methods f ail. 3.1. Isolated Nanowire b 10 m c 100 nm d 100 nm e 100 nm a 10 m Fig. 1. (a) Recorded holographic image of a 90 nm Ag nano w i re. (b) Hologram after image enhanceme nt. (c) V olumetr ic reconstruction of the sample using the decon v olution method. (d) Rec onstruction using RIHVR with sparsity ( ℓ 1 ) regularization. (e) Recon struction using RIHVR with fused lasso (FL) regular ization. For visualization, (c) uses the intensity as the transparency alpha value whil e (d) and (e) sho w all non-ze ro v alues at equal intensity . A qua litative ev aluation of th e pr oposed inverse reco nstruction meth od uses a silv er nanowire in suspen sion. This is an example of a continu ous object with significant e xtent in all thre e reconstr uction d imensions. The length of the wire is not kno wn a priori . As such, a param etric inv erse m odel such as the o ne used by Soulez e t al. [50 ] is un suitable. T he sample is a suspen sion of 90 nm diameter Ag nano wires in isopropyl alcoh ol. The illumina tio n sou rce is a 450 nm fiber -coupled laser diod e (QPhotonics QFLD-450-10S), collimated using a Nikon CFI Plan Fluor 10 X objective lens. A Nikon CFI Ap o TIRF 100X oil immersion micr oscopic objective and vid e o camera (And or Z yla 5.5 sCMOS) a re used to image the sample. Th e recorded pixel size is 70 nm. The re c orded image (2560 × 2160 pixels) is cropp ed to a 10 2 4 × 1024 pixel r egion around a selected nanowire to ensure that only a single object is in the image and to red uce unnecessar y compu tational cost. Reconstructio n is per f or med at 7 0 nm inter vals (equal to the lateral pixel pitch) for a d epth of 42 µ m (60 0 planes). Mea su rement o f similar samples using DIH has been under taken by Dix on et al. [30] who measured the diffusion of nano wires an d Kempk es et al. [51] who demonstrated a 2 ◦ accuracy f or the or ientation o f microfibers. Unlike the pr ior m e th ods, our approach does not assume a line a r fiber and is suitable for m easurin g non-r igid wires. The raw an d en hanced h ologra ms are sho wn in F igure s 1a and 1b r espectiv ely along sid e render ings of th e reconstr ucted volumes prod uced using deconv olution, RIHVR with sparsity regular ization, an d RIHVR with fused lasso regular ization. The figure sho ws that both regular- ization methods sub s tantially reduce the DOF of the r econstruc tio n. Measured as th e width at half the m easured intensity av eraged along the wire leng th , the DOF decreases from 1.97 µ m using deco n volution to 0.6 3 µ m and 0.89 µ m using the spar sity and fu sed lasso r e gular ization methods respectiv ely . Similar ly , a 99 % decrease in the seg m ented v olume and 90 % decrease in the segmented cro ss-sectional area is ob served between deconv olution and RIHVR (with similar reduction f or both RIHVR reg ular iz e rs). When compar ing the results generated using the sparsity a n d fu sed lasso regular ization methods, the smo othing effect of the fused lasso is ap p arent (Figure 1d an d e). The fused lasso regu larized results sho w f ew er gaps in the wire pro file an d an o v erall more contigu ous object. Ho we v er , this comes a t the co st o f some expansion of th e object an d a sligh tl y larger DOF . Inter polated cross-sections no rmal to the wire axis ( in sets in Figure 1) illustrate that both RIHVR approa ches appro ximate the true circular shape of the wire. Conv ersely , d econv o lu tion (Figure 1c) prod uces an X -shaped cro ss-section character istic of simple holog raphic reconstr uctions. RIHVR also demon s trates rob ustness to image noise. The raw image (Figure 1a) has a substantial amount of b ac kgro und no ise an d ev en enh a ncement via back g round remo val do es not produ ce a noise f r ee image (Figure 1b). Additional fr inge pattern s – cau sed by vibr a tions, fluctuatio ns in illumin ation in tensity , and ou t-of-view ob jects – are visible in the enhanced image but do not result in ar tifacts in the r econstructed v o lume when using RIHVR. 3.2. Synthetic T urb ulent Flow T urbulen t flow s represent the most challenging case for 3D flow mea surements as they a r e highly three-d imensional an d inv olv e v elocity fluctuations acro ss a broad dynam ic range of scales. Here we assess the accur acy and limitations of ou r m ethod u sing simu lated h ologr a ms of a homo geneou s isotrop ic turbu lent flo w . The simulated tracer par ticle trajector ies ar e deter mine d by quer ying th e f orced isotopic tu rbulence data fr om the Johns Hopkin s T urbu lence Databa se with Lag rangian par ticle tracking [52–54]. The simu lation domain is scaled to 5 × 5 × 5 mm 3 and sam pled with a nond imensional time step of 0. 012 (60 DNS tim e steps) to captu re 100 instants (image frames). The R eynolds numbe r based o n the domain size is 23 ,000 and th e Kolmogorov len g th and time scales (smallest scales o f tu r bulent fluctuation s) are 6 7 µ m and 3.7 frames r espectiv ely . The RMS velocity is 6.7 µ m/frame. Maintain in g th e Re ynolds numb er an d using a low viscosity fluid ( ν = 10 − 7 m 2 /s), this cor respon ds to a f rame rate o f 75 kHz which is achie vable with moder n cameras. Th e particles are initiall y rand omly spatially d ist r ibuted throug hout the 3D domain and their positions at subsequent time steps are d etermin ed using a Lag rangian tr a c king method [54]. A period ic boundar y co ndition is applied to the par ticles to ensur e tha t the nu mber o f objects in the field of view is co nstant (this is ignored dur ing processing) . The simulated holog rams are 512 × 51 2 p ixel imag es with a 1 0 µ m pixel size and 632 nm illumin ation wa v elength. The reconstruc tion p lane spacing is equal to the lateral pix el spacin g (1 0 µ m). T h e total size of the reconstru c te d volume is 51 2 × 512 × 700 vo xels ( 1 . 8 × 10 8 ). 1 00 FIST A iter ations are used with r egular ization parame ters λ ℓ 1 = 0 . 5 and λ F L = 0 . 2. For segmentation, the minimu m intensity thresho ld is set to 2 / 256 t h the max imum and the m inimum volume is 5 vo xels. Th e par ticle positions are estimated usin g the weighted centro id of each conn ected componen t and the par ticles are track ed using the me thod of Crock er & Gr ier [55] with a maxim um p er frame displacement o f 7 0 µ m and a minim um track ed dura tion of 1 0 fram es. T w o alter nativ e h o logram reconstr uction methods are presented f or compar ison. The first is a simple reconstr uction method f ollowing the app roach o f Pan & Meng [49] . The second is the deconv olution metho d of T oloui & Ho ng [ 33] with tw o passes of the inv erse iterativ e p article e xtrac tion step. The particle trajectories f or all me th ods are smooth ed with a total variation filter . The tr ac ked results using RIHVR are shown in Figure 2a. a b c z (mm) y x (mm) 0 1 2 5 0 5 0 1 2 3 4 5 6 7 u v w 0.01 0.1 1 10 100 1000 Error U R M S ( ) Rec on struc tion Dec on voluti on RIHV R x y z 0 5 1 0 1 5 2 0 2 5 Positio n Error (voxe ls) Fig. 2. (a) Smoothed 3D pa r ticle trajectories extracted f r om a synthetic hologram using RIHVR. (b) Localization er ror of t r acked par ticles relative to their tr ue location s. (c) E rror in the RMS v elocity components of the three test methods compared to ground truth. T o ev aluate the localization er ror, extracted par ticles a r e matched to their true location us- ing a nearest neighb o r method [55]. Th e resulting er ror distr ibutions in each dimensio n are summar ized in F igure 2b. For all three methods, the er ror in x and y is very small (smaller than the pixel size) . How ev er, the error in z is substantiall y gre a ter , demonstrating the DOF problem . Compar ing the three m ethods, the 75 t h percentile decreases fro m 11.5 v ox els using reconstr uction to 6 vo xels using deconv olution and 3.5 vo xels w ith RIHVR. The same tre nds are seen at the other per centiles as well. Thus, RIHVR pr oduces a 40% imp ro v ement in longitud in al localization o ver the pr ior best method an d a 70% imp ro v ement ov er simple re constructio n. F or turbulenc e measur ements, it is com mon to measure R eynolds stresses which are velocity fluctuation statistics [6]. Here, we pre sent measu r ements o f the root-mean-square (RMS) velocity (Figure 2c). This is comparab le to R eynolds stress when the m e an is zero (as it is f or this flo w) while main taining in tuitiv e m eaning for application s other than flow measurem ent. For this flo w in the per iod du rin g which par ticles a r e simulated, the tr ue RMS v e lo cities av eraged ov er the whole v o lume are (6.3, 7.6, 6.2) v o xels/frame in the u , v , and w directio ns respec tivel y . The trajectory smo othing prod uces a 3 % er ror in the u R M S and v R M S measuremen ts b ut sign ificantl y reduces spu riou s fluctuations in z . Using reco nstruction, the m easured w R M S differs f rom the tr ue value by o ver 800%. This is reduced to 30% using de c onv olutio n. How e ver , this is still unacceptably h igh f or real measurem ents. T h e err or using RIHVR is only 7% which is substantiall y b etter an d on l y 2 × gre a te r than the er ror in the u and v measu rements. As th e velocity vector spacing in PT V is directly related to the par ticle spac in g, the ma x imum par ticle concentr ation is a cr itical con cern for many PT V measurem e nts. The quality of record ed holog rams depends on sev eral factors including the par ticle co ncentration, size, v olume d epth, and image resolution. In general, the extraction rate ( E p , num ber of cor rectly extracted p articles a b 0 2000 4000 6000 8000 1000 0 0 1000 2000 3000 4000 5000 6000 7000 8000 9000 1000 0 Numbe r Extracted Number of Par ticles 0.00 0.01 0.02 0.03 0.04 50 60 70 80 90 100 Ep (%) Concentr at ion ( par ticles/pixel) Re constr uction Deco nvolution RIH VR Fig. 3. (a) Extraction rate f or eac h method f or increasing par ticle con centrations. (b) The number of par ticles which can be accuratel y e xtracted is higher f or RIHVR than the other methods. Solid line is 100% EP , dashed line is 50%. divided by tr ue p article co unt) decreases with in creasing co ncentration. Here we u se the n umber of par ticles per pixel to scale the conce n tration be cause it allo ws f or the most dire c t comp arison with the literatur e. It has p re viou sl y been shown that the commo nl y used shadow density 1 does not com pletel y explain the extraction rate in all situ a tio ns [1 5, 33 ]. For compar ison, T oloui et al. [13] per f or med measurements with a concen tration of 0.003 5 par ticles/pixel while othe r sources used significantly low e r concen trations. Using RIHVR, concentr ations of up to 0.03 5 par ticles/pixel can be pr ocessed wh ile ma in taining E p > 60% (Figure 3a). The increased number of e xtractable par ticles en abled by RIHVR (Figure 3b) enables increa sed resolutio n in v elocimetr y application s and higher particle concentration s in other applications including studies of biologic a l flow s a nd fluid- par ticle interac tio n where high co n centration may be cr ucial f or th e sample being studied. An e xample of such a case is giv en in section 3.3. 3.3. Swimming Algae One practical application of DIH-PTV is the s tudy of microorganism swim m ing b ehaviors. Previous studies hav e u sed small sample volumes ( ∼ 0 . 05 µ L) in o rder to measure the large cell concentr a tion presen t in cultu r es ( ∼ 10 6 cells/mL) [5 , 56 ]. Here w e demo nstrate that RIHVR is sup e r ior to prior DIH alg or ith ms f or these e xp erim e nts. W e a lso demonstrate the ability to record an d proc e ss much larg er sample v olume s ( ∼ 1 µ L) which co uld enable new scientific studies. The alga Dunaliella primolecta is a unicellular species which can be used for b iofuel pro- duction [57 ] . Cells hav e a length of 10 µ m and swim u sing tw o flagella [58]. In this study , D. primolecta is g rown at 37 ◦ C in a g rowt h medium. Manual con centration measu r ements using a micr oscope indicate that the sample h as a concen tration of 1 . 8 × 10 6 cells/mL. The sample contain e r is a 1 0 × 30 × 1 mm 3 glass cuvette. Hologram s a re record ed a t 100 Hz using a 2048 × 1088 p ix el sensor (Flar e 2M360 -CL). The sensor p ix el size is 5 µ m and a 5x micro scopic objective is used. The recorde d sample volume is 2 . 05 × 1 . 09 × 1 mm 3 . For simplicity and spee d, the reco rded image is cro pped to a size of 10 24 × 1024 pixels ( 1 × 1 m m 2 ). The ligh t sou rce is a 5 3 2 nm d iode laser (Tho r labs CPS532) which is e xpand ed and filtered with a spatial filter (see Figure 4a). While th e nu mber of par ticles per pixel is re lativel y low f or this sample (0 . 002), the par ticles are large enou gh that the shadow density (1) bec o mes significant, s d = 18%. Th e maximum shad o w density used by T o loui e t al. [13] was 1 0.5% using d econv olu tion while Malek et al. [ 15] achiev ed an extraction rate of o nl y 20% for s d = 10%. Reducing the measurem ent depth can enable holog rams to be processed u sin g co n ventional methods [58 ], but r isks intro - ducing w all effects th a t in fluence the behavior . Similarl y , we ha v e f ound that dilution of the sample chang es the cell swimm ing behavior . Theref ore, high concentratio n ho lograms – which can o nl y be proc e ssed using RIHVR – are im por tant to these m icr obiological studies. Studies of microorganism behavior using non -holog raphic methods are challenging beca u se their 3 D motion leads to lo w residence time in a micro scopic depth of field and size constraints make multi-camer a imag in g difficult. b c a Laser Spatial Filter Collimating Lens Sample Imaging Lens Camera z (µm) y (µm x (µm) 0 200 400 0 80 1000 200 400 600 800 1000 -6 -4 -2 0 2 4 6 10 - 5 10 - 4 10 - 3 10 - 2 10 - 1 u v w PDF u i '/u i, R M S Fig. 4. (a) DIH imag ing sy stem, recorded hologram, XY projection of processed recon- struction. Scale bars are 100 µ m. (b) Subset (25%) of tracked parti cles. (c) PDF of velocity fluctuations in each direction. T he w dis tri bution has longer t ails and a sharper peak but is not substantiall y wider than t he other two components. The h ologr a phic volume is recon structed with 2 70 planes, separ ated by 3 µ m, with the volume confir med to inclu d e bo th walls of the cuvette. The regular ization parameter s are λ ℓ 1 = 0 . 1 and λ T V = 0 . 1 with 1 00 FIST A iteratio ns and 5 g radient projection steps to evaluate the T V proximal operator. A sequence of 20 0 0 frame s is a n al yzed. I m ages are preprocessed b y re m o ving th e mean of the sequen ce using the m ethod of [4 ] (su btraction follo wed by division by th e square root). A slidin g window of 151 images ( 1.5 sec) is used to compute the m ean background in order to redu ce the effect of cells starting or stoppin g their motion. RIHVR de te c ts and trac ks a n a verag e of 2 9 4 objects per frame. T his is dramatically low er than the e xpected coun t o f 2000 cells/fram e from the con c e ntration measurement. Ho we ver , a su bstantial number o f par ticles ar e seen to remain stationar y on th e two walls. These are treated as backgrou nd noise and ar e remov ed dur ing th e image enh ancement. A selection of 3D tracks is shown in Figure 4b. For clar ity , o nl y a subset of 25 % of the tracked data is shown in Figure 4 wh ile the full de nsity is shown in Figure 5. T h e cell tr a jector ies hav e b een smoothed using a Sa vitzky-Golay filter o f 20 frames. The frame rate is sufficiently high that this filter does not suppr ess any real m otions. Under the assumption that cell swimming m otions are isotropic, the prob ability distribu tion function s (PDF) of velocity fluctu ations (no r mlized by the RMS velocity) are e xpected to coincid e for each compo nent. Figure 4c show s that wh ile the u and v v e lo cities are in good agree m ent, the same is n ot tru e for w , ev en af ter smoothing . This indicates th at the DOF p roblem is not entirely eliminated f or this e xtreme ly noisy case. How ev er, gro ss m o tions in the longitu dinal dire ction are visible a nd fine scale com ple x behaviors such has helical swimming can be seen fr om an enlarged view of the sample (Figure 5). Fig. 5. 2D vie w of the reconstructed cell tra jectories showing comp le x behaviors Also illustrates the tr ue cell concentration of processed vo lume. Scale bars are 100 µ m. 3.4. Rotating Rods in Flow In ad dition to impr o v ements to the measurem ent accuracy and seeding den sity limits, RIHVR enables the me a surement of comple x sh a pes as pr eviously illustrated in Figure 1. Her e we present a flow case where th e seedin g par ticles are rod s rather tha n the usual spher ical trace rs. Using RIHVR, w e are able to e x tract both th e lo cation and or ientation of each rod and track their ev olution in the flo w . Th is type of multimodal measur ement using a single camera h a s not been previousl y repor ted. T o demonstrate this m easurement, we use the T junction flow of the type studied by [59] which occu r s frequen tl y in indu s tr ial an d b iological flo ws. The rotation an d alignme n t of fibers in flo w hav e been e xtensiv ely studied f or targ et app lications in c lu ding paper m anufacturin g and microorganism align m ent (see f or ex ample [60–62]). The fibers used f or the present study are marketed as an additive to strengthen composite materials, where the alignment of the fibers may ha ve an impact o n the mater ial proper ties. Prio r e xp e r imen tal w ork h as either been r estricted to 2D measurements [6 1 , 63] or multi-camera 3 D measur ements o f ind ividual fibers [6 2 ]. Holog raphy is a valuable alter nativ e when the motion is three-dimensional, seeding density is h ig h, or optical access is restricted. The experimen tal channel has a square cross-section with a side len gth of 1 mm. The ju nction is at a r igh t an gle and all thre e b ranches (inlet and 2 outlets) hav e the same geometr y . Th e inlet flo w rate is 1 000 mL/hr which cor respond s to a Re y nolds number R e = 29 0. The seeding par ticles are 7 µ m diame te r SiC ( ρ = 3 g/cm 3 ) micro fibers (Haydale T echnologies) with an aspect ratio of 10. The r esponse time o f the pa rticle, co m puted using the equivalent diameter, is τ p = 14 µ s. T h e c haracte r istic time of the flow is τ f = 1 . 9 ms. The r esultant S tokes number is St k = 0 . 007 in dicating tha t the pa r ticles will trace the flow . A high spe ed video camera (NA C Memre c am HX -5) is used to record the holog rams at 6 000 Hz. A m icroscopic objectiv e (Edmun d Optics, 10x, NA=0.45) is used to imag e the sample, r esulting in a 1024 × 1024 im age with a pixel size of 0 .91 µ m. The lig ht sou rce is a spatially filtered HeNe laser ( λ = 632 n m). The FL regu larizatio n method is used with λ ℓ 1 = 0 . 1 a n d λ T V = 0 . 12. 110 re constructio n planes ar e used with a spacing of 9.1 µ m (10 × the pixel pitch). An in tensity -weighted pr inciple compon ent anal ysis is used to deter mine the or ientation of the fibers (similar to the method of [51]). F or validation of the flo w field, the flow (absent any par ticles) is simulated usin g ANSY S Fluent ( AN SY S, In c.), with the results f ound to be in ag reement with the simulation s o f [5 9] and the e xper imental par ticle pa thlines. The fiber rotatio n rate is modeled using the Jeffer y equation in the limit where the pa rticle aspect r atio is ≫ 1 [6 4, 65]: Û p i = Ω i j p j + ( S i j p j − p i p j S j k p k ) (9) Where p is a unit v ector aligned with the par ticle axis, Ω is the rotation tensor, and S is the strain rate tensor . Because th e par ticle r otation rate is coupled to th e or ientation, the rotation rates for the simulation ( Figur e 6c) assume that the par ticles are initially aligned with th e inlet flo w direction. a 0 0 . 2 0 . 4 0 . 6 0 . 8 1 z (mm) 0 0 . 2 0 4 0 6 0 8 1 y (mm) b z x y d c 0 0 2 0 4 0 6 0 8 1 z (mm) 0 0 2 0 4 0 6 0 8 1 y (mm) 0 0 2 0 4 0 6 0 8 1 z (mm) 0 0 2 0 4 0 6 0 8 1 y (mm) 0 1 0 0 2 0 0 3 0 0 4 0 0 5 0 0 6 0 0 7 0 0 8 0 0 Rotation Rate (s ) -1 Fig. 6. (a) Visualization of the measured rod trajectories. S olid lines sho w t he measured 3D orientation of the rods. Colors indicate indiv idual par ticles. V or ticity isosurfaces ( ω = 3000 s − 1 ) are from the CFD simulation. (b) Vie w of the e xperimental fiber orientations in the yz plane. (c) Con tour map of the par ticle rotation rate ( s − 1 ) e xpected from the simulation. (d) Measured 3D par ticle rotation rate. The exper imental fiber o rien ta tio ns are sh o wn in Figure 6a along with vorticity isosur faces from the simu lation w h ich illustrate that the pr inciple flo w features predicted b y the simulation (tw o v or tices aligned with x ) are present in the e x per iment. A 2D projec tio n of the fibers is sho wn in Figure 6b. The o ptical reconstr uction direction cor responds to the crossflow ( z ) ax is in these figures. The clear appearance of the two counter -rotating vor tices d emonstrates that RIHVR suffi cientl y red uces the DOF to enable the recov er y of this 3 D flow f eature. Additionall y , changes in the or ientation of the fibers can b e seen . The measured rotatio n rate ( | Û p | ) is higher near the ce n ters o f the vortices (F igure 6d) which matches the expected behavior fro m the simulation (Figure 6c). Th e peak rotation s rates are acc u rate to 30% while the location of the peaks are accurate within 0.1 mm. Some discrepancies betw een the measured a n d predicted rotation rates can be attribu ted to misalignmen t between the two doma ins. Because the rotation rate is depen dent on the velocity g radients (wh ich hav e substantial var iation) and on the par ticle location and orientatio n (which hav e so m e mea surement uncer tainty) , ev en small misalignment of the tw o domains w ou ld cause de viation s between the tw o resu lts. Non-ideal flow co nditions, including un steadiness and geometr ical im per f ections, could cause d ifferences in the locations of the vortices and th e pea k ro tation mag nitude. The accur acy of th e machinin g process used to make the channel is ± 0 . 05 mm which is com parable to the peak location erro r . Since the flo w rate is co n stant, u ncer tainty in the channel geometr y also pro duces un c e rtainty in the inlet flo w v elocity . Finall y , the Jeffery equation (9) u sed to p redict th e par ticle rotation rate assumes non-in ertial ellipsoidal particles in St okes flo w . The tru e par ticle motion is e xpected to deviate slightly from this idealization . Giv en these un certain ties, we conclude that th e ag reemen t between the simulation and e x per imental r esults is ad equate f or d emonstrating that RIHVR enables direct 3 D par ticle rotation rate measureme n ts. 4. Conclusions W e hav e demonstrated the application of CH techniques to v olumetr ic reconstr uction, using the presented RIHVR a pproach for the reconstruction an d trac king of 3 D par ticle field s. The re c on- structed v olumes are both spar se and smoo th, assumptions tha t apply equall y f or most par ticle tracking ap plications. The use o f GPU processing and sparse storage en able th e reconstru ction of v olumes contain in g o v er 10 9 v ox e ls wh ich is order s of magn itude larger tha n previously repo rted f or any CH m ethod. RIHVR p ro vides a substantial imp ro v ement in the lon gitudinal position and displacement m easurement accu racy in ad dition to an increase in the pa rticle concen tration limit. These improv ed capabilities ha ve allow ed th e e xten sion o f DIH- PTV to the trac king of a dense culture of microo rg anisms and measurin g the or ientation of microfibe r s in 3D flow . RIHVR is a b roadly applicable ap proach capable of en abling lo w-cost 3D measurements for wide-rang ing applications. Funding National Science F ound ation (NSF) (1427014 ); Univ ersity of Minnesota I nf or matics I nstitute. Ac knowledgments W e ac know ledge the assistance of San tosh Kumar and Jiaqi Y ou in perform ing m easurements presented here. References 1. T .-C. Poon and J.-P . Liu, Introduc tion t o Modern Digital Hologr aphy with MA TL AB (Cambridg e U niv ersity Press, 2014). 2. J. Katz and J . Sheng, “Appl ication s of Holo graphy in Flui d Mechanics and Par tic le Dynamic s, ” Annu. R ev. Fluid Mech . 42 , 531–555 (2010). 3. X. Y u, J. Hong, C. Liu, and M. K. Kim, “Re vie w of digital holographic microscop y f or three-dimen sional profiling and trac king, ” Opt. Eng. 53 , 112306–112306 (2014). 4. M. Seifi, C. Fournier , N. Grosjean , L. Méès, J. -L. Marié, and L. Denis, “A ccurate 3D tracki ng and size measurement of e vapora ting droplet s using in-lin e digita l holograph y and "in ve rse problems" re constructi on approac h, ” Opt. Express 21 , 27964 (2013). 5. M. Molaei , M. Barr y , R. Stoc ker , and J. Sheng, “Fail ed escape: Solid surfaces pre ven t tumbling of Escherichia coli, ” Ph ys. R ev. Lett. 113 , 1–6 (2014). 6. J. Sheng, E. Malkiel , and J. Katz, “Buffer la yer st ructures associated with extre me wal l stress ev ents in a smooth wa ll turbulent boundary la ye r, ” J. Fluid Mech. 633 , 17–60 (2009). 7. C. Zhang, R. Miorini , and J. Katz, “Integrating Mac h-Zehnder int erferomet ry with TPIV to measure the time - resol v ed def ormation of a compliant wall along with the 3D v elocity field in a turbule nt channel flow, ” Exp. Fluids 56 , 1–22 (2015). 8. M. T oloui, A. Abraham, and J. Hong, “Experimental in ves tiga tion of turbulent flow o ver surfaces of rigid and fle xible roughness, ” Exp. T herm. Fluid Sci. 101 , 263–275 (2019). 9. M. J. Beal s, J . P . Fug al, R. A. S haw , J. Lu, S. M. Spuler , and J. L. Stith, “Holographic measurements of inhomogeneous cloud mixing at the centimeter scale, ” Science 350 , 87–90 (2015). 10. A. Ozcan and E. Mcleod, “Lensless Imaging and Sensing, ” Annu. Re v . Biomed. Eng 18 , 77–102 (2016). 11. Y .-C. W u, A. Shiledar , Y .-C. Li, J. W ong, S. Feng , X. Chen, C. Chen, K. Jin, S. Janamian, Z. Y ang, Z . S. Ballard, Z. Göröcs, A. Feizi, and A. Ozcan, “Air quali ty monitoring using mobile m icro scopy and m ac hine learning, ” Light. Sci. & Appl. 6 , e17046 (2017). 12. K. Hinsch, “Holographic particle imag e v elocimetry, ” Meas. Sci. T echnol . 13 , 61–72 (2002). 13. M. T oloui, K. Mallery , and J. Hong, “Improv ements on digita l inline holographic PT V for 3D wall -bounded turbule nt flo w measurements, ” Meas. Sci. T ec hnol. 28 (201 7). 14. H. Ling, S. Srinivasa n, K. Golovi n, G. H. McKinle y , A. T uteja, and J. Katz, “High-resolut ion ve locity measurement in the inner par t of turbulent boundary la yers ov er super -hydrophobi c sur f aces, ” J. Fluid Mech. 801 , 670–703 (2016). 15. M. Malek, D. Allano, S. Coëtmell ec, and D. Lebrun, “Di gital in-line holography : influence of the shadow density on particle field ext raction.” Opt. exp ress 12 , 2270–9 (2004). 16. W . Chen, L. Tian, S. Rehma n, Z . Zhang, H. P . Lee, and G. Barbasta this, “Em pirica l concent ration bounds f or compressiv e holographic bubble imaging based on a Mie scattering model, ” Opt. E xpress 23 , 4715 (2015). 17. J. Zhang, B. T ao, and J. Katz, “T urbulent flo w m easurement in a square duct with h ybr id hol ographic PIV, ” Exp. Fluids 23 , 373–381 (1997). 18. V . Kebbel , M. Adams, H.-J. Har tmann, and W . Jüptner , “Digita l holography as a versa tile optical diagnost ic m etho d f or microgra vity expe riments, ” Meas. Sci. T echnol . 10 , 893–899 (1999). 19. N. A. Buchmann, C. Atkinson, a nd J . Sor ia, “Ul tra-high-spe ed tomographic digital holo graphic v elocimetry in supersonic par ticle -laden je t flow s,” Meas. Sci. T echnol. 24 (2013). 20. J. Gao and J. Katz, “Self-calibra ted m icrosc opic dual-vie w tomographic holograph y for 3D flow measur ements, ” Opt. Express 26 , 16708–16725 (2018). 21. L. Cao, G. Pan, J. de Jong, S. W oodwa rd, and H. Meng, “Hybrid digital holographic imaging syst em f or three- dimensiona l dense par ticle field measurement.” Appl. optics 47 , 4501–4508 (2008). 22. D. Allano, M. Malek, F . W alle, F . Corbin, G . Goda rd, S. Coëtmel lec, B. Lecordier , J.-m. Foucaut, and D. Lebrun, “Three-di mensional vel ocity nea r -wal l measurements by digital in-li ne holograph y : ca libratio n and results, ” Appl. Opt. 52 , A9 (2013). 23. S. T alapatra and J. Katz, “Three-dimensi onal v eloci ty m easure ments in a roughness subla y er using microscopic digita l in-line holography and optical inde x matching, ” Meas. Sci. T echnol. 24 , 024004 (2013). 24. C. A. Lindensmith, S. Rider , M. Bedr ossian, J. K. W allac e, E. Seraby n, G. M. Show alter , J. W . Deming, and J. L. Na deau, “A Submersible, Off- Axis Holographic Microscope for Detect ion of Microbia l Motilit y and Mor pholo gy in Aqu eous and Icy Environme nts, ” Plos One 11 , e0147700 (2016). 25. J. Kühn, B. Ni raula, K. Liew er , J. Kent W allace, E. Serabyn, E. Graff, C. Lindensmith, and J. L. N adeau, “A Mach -Zender digit al holographic microscope wit h sub-micromet er resolution f or imaging and trac king of m arine micro-or ganisms, ” Re v. Sci. Instruments 85 (20 14). 26. N. Burns and J. W atson, “Data Extracti on from U nderwa ter Holograms of Marine Organisms, ” OCEANS 2007 - Eur. pp. 1–6 (2007). 27. L. Wi lson and R. Zhang, “3D Locali zation of weak scat terers in digital holographic m icro scopy using Ra yl eigh- Sommerfel d back -propagati on, ” Opt. Express 20 , 16735 (2012). 28. L. Denis, C. Fournier , T . Fournel, and C. Ducotte t, “T win-imag e noise reduction by phase retrie va l in in-line digital holograph y, ” in P r oceedin gs of SPIE, M. Papa dakis, A. F . Laine, and M. A . Unse r , eds. (2005), 2, p. 59140J. 29. T . Latyc he vskaia and H. - W . Fink, “Solution to the T win Image Problem in Holograph y, ” Society 233901 , 1–4 (2007). 30. L. Dix on, F . C. Cheong, and D. G. Gr ier , “Holographic deco nv olution microscop y f or high-re solution particle trac king, ” Opt. Express 19 , 16410 (2011). 31. T . Laty che vskaia, F . Gehri, and H. - W . Fink, “Depth-re solv ed holographic reconstructions b y t hree-dimensio nal decon volutio n, ” Opt . Express 18 , 22527 (2010). 32. T . Latyc he vskaia and H.- W . Fink, “Holographic time-resol ved particle trac king b y means of th ree-dimension al v olumetric decon vo lution, ” O pt. Express 22 , 20994 (2014). 33. M. T oloui and J. Hong, “High fidelity digital inline holographic method for 3D flow measurements, ” Opt. Express 23 , 27159 (2015). 34. F . Soulez, L. Denis, C. Fournier , E. Thié baut, and C. Goepfert, “Inv erse-problem approac h f or particle digi tal holograph y : accurate location based on local optimiza tion.” J. Opt. Soc. Am. A, Opt. imag e s cie nce, visi on 24 , 1164–1171 (2007). 35. D. J. Brady , K. Choi , D. L. Marks, R. Horisaki, and S. L im, “Compressi ve holography .” Opt. e xpress 17 , 13040– 13049 (2009). 36. L. Denis, D. Lorenz, E. Thiébaut, C. Fournier , and D. Trede, “Inline hologram recons truction wit h sparsity const raints.” Opt. letters 34 , 3475–3477 (2009). 37. F . Joliv et, F . Mome y , L. Denis, L. Méès, N. F aure, N. Grosjean, F . P ins ton, J.-L. Marié, and C. Fournie r , “Re gularized recons truction of absorbing and phase obj ects from a single in-line hologram, applic ation to fluid mechanics and micro-biol ogy, ” Opt. Express 26 , 8923 (2018). 38. N. V err ier , N. Grosje an, E. Dib, L. Méès, C. Fournier , and J.-L. Marié, “ Improv ement of the s ize estimat ion of 3D track ed droplets using digital in-li ne holo graphy with join t estimation reconstruction, ” Meas. Sci. T echnol. 27 , 045001 (2016). 39. Y . Endo, T . Shi mobaba, T . Kakue, and T . Ito, “GPU-accelera ted compressive holography, ” Opt. Express 24 , 8437 (2016). 40. R. Tibshirani , M. Sau nders, S. R osset, J. Zhu, an d K. Knight , “Sparsity and Smoothne ss via the Fused Lasso, ” J. R o ya l Stat iscical Soc. Ser. B (Statist ical Methodol. 67 , 91–108 (2005). 41. A. Beck and M. T eboulle, “Fa st g radie nt-based algorithms f or cons trained total variatio n image denoising and deblurring problems, ” IEEE T ransacti ons on Image Process. 18 , 2419–2434 (2009). 42. T . Goldstein, C. Studer , and R. Baraniuk, “A Field Guide to Forward -Backw ard Split ting with a F AST A Implemen- tatio n, ” arXiv: 1411.3406 p. 25 (2014). 43. N. Parikh and S. Boy d, “Prox imal Algorithms, ” Foundati ons Tre nds Optim. 1 , 127–239 (2014). 44. A. Be ck and M. T eboulle, “A Fast Iterativ e Shrinkag e- T hreshol ding Algo rithm, ” Soc. for Ind. Appl. Math. J. on Imaging Sci. 2 , 183–202 (2009). 45. D. Chare yron, J. L. Marié, C. Fournier , J. Gire, N. Grosjean, L. Denis, M. L ance , and L. Méès, “T esting an in-line digita l holography ’in ve rse m etho d’ for the L agrangia n t racki ng of e va porating dro plets in homogene ous nearl y isotropic turbulenc e, ” Ne w J. Phy s. 14 (2012). 46. J. L. Marié, T . Tronc hin, N. Grosjean, L. Méès, O. C. Öztürk, C. Fournier , B. Barbier , and M. Lance, “Di gital holographic m easurement of the Lagrangian e vap oration ra te of droplets dispersing in a homogeneou s isot ropic turbule nce, ” Exp. Fluids 58 , 1–13 (2017). 47. M. Seifi, “Signal processing methods for fas t and accurate reconstructio n of digit al holograms, ” Ph.D. thesis (2013). 48. N. V er rier , C. Fournier , and T . Fournel, “3D trackin g the Bro w nian motion of co lloidal particles using digital holographic microscop y and joint reconstructio n, ” Appl . Opt. 54 , 4996 (2015). 49. G. Pan and H. Meng, “Digital holograph y of particle fields : reconstruction b y use of comple x amplitude, ” Appl. Opt. 42 , 827–833 (2003). 50. F . Soule z, L. Denis, E. Thiébaut , C. Fournier , and C. Goepf er t, “Inv erse proble m approac h in particle digita l holograph y : out-of-field par ticl e detect ion made possible.” J. Opt. Soc . Am . A, Opt. image science, vision 24 , 3708–3716 (2007). 51. M. Kempkes, E . Darakis, T . Khanam, A. Ra jendran, V . Kariwal a, M. Mazzotti , T . J. Naught on, and A. K. Asundi, “Three dimensional digital holographic profiling of micro-fibers, ” Opt. e xpress 17 , 2938–2943 (2009). 52. Y . Li, E. Perl man, M. W an, Y . Y ang, C. Mene ve au, R. Burns, S. Chen, A. Szala y , and G. Eyink, “A public turbule nce databa se clus ter and applicat ions to study Lagrangian ev oluti on of vel ocity increments in turbulence , ” J. T urbul. 9 , N31 (2008). 53. E. Per lman, R. Burns, Y . Li, and C. Menev eau, “Data e xploratio n of turbulenc e simulations using a database cluste r, ” Proc. 2007 A CM/IEEE Conf. on Supercomput . (SC ’07) (2007). 54. H. Y u, K. Kano v , E. Per lman, J. Graham, E. Frederix, R. Burns, A. Szala y , G. Eyink, and C. Menev eau, “St udying Lagrangian dynamics of turbulence using on-demand fluid par ticl e tra cking in a public turbulen ce datab ase, ” J. T urbul. 13 , 1–29 (2012). 55. J. C. Croc ker and D. G. Grier , “Methods of Digi tal Video Microscop y f or Collo idal Studi es, ” J. Colloid Int erface Sci. 179 , 298–310 (1996). 56. M. Bedrossian, M. E l-Khol y , D. Neamati, and J. Nadea u, “A machine learning algorithm for identi fying and tracki ng bacte ria in three dimensions using Digital Holographic Microscop y, ” AIMS Bioph y s. 5 , 36–49 (2018). 57. H. M. Amaro, A. C. Guedes, and F . X. Malcat a, “Adv ances and perspectiv es in using m icroa lgae to produce biodiese l, ” Appl. Energy 88 , 3402–3410 (2011). 58. A. Chengala , M. Hondzo, and J. Sheng, “Microal ga propels along vo r tici ty directio n in a shear flow, ” Phy s. Re v. E - Stat. Nonlinear , Soft Matter Ph ys. 87 , 1–7 (2013). 59. D. Vigolo, S. Radl, and H. A. Stone, “Une xpected trapping of par ticles at a T junction, ” Proc. Natl . Acad . Sci. 111 , 4770–4775 (2014). 60. M. Shin and D. L. Koc h, “Rotat ional and translati onal di spersion of fibres in isotropic turbulen t flow s, ” J. Fluid Mech . 540 , 143–173 (2005). 61. E. Katz, A. L. Y arin, W . Salalha, and E . Zussm an, “Alignment and self-assembl y of elongated micronsize rods in se ver al flow fields, ” J. Appl. Phy s. 100 (2006). 62. S. Parsa, E. Calza v arini, F . T oschi, and G. A. V oth, “Rota tion rate of rods in tur bulent fluid flo w, ” Phy s. Re v. L ett . 109 , 1–5 (2012). 63. S. Parsa, J. S. Guasto, M. Kishore, N. T . Ouellette , J. P . Gollub, and G. A. V oth, “Rota tion and alignmen t of rods in tw o-dimensional chaotic flow, ” Phy s. Fluids 23 , 043302 (2011). 64. G. B. Jeffery , “The Motion of Ellipsoidal Particles Immersed in a Viscous Fluid, ” Proc. Ro ya l Soc . A: Math. Phy s. Eng. Sci. 102 , 161–179 (1922). 65. G. G. Marcus, S. Parsa, S . Kramel, R. Ni, and G. A. V oth, “Measure ments of the solid-body rotati on of anisotropic particles in 3D turbulence , ” New J. Ph ys. 16 (2014).
Original Paper
Loading high-quality paper...
Comments & Academic Discussion
Loading comments...
Leave a Comment